
IMPROVEMENT AND VALIDATION OF AN AUTOMATED
NEONATAL SEIZURE DETECTOR
P. J. Cherian
1
, W. Deburchgraeve
2
, V. Matic
2
M. De Vos
2
, R. M. Swarte
3
, J. H. Blok
1
, P. Govaert
3
, S. Van Huffel
2
and G. H. Visser
1
1
Department of Clinical Neurophysiology, Erasmus MC
University Medical Center Rotterdam, ’s-Gravendijkwal 230, 3015CE, Rotterdam, The Netherlands
2
Department of Electrical Engineering (ESAT), Katholieke Universiteit Leuven
Kasteelpark Arenberg 10, 3001 Leuven-Heverlee, Belgium
3
Department of Neonatology, Sophia Children’s Hospital, Erasmus MC, University Medical Center Rotterdam
Dr. Molewaterplein 60, 3015 GJ, Rotterdam, The Netherlands
Keywords: Neonatal EEG, Neonatal seizure detection, Epilepsy.
Abstract: We present the improvements made to and subsequent validation of an automated approach to detect
neonatal seizures. The evaluation of the algorithm has been performed on a new and extensive data set of
neonatal EEGs. Previously, we have classified neonatal seizures visually into two types: the spike train and
oscillatory type of seizures and developed two separate algorithms that run in parallel for their automated
detection. The first algorithm analyzes the correlation between high-energetic segments of the EEG,
whereas the second one detects increases in low-frequency activity (<8 Hz) and then uses an
autocorrelation. An improved version of our automated system (called ‘NeoGuard’) uses more informative
features for classification and optimized parameters for thresholding. The validation was performed on 756
hours of ‘unseen’ continuous EEG monitoring data from 24 neonates with encephalopathy and recorded
seizures. The seizure detection system showed a median sensitivity of 86.9 % per patient, positive predictive
value (PPV) of 89.5 % and false positive rate of 0.28 per hour. The modified algorithm has a high
sensitivity combined with a good PPV whereas false positive rate is much lower compared to the previous
version of the algorithm.
1 INTRODUCTION
Neonatal seizures occur in 1 to 3.5/1000 births and
they represent a distinctive indicator of abnormality
in the central nervous system – CNS (Volpe, 2001).
The etiologies are varied, with the majority being
caused by biochemical imbalances within the CNS,
hypoxic ischemic encephalopathy, intracranial
haemorrhages and infection, and developmental
(structural) defects. Neonatal seizures are associated
with major dysfunction of the CNS and result in
significant sequelae (Holmes, 1998; Miller, 2002).
Therefore, there is a high need for early detection of
the seizures. Seizures detected in the early stages of
life can be treated with anticonvulsant drugs and in
that way, hopefully, further damage to the brain can
be limited. In clinical practice, detection of the
seizures is accomplished by a combination of
clinical observation and visual assessment of the
EEG. However, clinical signs need not always
accompany neonatal seizures. They can manifest as
subtle (Connell, 1989; Malone, 2009) or subclinical
seizures, being only detected by EEG monitoring.
Many algorithms for detection of neonatal
seizures have been published. The best known
methods are based on computing a running
autocorrelation function (Liu, 1992), rhythmic
discharges detection (Gotman, 1994), modelling and
complexity analysis (Celka, 2002). Other approaches
have employed wavelets, frequency content,
entropy, etc., for feature extraction. These features
were then applied for supervised learning and
training of classifiers (Greene, 2007; Zarjam, 2003;
Aarabi, 2006).
At the moment, however, there is no neonatal
seizure detection algorithm which is widely accepted
in clinical practice. The design of a reliable seizure
detection system is a challenging task as neonatal
EEG during seizures has as extremely complex and
variable morphology. Moreover, great difference
among the seizure patterns can be present even
31
J. Cherian P., Deburchgraeve W., Matic V., De Vos M., M. Swarte R., H. Blok J., Govaert P., Van Huffel S. and H. Visser G..
IMPROVEMENT AND VALIDATION OF AN AUTOMATED NEONATAL SEIZURE DETECTOR.
DOI: 10.5220/0003127700310037
In Proceedings of the International Conference on Bio-inspired Systems and Signal Processing (BIOSIGNALS-2011), pages 31-37
ISBN: 978-989-8425-35-5
Copyright
c
2011 SCITEPRESS (Science and Technology Publications, Lda.)
within the same patient (Lombroso, 1996;
Shewmon, 1990).
We have previously published (Deburchgraeve,
2008) an algorithm for automated neonatal seizure
detection. It is designed with an approach which
tries to mimic the decisions made by the clinical
neurophysiologist while visually examining EEG. In
order to detect a neonatal seizure, the human
observer searches for a pattern which shows a
visible change relative to the background EEG. An
additional main characteristic of all seizures is
repetitiveness, as there is always a recurrent pattern
which describes the seizure. Both features were
employed for the algorithm design.
Due to the nature of the problem, the neonatal
seizure detection system has to be very reliable and
robust. Therefore, constant improvement, validation,
and optimization of the algorithm are needed. The
modified version of our detection system, called
NeoGuard, was tested on a new, large set of unseen
EEG data. We present here the results of the
validation of our detection system.
2 METHODS
2.1 EEG Data Set
All EEG data were recorded at the Sophia Children's
Hospital – part of Erasmus MC, the University
Medical Center in Rotterdam, the Netherlands. The
data base is formed from 24 consecutive newborns
with presumed perinatal asphyxia who underwent
video–EEG monitoring for at least 24 hours and had
recorded seizures. The recordings mostly started
within 24 hours of birth. Digital video–EEG with
polygraphy, was registered continuously for 1-3
days using a Nervus
TM
monitor (Taugagreining hf,
Reykjavik, Iceland). Seventeen scalp electrodes
were placed according to the full 10-20 International
System (Cherian, 2009). The sampling frequency
was 256 Hz. It is important to stress that we have
used a completely new data set for this study, with
no overlap with the one that has been described
previously (Deburchgraeve, 2008). All EEG data
was reviewed by a clinical neurophysiologist and the
seizures were visually scored for their onset,
amplitude, frequency, duration, rhythmicity, location
and spread. We defined as ‘definite seizures’
electrographic discharges that showed a clear
variation from background activity, displaying a
repetitive pattern of oscillations or sharp waves or a
mixture of both, lasting ≥10 seconds, with evolution
in amplitude and frequency over time. We classified
discharges as ‘dubious seizures’ when a) runs of
sharp waves /oscillations or a mixture of both
occurred arrhythmically (with marked variability in
the interval and morphology between individual
complexes for the major part of its duration) or b)
rhythmic discharges of shorter (<10 sec) duration or
periodically occurring sharp waves or mixed
patterns. It was difficult to identify the onset and
offset of such discharges and sometimes difficult to
clearly identify them as a variation from ongoing
EEG background. We chose to group them under
‘seizures’ as they were seen to recur paroxysmally
during the monitoring.
2.2 Updates of the Automated Seizure
Detection Algorithms
During the visual analysis of the neonatal seizures
we have identified two major morphological types.
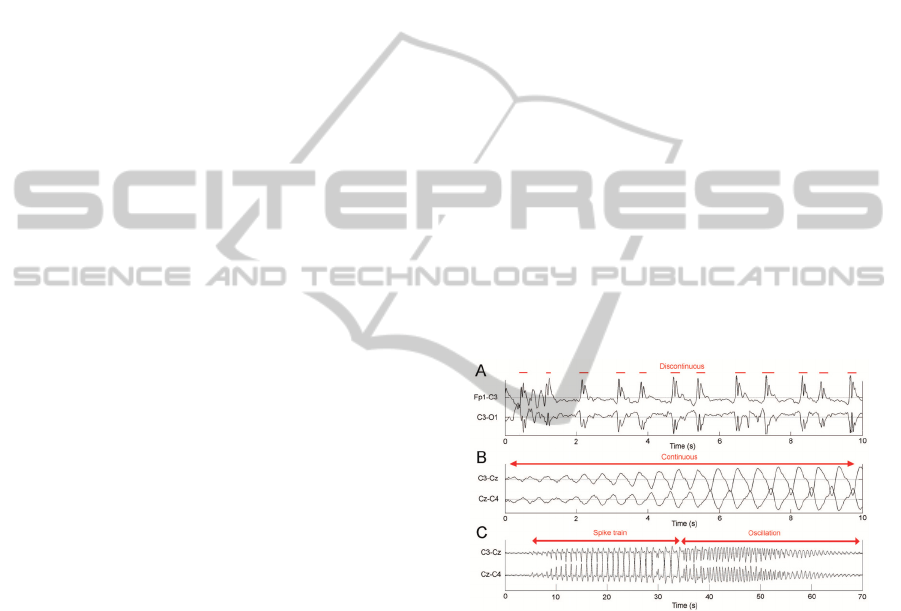
The first one represents the spike train seizures (Fig.
1A), whereas the second one represents the
oscillatory seizures (Fig. 1B). We were able to
classify almost all neonatal seizures as one of the
two types or as their combination (Fig. 1C).
Figure 1: A. Spike train type seizure, B. Oscillatory type
seizure, C. Combination of both morphologies.
The most prominent difference between the two
seizure types is that the oscillatory type is
continuous in time, whereas the spike train type
consists of distinct, isolated spikes. Additionally, the
oscillatory type is characterized by low frequency
content and spikes represent a highly dynamic
signal. Therefore, two separate algorithms were
developed and different stages are discussed in detail
in our previous work (Deburchgraeve, 2008). The
basic idea to detect a spike train seizure is to
segment isolated spikes and to compare their
morphology. We will regard spike train as a seizure
if the overall similarity between spikes is sufficiently
BIOSIGNALS 2011 - International Conference on Bio-inspired Systems and Signal Processing
32
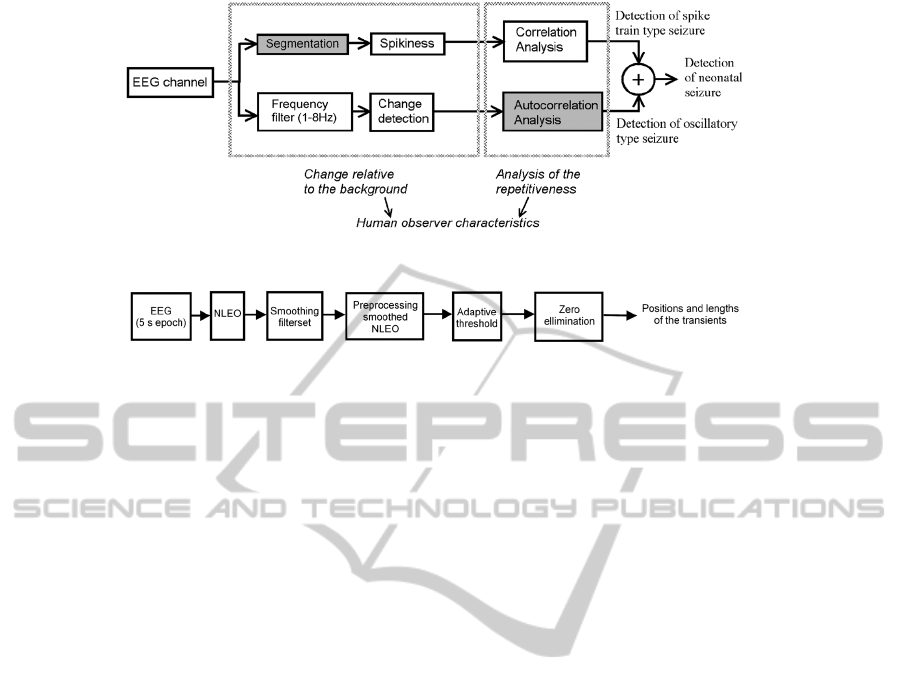
Figure
2: Schematic overview of the complete neonatal seizure detection algorithm.
Figure 3: Schematic overview of segmentation steps of the spike train detection.
high. On the other hand, oscillatory seizures are
continuous and have low frequency values. At first,
we detect the oscillatory segments by filtering and
monitoring the increase of the low frequency content
(< 8 Hz). After that, we examine the presence of
oscillatory seizures by analysis of the
autocorrelation function of the corresponding signal
segment. The updated stages of the detection
algorithm are shaded in grey in Fig. 2. The most
important improvement concerns a change in the
segmentation strategy for the spike train type
detection. As far as the detection of the oscillatory
seizures is concerned, only the analysis of the
autocorrelation function has been changed. Details
on the other blocks can be found in the previous
paper (Deburchgraeve, 2008).
2.2.1 Segmentation of the Spike Train
Signal
The segmentation of the EEG sharp transients is
important for the reliability of the spike train
detection algorithm. This segmentation is performed
separately on each channel of EEG, on a window of
5 seconds duration. There is an overlap of 4 seconds
between subsequent windows under analysis. Fig. 3
shows a schematic overview of the updated
algorithm.
We use the non-linear energy operator (NLEO)
again to detect the local presence of a high
frequency activity. In its discrete form it is given by:
() () ( ) ( )
2
11
kaiser
xn x n xn xn
ψ
⎡⎤
=−−⋅+
⎣⎦
(1)
The key property of the NLEO can be derived if we
apply it on the discrete sinusoidal signal (Li, 2007):
(
)
(
)
()
()
0
22 22
00
cos
sin
kaiser
xn A n
xn A n A
ωθ
ψ
ωω
=+
⎡⎤
≈≈
⎣⎦
(2)
When applied to spike train type seizure EEG, the
NLEO effectively amplifies the high-frequency
spikes while, on the other hand, attenuates the
background EEG. The NLEO calculates the local
energy of the signal using only a few samples.
However, the spikes of a neonatal spike train type
seizure vary in duration and can be of 50 ms length
up to 500 ms. In order to adjust the sensitivity of the
NLEO to the duration of the spikes, its output needs
to be smoothed. However, it is not possible to find a
single smoothing filter length that is adequate for
both short (50 ms) and long (500 ms) duration
spikes. This problem is solved by using a smoothing
filter bank with 6 Moving Average (MA) filters with
filter lengths of 2, 4, 8, 16, 32, and 64 samples
respectively. The output signal of one filter is the
input of the filter with next increasing MA filter
length. The output of the filter bank is the
summation of the outputs of each filter. This
generates a smooth signal in which short as well as
long spikes can easily be discriminated. Fig. 4C
displays the smoothing effect on a spike train type
seizure with spikes of >500 ms duration. The arrows
in Fig. 4B and C indicate that short peaks in the
NLEO output are conserved by the smoothing: only
variations of the NLEO output on a large time scale
are smoothed out. This is exactly the desired
behaviour of the algorithm: to be sensitive to spikes
of both short and long duration.
The goal of the next step is to find an adaptive
threshold to discriminate between high and low
energy values. After thresholding, the parts of the
signal with high energy are transformed to isolated
IMPROVEMENT AND VALIDATION OF AN AUTOMATED NEONATAL SEIZURE DETECTOR
33
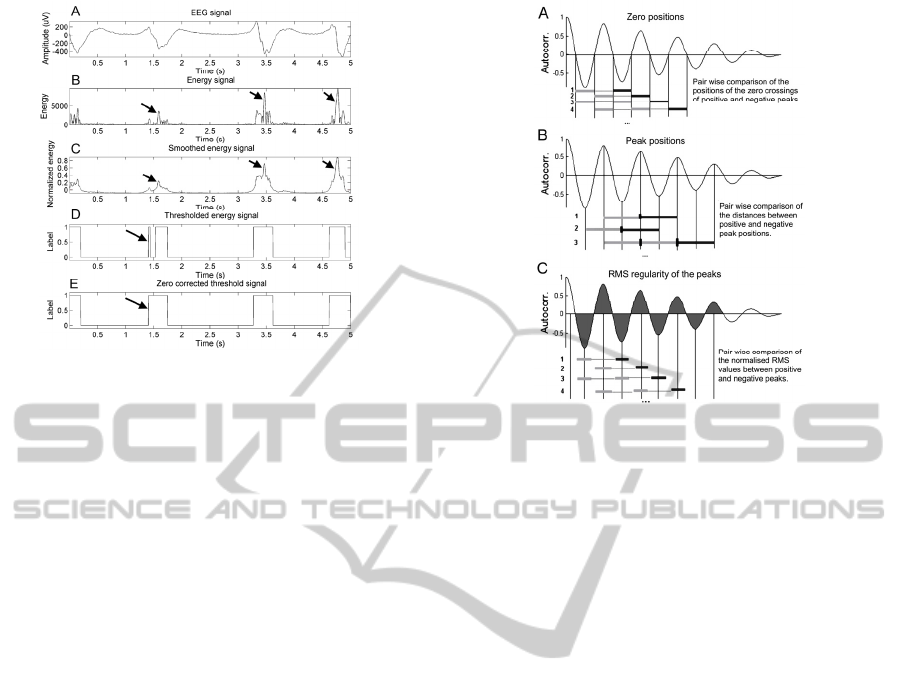
Figure 4: Illustration of the steps of the segmentation.
segments with a certain position and length. The
threshold must be at a level that detects the
transients in the EEG without segmenting small,
insignificant variations in the energy signal. For this
purpose, segmentation is performed for a set of
thresholds between 0 and 1 with a step size of 0.02.
For each threshold, the number of segments above
the threshold is counted. The threshold that leads to
the maximum number of segments is kept as the
definite threshold. If several threshold levels lead to
the same number of segments, the lowest one is
taken.
2.2.2 Detection of the Oscillatory Seizure
Type – Autocorrelation Analysis
As described previously (Deburchgraeve, 2008),
algorithm for the oscillatory seizure type, has to
detect segments with significant increase in the
frequency band of 1–8 Hz. Autocorrelation function
is computed for these segments and new features are
extracted from it in this modified approach. In the
updated version, three features are used to
distinguish quasi–periodic segments:
- Regularity of the distances between the zero
crossings (Fig. 5A), defined as 'errorZeros'.
- Regularity of the distances between the peaks
(Fig. 5B), defined as 'errorPeaks'.
- Regularity of the normalized RMS values of
the peaks which are delimited by the zero crossings
(Fig. 5C), defined as 'errorRMS'.
We have selected these features due to the fact
that for an oscillatory signal, the phases of the
autocorrelation function are regular. Hence, for
oscillatory seizure activity, we may expect that the
defined errors have relatively small values.
Figure 5: Illustration of the extracted features of the
autocorrelation function.
Regularity was measured by means of a pair wise
comparison of all the distances or RMS values
involved. For this purpose, each difference between
an element indicated with a dark grey bar compared
with that indicated by a light grey bars is expressed
as a percentage of their difference in length or area.
(Fig. 5). For seizure detection, the thresholds on the
features were defined as:
- median([errorZeros,errorPeaks]) < 7% and,
- median(errorRMS) < 10%
The comparisons for the zero crossings and the
distances between the peaks can be grouped together
as both represent measures of distance. The
comparisons for the RMS values are treated
separately. All segments with properties below these
thresholds are regarded as a part of an oscillatory
seizure.
2.3 Validation of the Improved
Algorithm
Different approaches for the quantification of the
performance of neonatal seizure detection
algorithms have been proposed by various
researchers. Due to variations in patient population
and methods of data collection, it is difficult to
compare the results of the performance of various
algorithms in a fair way. Therefore, we have decided
to use several parameters to analyze the performance
of the neonatal seizure detector.
We defined the sensitivity per patient (
SensPP),
as the percentage of the number of seizures marked
by the clinical neurophysiologist that are detected:
BIOSIGNALS 2011 - International Conference on Bio-inspired Systems and Signal Processing
34

()
det / 100%SensPP SZ PP SZtotPP=⋅
(3)
with SZtotPP representing the number of seizures
marked by the neurophysiologist for each patient,
and SZdetPP representing the number of
automatically detected seizures for that patient. A
seizure was considered detected when there was a
temporal overlap between the marked seizure and
the detection. The overall sensitivity (for all
patients) was calculated using 2 methods. The first
one, simply averages all sensitivities per patient
(SensT_PP). The second method (SensT) measures
the percentage of seizures detected of all seizures
present in the complete 756 hours dataset. That is,
SensT_PP represents the sensitivity at the patient
level, whereas SensT represents sensitivity at the
seizure level. The importance of the difference is
that in SensT_PP, a patient with only a few seizures
is considered to be equally important as a patient
with many seizures. On the other hand, SensT
considers all seizures equally important regardless of
the patient they occurred in.
In addition, we used Positive Predictive Value
(PPV). that is defined as the percentage of detected
events that match seizures:
()
/ 100%PPV EV SZ EV tot=⋅
(4)
with EV_tot the total number of detected events and
EV_sz the total number of detected seizures (i.e.,
events that overlapped with a seizure marked by the
clinical neurophysiologist). Occasionally, a single
seizure was detected several times by the algorithm.
All such events were combined into a single EV_sz
detection. In practical terms, PPV gives the
probability that the detector has detected a true
seizure for each detection. The duration of the event
is not taken into account. PPV is event-based and,
therefore, depends on the a priori likelihood of
seizures (‘prevalence’) in the dataset. Hence this
measure is difficult to compare between different
data sets. Nevertheless, it is an interesting
performance measure of the detector.
Last but not least, we have quantified a measure
of the number of False Positive detections per hour
(FP/h). This measure directly represents the
practical usability of the algorithm, because each FP
implies that somebody in the neonatal intensive care
unit (NICU) will have to check the patient and the
raw EEG recording unnecessarily.
3 RESULTS
During the analysis, we have examined 756 hours of
EEG data. Median duration of EEG recording was
25 h (range 17 to 78) per patient. The algorithm
gives an output of the number of events detected, the
position in time where the event was detected and
the duration of the detected events. A total of 2103
seizures were scored visually (median 67 per patient,
range 7-236). Detailed results of the validation are
presented in Table 1.
In four patients with severely abnormal EEG
background activity and predominantly dubious
seizures, the algorithm performed very poorly. As it
was doubtful whether this recurring paroxysmal
activity constituted genuine seizures, we excluded
these patients. These were the patients 12, 13, 21, 23
in Table 1. Examples of dubious seizure patterns are
presented in Fig. 6 and 7. In the remaining 20
patients, the algorithm showed a SensPP of 86.9%,
PPV of 89.5% and Fp/h of 0.28/h (in total 643 hours
of EEG data, 1263/1538 seizures detected, SensT
82.1%).
Table 1: Seizure detection results.
N
0
Sz det Sens Fp PPV Fp/h
1 52/53 98 21 84 0.88
2 10/18 56 1 92 0.04
3 28/48 58 19 60 0.42
4 30/34 88 34 47 2.00
5 56/63 89 0 100 0
6 12/13 92 4 75 0.17
7 104/109 95 0 100 0
8 8/8 100 0 100 0
9 93/98 95 0 100 0
10 6/7 86 6 50 0.26
11 110/112 98 6 95 0.29
12 0/210 0 45 0 0.09
13 1/70 1 8 11 0.33
14 47/50 94 3 94 0.13
15 30/72 42 7 81 0.17
16 18/33 55 15 55 0.65
17 95/113 84 1 99 0.04
18 169/200 97 10 94 0.42
19 14/44 32 12 54 0.41
20 10/27 37 69 13 3.45
21 12/156 7 0 100 0
22 170/200 85 10 94 0.42
23 9/129 7 80 10 3.2
24 201/236 85 31 87 0.47
4 DISCUSSION
AND CONCLUSIONS
In this paper, we have presented an improved
version of the previously designed neonatal seizure
IMPROVEMENT AND VALIDATION OF AN AUTOMATED NEONATAL SEIZURE DETECTOR
35
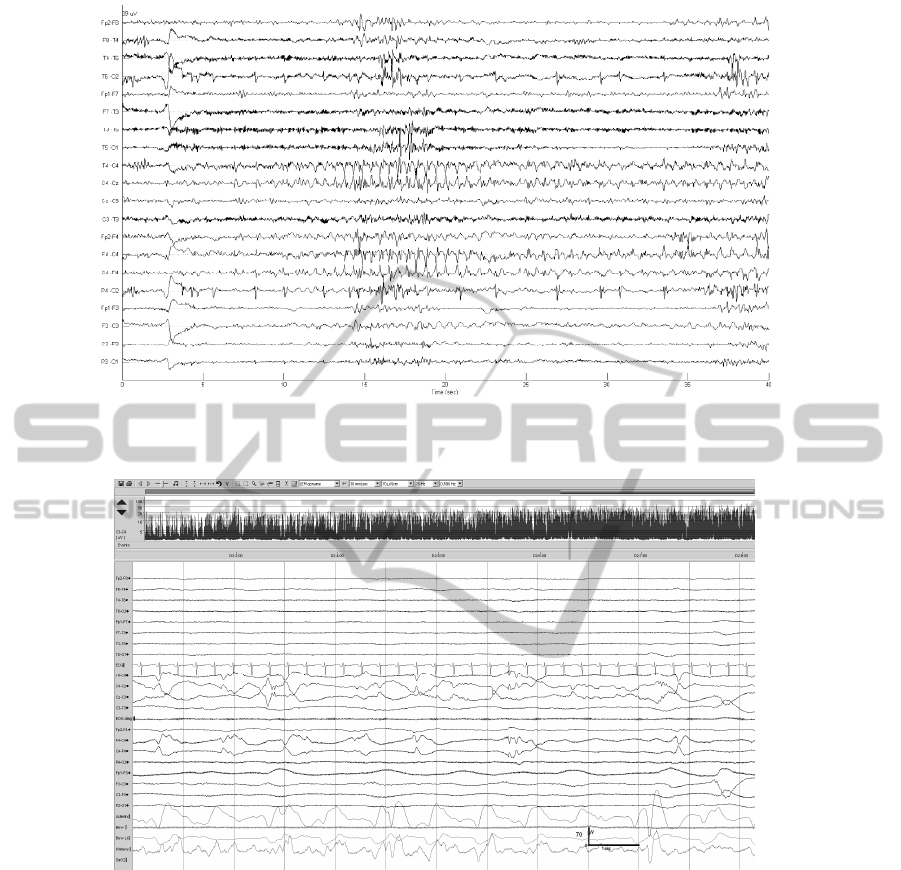
Figure 6: Dubious seizures characterized by brief rhythmic discharges and periodic sharp waves. Such seizures were
variably detected by the algorithm.
Figure 7: Dubious seizure over right central region characterized by a mixture of arrhythmic slow and sharp waves, not
detected by the algorithm.
detector. The validation was performed on a new
and large dataset, which has not been used
previously during the optimization of the algorithms.
These results confirm the suitability of the detection
system for long-term EEG monitoring in a NICU
setting, especially for detecting ‘definite seizures’,
that are similar to the discharges defined by most of
the published literature on neonatal seizures.
Seizures with very low amplitude and short
duration were missed by the algorithm and this has
been reported by other authors as well (Mitra, 2009).
More specifically, automatic detection of arrhythmic
seizures of low amplitude and predominantly
oscillatory morphology was poor, whereas
arrhythmic seizures with sharp wave morphology
were well-detected. As the morphology of the
neonatal EEG is extremely variable, it is difficult to
develop a patient-independent algorithm. Neonatal
seizure definition and classification is still a
developing field, and the performance of an
automated detector depends very much on the
predetermined definition of such discharges.
The clinical significance of the low amplitude
arrhythmic seizures occurring in neonates with
persistent, severely abnormal EEG background
activity (suggestive of severe underlying brain
BIOSIGNALS 2011 - International Conference on Bio-inspired Systems and Signal Processing
36

injury) is debatable, and it is unlikely that detection
and treatment of such paroxysmal discharges
improves clinical outcome. More research needs to
be done to better understand the pathophysiology of
neonatal seizures and the clinical significance of
seizures in patients with varying severity of brain
injury. This is a prerequisite for identifying the types
of seizures whose treatment with antiepileptic drugs
will improve clinical outcome. Refinement of
automated seizure detection methods can then be
done, targeted at this subgroup.
ACKNOWLEDGEMENTS
Research Council KUL: GOA Ambiorics, GOA
MaNet, CoE EF/05/006
Optimization in Engineering (OPTEC), IDO 05/010
EEG-fMRI, IDO 08/013
Autism, IOF-KP06/11 FunCopt, several
PhD/postdoc & fellow grants;
Flemish Government:
* FWO: PhD/postdoc grants, projects: FWO
G.0302.07 (SVM), G.0341.07 (Data fusion),
G.0427.10N (Integrated EEG-fMRI) research
communities (ICCoS, ANMMM);
* IWT: TBM070713-Accelero, TBM070706-
IOTA3, TBM080658-MRI (EEG-fMRI), PhD
Grants; Belgian Federal Science Policy Office:
IUAP P6/04 (DYSCO, `Dynamical systems, control
and optimization', 2007-2011);ESA PRODEX No
90348 (sleep homeostasis)
EU: FAST (FP6-MC-RTN-035801), Neuromath
(COST-BM0601).
REFERENCES
Aarabi A., Wallois F. and Grebe R., Automated neonatal
seizure detection: a multistage classification system
through feature selection based on relevance and
redundancy analysis, Clin Neurophysiol 117(2006),
pp. 328–440.
Celka P. and Colditz P., A computer-aided detection of
EEG seizures in infants: a singular spectrum approach
and performance comparison, IEEE Trans Biomed
Eng 49 (2002), pp. 455–462.
Cherian P. J., Swarte R. M., Visser G. H. Technical
standards for recording and interpretation of neonatal
electroencephalogram in clinical practice. Ann Indian
Acad Neurol 2009; 12: 58-70.
Connell J., Oozeer R., de Vries L., Dubowitz L. M. and
Dubowitz V., Continuous EEG monitoring of neonatal
seizures: diagnostic and prognostic
considerations, Arch Dis Child 64 (1989), pp. 452–
458.
Deburchgraeve W., Cherian P. J., De Vos M., Swarte R.
M., Blok J. H., Visser G. H., Govaert P. and Van
Huffel S., Automated neonatal seizure detection
mimicking a human observer reading EEG, Clin.
Neurophysiol. 119 (11) (2008), pp. 2447–2454.
Gotman J., Flanagan D., Zhang J. and Rosenblatt B.,
Automatic seizure detection in the newborn: methods
and initial evaluation, Electroencephalogr Clin
Neurophysiol 103 (1997), pp. 356–362.
Greene B. R., Boylan G. B., Reilly R. B., de Chazal P. and
Connolly S., Combination of EEG and ECG for
improved automatic neonatal seizure detection, Clin
Neurophysiol 118 (2007), pp. 1348–1359.
Holmes G. L., Gairsa J. L., Chevassus-Au-Louis N. and
Ben-Ari Y., Consequences of neonatal seizures in the
rat: morphological and behavioral effects, Ann
Neurol 44 (1998), pp. 845–857.
Xiaoyan L., Ping Z. and Aruin S. A., Teager–Kaiser
energy operation of surface EMG improves muscle
activity onset detection, Ann Biomed Eng 35 (2007),
pp. 1532–1538.
Liu A., Hahn J.S., Heldt G. P. and Coen R. W., Detection
of neonatal seizures through computerized EEG
analysis, Electroencephalogr Clin
Neurophysiol 82 (1992), pp. 363–369.
Lombroso C. T., Neonatal seizures: a clinician’s
overview, Brain Dev 18 (1996), pp. 1–28.
Malone, A. and Ryan, C. A. and Fitzgerald, A. and
Burgoyne, L. and Connolly, S. and Boylan,
G.BInterobserver agreement in neonatal seizure
identification. Epilepsia, volume 50, 2009, 2097-2101
Miller S. P., Weiss J., Barnwell A., Ferriero D. M., Latal-
Hajnal B. and Ferrer-Rogers A., Seizure-associated
brain injury in term newborns with perinatal
asphyxia, Neurology 58 (2002), pp. 542–548.
Mitra J, Glover J. R., Ktonas P. Y., Thitai Kumar A,
Mukherjee A, Karayiannis N. B., et al. A multistage
system for the automated detection of epileptic
seizures in neonatal electroencephalography. J Clin
Neurophysiol 2009; 26: 218-26.
Shewmon D. A., What is a neonatal seizure? Problems in
definition and quantification for investigative and
clinical purposes. J Clin Neurophysiol 1990; 7: 315-
68.
Volpe J., Neurology of the newborn (4th ed.), WB
Saunders, Philadelphia (2001).
Zarjam P., Mesbah M. and Boashash B., An optimal
feature set for seizure detection systems for newborn
EEG signal, Proc Int Symp Circuits Syst
ISCAS 5 (2003), pp. 33–36.
IMPROVEMENT AND VALIDATION OF AN AUTOMATED NEONATAL SEIZURE DETECTOR
37
