
AN APPLICATION OF THE SPECTRAL KURTOSIS TO MONITOR
CONTAINER GANTRY CRANES’ MACHINERY
Juan Jos´e Gonz´alez de la Rosa, J. M. Sierra, A. Illana, J. A. Carmona, L. M. Calvente
University of C´adiz, Electronics Area, Research Group PAIDI-TIC-168, EPSA
Av. Ram´on Puyol S/N, E-11202, Algeciras, C´adiz, Spain
Antonio Moreno Mu˜noz
University of C´ordoba, Electronics Area, Research Group PAIDI-TIC-168
Campus Rabanales, A. Einstein C-2. E-14071, C´ordoba, Spain
Keywords: Fault detection, Gantry crane, Higher-Order Statistics, Spectral kurtosis, Transient detection, Vibration moni-
toring.
Abstract:
The Spectral Kurtosis (SK) enhances non-Gaussian behavior associated to deviations from the nominal op-
eration of the cranes machinery. This fact easies fault detection, with the subsequent prevention of dramatic
malfunction. In this paper the rotor of a container gantry crane is monitored to get the kurtosis of its normal
operation. Then, two types of rolling bearings faults are modeled, according to the design of the rotors crane.
These signals are added to the real normal operation recordings, and processed under an estimator of the SK.
The experience allows the conformation of a higher-order statistical fault-pattern data base, without the need
of stopping huge machinery, and with the subsequent saving, settling the basis of an automatic surveillance
system.
1 INTRODUCTION
The study of the vibrations in a gantry crane used in
a containers’ terminal is an issue related to the secu-
rity of the crane operators and to the durability of the
design. Vibrations take place mostly in the operator’s
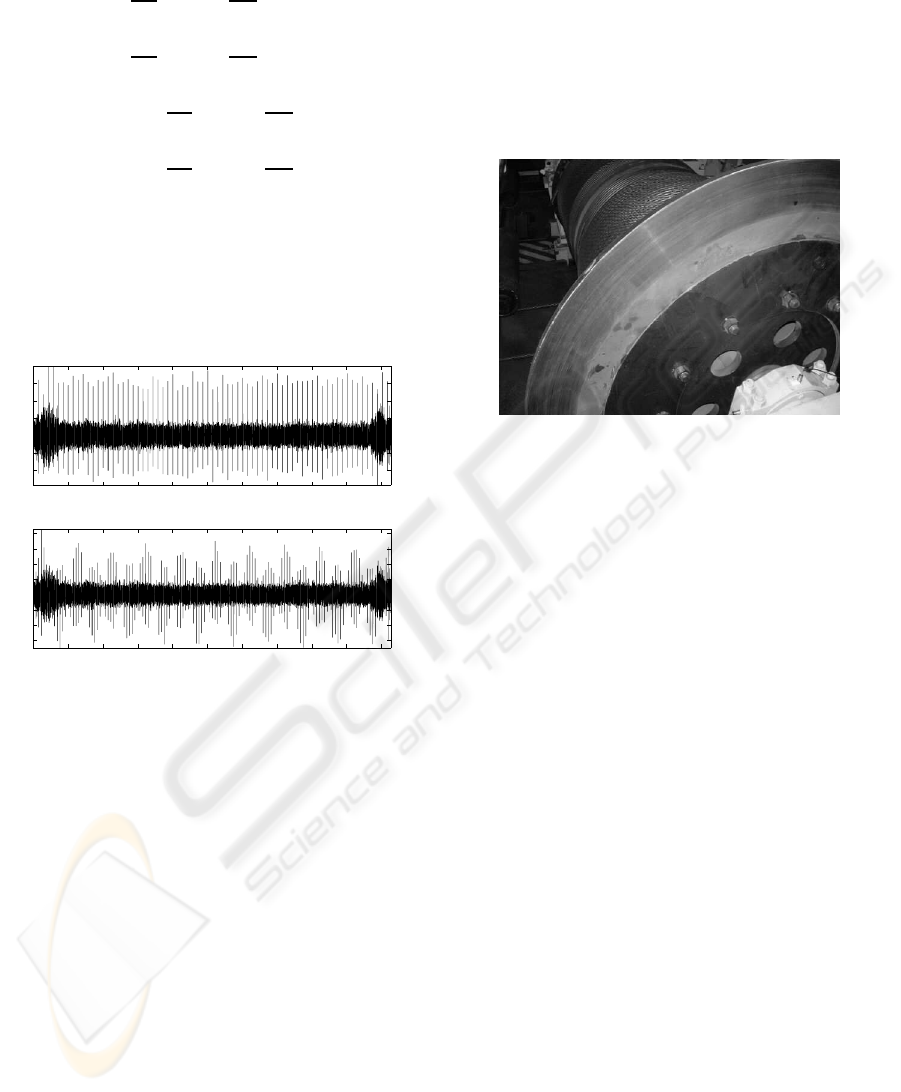
cabin and in the machinery hall; see the photo in Fig.
1 to get a first approximation of the machinery under
test.
Numerous achievements have been made in the
field of the control for overhead crane systems, which
have proven to be an improvement in the position ac-
curacy, safety and stabilization control. To cite: (Ju
et al., 2006; Hua and Shine, 2007; Lee et al., 2007).
Furthermore, in the work (De la Rosa et al., 2007, ),
the cabin system has been modeled with Simulink and
the vibration modes have been separated using the the
independent component analysis, settling the basis of
signal analysis in containers’ cranes systems.
In the field of fault diagnosis, numerous improve-
ments have been made, cataloguing faults within big
machinery. The vast majority of the advances are
based in the traditional power spectral analysis, which
Figure 1: Container Gantry Cranes at Algeciras harbor.
is very sensible to noise and does not offer a com-
plete statistical characterization; in this sense, it is
very well known the potential usability of Higher-
Order Statistics (HOS) (De la Rosa and Mu˜noz, 2008,
). Among them, it is worthy remarkable the improve-
ment described in (Antoni, 2006) and (Antoni, 2007),
319
González de La Rosa J., Sierra J., Illana A., Carmona J., Calvente L. and Muñoz A. (2009).
AN APPLICATION OF THE SPECTRAL KURTOSIS TO MONITOR CONTAINER GANTRY CRANES’ MACHINERY.
In Proceedings of the 6th International Conference on Informatics in Control, Automation and Robotics - Intelligent Control Systems and Optimization,
pages 319-324
DOI: 10.5220/0002154703190324
Copyright
c
SciTePress

where the Spectral Kurtosis (SK) is applied to vi-
bratory surveillance and diagnostics of rotating ma-
chines; faults are modeled herein and characterized
using fourth-order statistics.
In this paper, the application of HOS consists of
characterizing the normal operation of a crane’s ro-
tor. Then, based in this nominal kurtosis, we add
two types of modeled faults to the normal operating
recordings. These faults are associated to different
catalogued defects in the rolling bearings (outer and
inner race defects), in order to obtain their character-
ization based in the SK. The rotor is located in the
machine hall of a container crane; so the described
fourth-order analysis of the pseudo-synthetic signals,
enables characterization without stopping the crane.
Faults are modeled according to the dimensions of the
rolling bearings.
An intermediate result proves the increment of the
non-Gaussian feature of the faults. From the global
calculation (numerical) of the kurtosis, we prove that
the nominal operation is slightly non-Gaussian, and
the kurtosis’ increment is associated to faulty bear-
ings. The main results will be concluded looking at
the frequency patterns of the faults recordings, and
they show the inter-frequency distance associated to
both fault types.
The paper is structured as follows. In Section 2
we make a brief summary on the definition of kurto-
sis; we use an unbiased estimator of the SK, success-
fully used in (De la Rosa and Mu˜noz, 2008, ), where a
higher measurement bandwidth was used. Fault mod-
eling is described in Section 3. Results are presented
in Section 4. Finally, conclusions are drawn in Sec-
tion 5.
2 KURTOSIS AND SPECTRAL
KURTOSIS
In statistics, kurtosis is a measure of the ”peakedness”
of the probability distribution of a random variable X.
Higher kurtosis means more of the variance is due to
infrequent extreme deviations, as opposed to frequent
modestly-sized deviations.
Kurtosis is more commonly defined as the fourth
central cumulant divided by the square of the variance
of the probability distribution, which is the so-called
excess kurtosis, according to Eq. (1):
γ
2
=
κ
4
κ
2
2
=
µ
4
σ
4
− 3, (1)
where µ
4
= κ
4
+ 3κ
2
2
is the 4th-order central mo-
ment; and κ
4
is the 4th-order central cumulant, i.d.
the ideal value of Cum
4,x
(0, 0, 0). This definition of
the 4th-order cumulant for zero time-lags comes from
a combinational relationship among the cumulants of
stochastic signals and their moments, and is given by
the Leonov-Shiryaevformula. A complete description
for these statistics can be found to cite in (Nikias and
Mendel, 1993; Mendel, 1991).
The ”minus 3” at the end of this formula is a cor-
rection to make the kurtosis of the normal distribution
equal to zero. Excess kurtosis can range from -2 to
+∞.
A high kurtosis distribution has a sharper ”peak”
and fatter ”tails”, while a low kurtosis distribution has
a more rounded peak with wider ”shoulders”. Distri-
butions with zero kurtosis are called mesokurtic (e.g
the normal distribution). A distribution with positive
kurtosis is called leptokurtic. A leptokurtic distribu-
tion has a more acute ”peak” around the mean and
”fat tails” (e.g. the Laplace distribution). A distribu-
tion with negative kurtosis is called platykurtic, which
has a smaller ”peak” around the mean and ”thin tails”
(e.g. the continuous or discrete uniform distributions,
and the raised cosine distribution; the most platykur-
tic distribution of all is the Bernoulli distribution).
In Measurement Science, the sample kurtosis is
calculated over a sample-register (an N-point data
record), and noted by:
g
2
=
m
4
s
4
− 3 =
m
4
m
2
2
− 3 =
1
N
P
N
i=1
(x
i
− ¯x)
4
1
N
2
h
P
N
i=1
(x
i
− ¯x)
2
i
2
− 3,
(2)
where m
4
is the fourth sample moment about the
mean, m
2
is the second sample moment about the
mean (that is, the sample variance), and ¯x is the sam-
ple mean. The sample kurtosis defined in Eq. (2)
is a biased estimator of the population kurtosis, if we
consider a sub-set of samples from the population (the
observed data).
In the frequency domain, the ideal SK is a rep-
resentation of the kurtosis of each frequency compo-
nent of a process (or data from a measurement instru-
ment x
i
) (De la Rosa and Mu˜noz, 2008; Vrabie et al.,
2003, ). For estimation issues we will consider M re-
alizations of the process; each realization containing
N points; i.d. we consider M measurement sweeps,
each sweep with N points. The time spacing between
points is the sampling period, T
s
, of the data acquisi-
tion unit.
A biased estimator for the spectral kurtosis and for
a number M of N-point realizations at the frequency
index m, is given by Eq. (3):
ICINCO 2009 - 6th International Conference on Informatics in Control, Automation and Robotics
320

ˆ
G
N,M
2,X
(m) =
=
M
M − 1
(M + 1)
P
M
i=1
|X
i
N
(m)|
4
P
M
i=1
|X
i
N
(m)|
2
2
− 2
.
(3)
This estimator is the one we have implemented in
the program code in order to perform the data compu-
tation and it was also used successfully in (De la Rosa
and Mu˜noz, 2008, ). The estimator convergesin prob-
ability to the quantity being estimated (the true value,
γ
2
) when the number of realizations M and the sam-
ple size N tend to +∞. So we say that the estimator is
asymptotically consistent with respect to M and N .
To show the ideal performance of the estimator,
which has been described in these lines, and also
described in (De la Rosa and Mu˜noz, 2008, ), we
show an example based in synthetics. A mix of
six different signals have been designed. Each mix-
ture is the sum of a constant-amplitude sine of 2
kHz, a constant-amplitude sine at 9 kHz, a Gaussian-
distributed-amplitude sine al 5 kHz, a Gaussian-
distributed-amplitude sine at 18 kHz, a Gaussian
white noise, and a colored Gaussian noise between
12 and 13 kHz. Each mixture (realization or sample
register) contains 1324 points.
Negative kurtosis (”-1”) is expected for constant-
amplitude processes, positive kurtosis (not bounded
peaks) should be associated to random-amplitudes
and zero kurtosis will characterize both Gaussian-
noise processes. This is proved in Fig. 2, which
shows a good performance because enough registers
have been averaged (M=500).
The SK is supposed to behave similarly with syn-
0 5 10 15 20
−60
−50
−40
−30
−20
−10
0
Frequency, kHz
Normalised amplitude, dB
Averaged−normalised power spectrum
2 kHz
fixed ampl.
9 kHz
fixed ampl.
5 kHz
random ampl.
18 kHz
random ampl.
Colored
Gaussian
noise:
12−13 kHz
0 5 10 15 20
−0.5
0
0.5
1
Frequency, kHz
Kurtosis value
Averaged spectral kurtosis
2 kHz, kurtosis≈−1 9 kHz, kurtosis≈−1
5 kHz, kurtosis>0 18 kHz
kurtosis>0
Colored
Gaussian
noise: 12−13 kHz
kurtosis≈0
Figure 2: Performance over a set of synthetics, for M=500
realizations.
thetics associated to bearing fault modeling. As
we find constant amplitude impulses (associated to
faults), an infinite succession of ”-1” should appear in
the SK. This is also taken to measure inter-frequency
distances.
3 FAULT MODELING
Bearing components normally fail in the following or-
der: race defects (the most common), ball or roller
defects and cage defects (unless the bearing was de-
fective when installed). Inner race defects and fail-
ures occur at much lower amplitudes than outer race
defects.
BSF (Ball Spin Frequency) is usually generated
when a ball or roller is defective. When multiple balls
are defective, multiples of BSF appear, i.e., if BSF is
at 800 RPM and four balls have defects, you should
also see a peak at 3200 RPM or 4 × BSF. In all cases,
a surface defect on an inner race, an outer race or on
a roller (ball) generates shocks at the bearing charac-
teristic frequencies.
In a frequency spectrum, defects correspond to
pulse trains of frequencies extending from the 0-1000
Hz range in the domain of vibratory-acoustics. Such
families of peaks merge with the peaks due to other
causes. A real specialist must then deal with the bear-
ing analysis to sort out other causes present in the fre-
quency spectrum. In the vibration frequency range
(typically 10-1000 Hz), the patterns of frequency
spectra may indeed be complex, due to problems of
rotor dynamics; pumps ventilators (blade passing fre-
quencies, vanes, etc). This noise (usually Gaussian)
can be rejected using HOS.
In the present work, we have modeled the outer
race and the inner race faults, which are the most
usual. Both faults are modeled with the same im-
pulses’ amplitudes. The following modeled magni-
tudes are exposed according to the jargon’s nomen-
clature. The rotation speed (RPM/60), f = 1 Hz;
BPFI (Bearing Inner Race Frequency) = 13 Hz; BPFO
(Bearing Outer Race Frequency) = 7 Hz; BSF (Ball
Spin Frequency)
∼
=
1.15 Hz; FTF (Fundamental Train
Frequency)
∼
=
0.35 Hz.
The above magnitudes have been calculated
considering the dimensions of the rolling bearing:
contact angle (α) = zero; B
d
(ball or roller diameter)
= 65 mm; P
d
(pitch diameter) = 215 mm; N
b
(number
of balls, or rollers) = 20. The following expressions
expanded in Eq. (4), allow calculation for the present
situation:
AN APPLICATION OF THE SPECTRAL KURTOSIS TO MONITOR CONTAINER GANTRY CRANES'
MACHINERY
321
BP F O = f ×
N
b
2
×
1 −
Bd
P d
× cos(α)
BP F I = f ×
N
b
2
×
1 +
Bd
P d
× cos(α)
BSF = (f/2) ×
P
d
B
d
×
1 −
Bd
P d
× cos
2
(α)
F T F = (f/2) ×
P
d
B
d
×
1 −
Bd
P d
× cos(α)
(4)
According to Eq. (4), outer and inner faults have
been modeled with the form of impulse trains whose
pulse repetition rate obeys the calculation performed
in Eq (4). Two sample registers are depicted in Fig. 3.
0 1 2 3 4 5 6 7 8 9 10
−4
−2
0
2
4
6
Time, sec.
Acceleration, m/s
2
Outer−fault data, kurtosis=8.513
0 1 2 3 4 5 6 7 8 9 10
−6
−4
−2
0
2
4
6
8
Time, sec.
Acceleration, m/s
2
Inner−fault data, kurtosis=6.316
Figure 3: Two data registers which model both types of
faults in the rotor’s rolling bearings. Impulse repetition:
BPFI (Bearing Inner Race Frequency) = 13 Hz; BPFO
(Bearing Outer Race Frequency) = 7 Hz.
It is also seen in Fig. 3, the background raw data,
which corresponds to normal operation. A SNR of 6
dB has been fixed (variance of the normal vibration,
4; variance of the pulse trains 8). According to this
model, results for the SK analysis are presented here-
inafter.
4 EXPERIMENTS AND RESULTS
We show the experimental location of the sensors in
Fig. 4. Three sensors are primarily connected to the
rotor carcase, aiming to confirm the similarity of the
three signals, in order to reduce the three to one mea-
surement point. The rotor’s structure under test is lo-
cated inside the machine room of the crane (see Fig.
1).
Industrial accelerometers (model KD42V) have
been used with a sensitivity of 100 mV/g, which is
the usual standard in noise and vibration control En-
gineering. The sensors’ usable bandwidth is of 100
kHz. Despite the fact that low-frequency vibrations
are involved, the sampling frequency was set to 10
kHz in order to capture high resolution recordings,
aiming to buried them with modeled impulses’ trains.
Figure 4: A photograph of the rotor and the location of the
sensors.
The kurtosis as a global indicator, considered as
the average of the kurtosis computed for each individ-
ual frequency component, is not a valid tool to extract
features. This is due to the fact that no discrimination
is made neither among the frequency bands nor the
frequency pattern, from the global point of view.
In order to get a reliable characterization, each
register (10 kHz sampled) contains numerous data
(102,714; about 10 sec. sampling). In normal oper-
ation, the mean value of the excess kurtosis is 1.343,
which is somewhat over the Gaussian limit (kurtosis
= 0). For the outer fault case, the median of the kur-
tosis is 8.513. The inner fault is characterized by an
average kurtosis of 6.316. This by the way is an indi-
cation of the type of fault. But the global indication is
very susceptible to errors associated to transients, or
other non-Gaussian noise, and does not provide infor-
mation relative to the frequency bands.
So, the key of the SK detection strategy used in
this work, lies in the potential enhancement of the
non-Gaussian behavior of the vibrations. If this hap-
pens, i.e. if an increase of the non-Gaussian activ-
ity (increase in the kurtosis, peakedness of the prob-
ability distribution) is observed-measured in the SK
graph, there may be deviation from normal function-
ing.
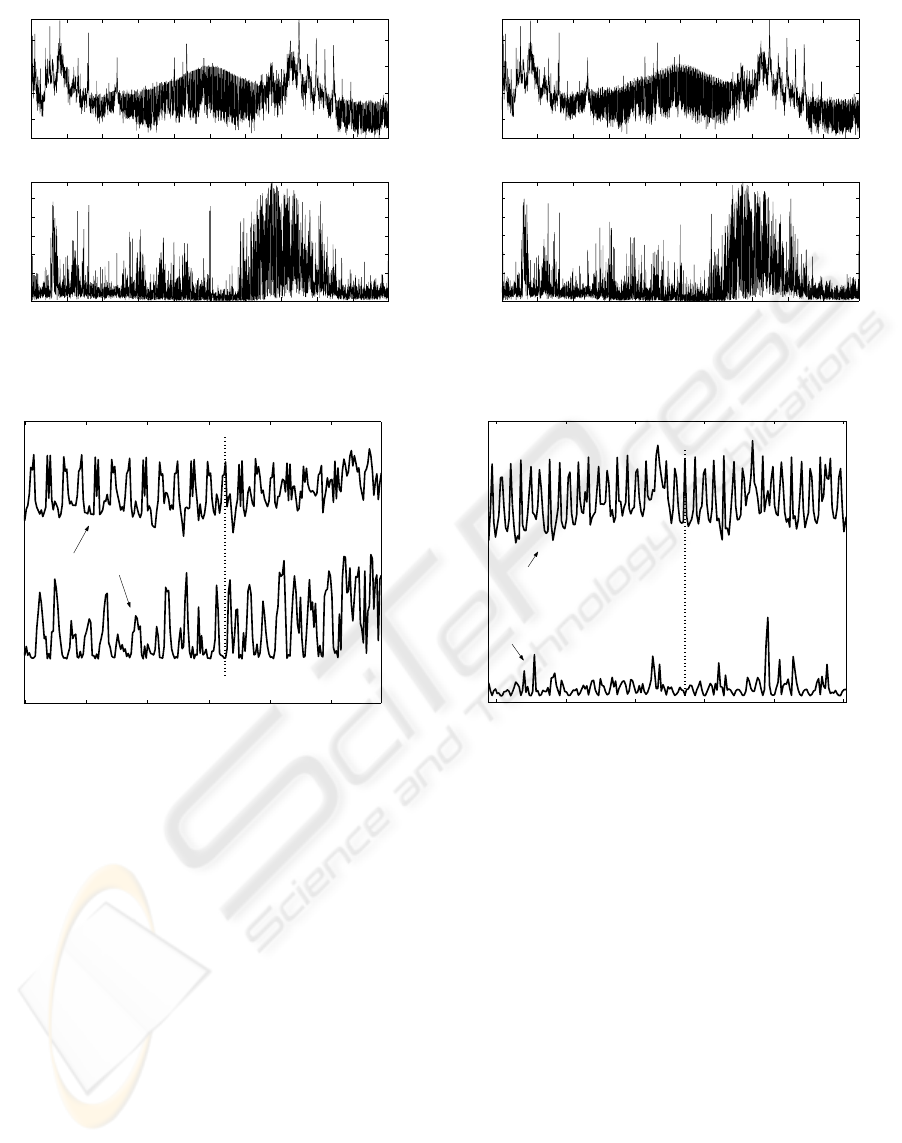
Fig. 5 shows the frequency analysis associated to
one recording, which models an inner race defect in
the rotor bearing. At a first glance, it is difficult to
reach a frequency pattern, but a closer examination
reveals the constant inter-frequency distance which
ICINCO 2009 - 6th International Conference on Informatics in Control, Automation and Robotics
322
0 500 1000 1500 2000 2500 3000 3500 4000 4500 5000
−40
−20
0
20
Frequency, Hz
Amplitude, dB
Inner race fault case
0 500 1000 1500 2000 2500 3000 3500 4000 4500 5000
0
2
4
6
8
10
Frequency, Hz
Kurtosis value
Figure 5: High resolution frequency analysis of an inner
race fault.
2950 3000 3050 3100 3150 3200
Frequency, Hz
Inner race fault case
Spectrum
Spectral Kurtosis
Peak correspondence
Figure 6: High resolution frequency analysis of an inner
race fault. A zoom of Fig. 5. Graphs have been shifted for
convenience. Inter-frequency = 13 Hz.
characterizes this type of fault.
Fig. 7 presents the spectral analysis of an outer
race fault, which is very similar to the inner fault case,
depicted in Fig. 6.
On the basis of the second and fourth-order spec-
tra, we conclude the possibilities of the SK to distin-
guish between two common faults in rotor bearings.
5 CONCLUSIONS AND
ACCOMPLISHMENTS
Results show the potential use of the SK to target
faults in mechanical systems. Concretely, the estima-
tor of the SK is able to discriminate between two dif-
ferent faults, commonly encountered in rolling bear-
ings, and targeted here via the inter-frequency dis-
0 500 1000 1500 2000 2500 3000 3500 4000 4500 5000
−40
−20
0
20
Frequency, Hz
Amplitude, dB
Outer race fault case
0 500 1000 1500 2000 2500 3000 3500 4000 4500 5000
0
2
4
6
8
10
Frequency, Hz
Kurtosis value
Figure 7: High resolution frequency analysis of a fault in
the outer race.
2300 2350 2400 2450 2500 2550
Frequency, Hz
Outer race fault case (zoom)
Spectrum
Spectral kurtosis
Peak correspondence
Figure 8: High resolution frequency analysis of an outer
race fault. A zoom of Fig. 7. Graphs have been shifted to
improve visualization. Inter-frequency = 7 Hz.
tance.
The improved performance of the SK over the
global excess kurtosis resides in the possibility of an-
alyzing separated frequency bands, or inter-frequency
distances, which are more indicative features of faults
than a mere numeric statistical calculation. The kur-
tosis as a global indicator is considered only a prior
indication of the fault.
The interest of the experiment resides in the possi-
bility of incorporate this signal processing algorithm
to the engine of an expert system in order to monitor
on-site performance of machinery, and get a predic-
tive surveillance. This would be done without stop-
ping production of such big machinery.
AN APPLICATION OF THE SPECTRAL KURTOSIS TO MONITOR CONTAINER GANTRY CRANES'
MACHINERY
323

REFERENCES
Antoni, J. (2006). The spectral kurtosis: application to the
vibratory surveillance and diagnostics of rotating ma-
chines. Mechanical Systems and Signal Processing
(Ed. Elsevier), 20(2):308–331.
Antoni, J. (2007). Cyclic spectral analysis in practice. Me-
chanical Systems and Signal Processing (Ed. Else-
vier), 21(2):597–630.
Hua, Y. J. and Shine, Y. K. (2007). Adaptive coupling con-
trol for overhead crane systems. Mechatronics, (-):in
Press.
Ju, F., Choo, Y., , and Cui, F. (2006). Dynamic response of
tower crane induced by the pendulum motion of the
payload. International Journal of Solids and Struc-
tures, (43):376–389.
Lee, D.-H., Cao, Z., and Meng, Q. (2007). Scheduling of
two-transtainer systems for loading outbound contain-
ers in port container terminals with simulated anneal-
ing algorithm. Int. J. Production Economics, (-):in
Press.
Mendel, J. M. (1991). Tutorial on higher-order statistics
(spectra) in signal processing and system theory: The-
oretical results and some applications. Proceedings of
the IEEE, 79(3):278–305.
Nikias, C. L. and Mendel, J. M. (1993). Signal process-
ing with higher-order spectra. IEEE Signal Processing
Magazine, pages 10–37.
De la Rosa, J. J. G. and Mu˜noz, A. M. (2008). Higher-order
cumulants and spectral kurtosis for early detection of
subterranean termites. Mechanical Systems and Sig-
nal Processing (Ed. Elsevier), 22(Issue 1):279–294.
Available online 1 September 2007.
De la Rosa, J. J. G., Puntonet, C. G., Moreno, A., Il-
lana, A., and Carmona, J. A. (2007). An application
of ICA to BSS in a container gantry crane cabin’s
model. Lecture Notes in Computer Science (LNCS),
4666:714–721. 7th International Conference on Inde-
pendent Component Analysis and Signal Separation
(ICA 2007) London, UK, September 9-12, 2007, Pro-
ceedings.
Vrabie, V., Granjon, P., and Serviere, C. (2003). Spectral
kurtosis: from definition to application. In IEEE, edi-
tor, IEEE-EURASIP International Workshop on Non-
linear Signal and Image Processing (NSIP’2003), vol-
ume 1, pages 1–5.
ICINCO 2009 - 6th International Conference on Informatics in Control, Automation and Robotics
324
