
INTERACTIVE ANALYSIS OF MULTIDIMENSIONAL DATA ON
THE WEB BY USING TIME-TUNNEL
Seiji Okajima and Yoshihiro Okada
Graduate School of Information Science and Electrical Engineering, Kyushu University
744 Motooka, Nishi-ku, Fukuoka, 819-0395, Japan
Keywords: Data and knowledge visualization, Interactive data analysis, Web application.
Abstract: In recent years, the Internet has become popular in various application fields so that a huge number of data
records are generated and stored on the web. In this situation, we need any tool that helps us to analyze such
multidimensional data for obtaining new findings from those data. In this paper, we introduce a visual and
interactive analysis tool for multidimensional data called Time-tunnel. Time-tunnel visualizes any number
of time series numerical data records as individual charts each of which is displayed on an individual
rectangular plane called data-wing in a 3D virtual space. Through direct manipulations on a computer
screen, the user easily puts more than two data-wings overlapped together to compare their charts in order to
recognize the similarity or the difference among those data records. Simultaneously a radar chart among
those data at any time point is displayed to recognize the similarity and the correlation among them. This
time, the authors extended Time-tunnel to make it available on the web and this paper clarifies the
usefulness of web-version Time-tunnel by showing practical analysis examples.
1 INTRODUCTION
This paper treats a visual and interactive analysis
tool for multidimensional data called Time-tunnel
developed by our research group (Akaishi and
Okada, 2004; Akaishi and Okada, 2005). This time,
we extended Time-tunnel to make it available on the
web and this paper clarifies the usefulness of web-
version Time-tunnel by showing practical analysis
examples.
Time-tunnel visualizes any number of time-
series numerical data records as individual charts in
a virtual 3D space. Each chart is displayed on a
rectangular plane called data-wing. The user easily
puts more than two different data-wings overlapped
together to compare their data represented as charts
in order to recognize the similarity or the difference
among them. Simultaneously a radar chart among
those data at any time point is displayed in the same
3D space to recognize the similarity and the
correlation among them. However, in Time-tunnel,
only one chart is displayed on one data-wing. If
there are a huge number of time-series numerical
data records, the user has to prepare accordingly
such a huge number of data-wings and practically it
becomes impossible to interactively manipulate
them. To deal with this problem, we enhanced the
functionality of Time-tunnel to enable it to display
the Parallel Coordinates on each data-wing (Notsu et
al., 2005). Due to this functionality enhancement,
the user can visually analyze a huge number of time-
series numerical data records through interactive
manipulations on a computer screen. Furthermore, it
becomes available for the visual analysis of multi-
dimensional data, i.e., database records with a huge
number of attributes by preparing multiple data-
wings, dividing multi-attribute data into several sets
by attributes, and displaying each set of data as
Parallel Coordinates on each data-wing.
In recent years, the Internet has become popular
in various application fields so that a huge number
of data records are generated and stored on the web.
In this situation, we need any tool that helps us to
analyze such a huge number of data records
effectively, e.g., visually and interactively, on the
web. This time, we extended Time-tunnel to make it
available on the web.
The remainder of this paper is organized as
follows. First of all, Section 2 describes related work
and points out the difference of our tool from theirs.
Section 3 introduces details of Time-tunnel and its
Parallel Coordinates version. Then, Section 4
415
Okajima S. and Okada Y.
INTERACTIVE ANALYSIS OF MULTIDIMENSIONAL DATA ON THE WEB BY USING TIME-TUNNEL.
DOI: 10.5220/0001838204150418
In Proceedings of the Fifth International Conference on Web Information Systems and Technologies (WEBIST 2009), page
ISBN: 978-989-8111-81-4
Copyright
c
2009 by SCITEPRESS – Science and Technology Publications, Lda. All rights reserved
describes implementation of Time-tunnel as a web
application. Section 5 presents data analysis
examples using web-version Time-tunnel. Finally
we conclude the paper in Section 6.
2 RELATED WORK
For the visualization of multidimensional data,
Inselberg and Dimsdale introduced Parallel
Coordinates (Inselberg and Dimsdale, 1990), which
visualizes multiple data records as multiple poly-
lines on the same 2D plane at the same time. After
their proposal of Parallel Coordinates, many
modified versions having a variety of additional
features were proposed. For instance there is method
(Artero, 2004, Graham, 2003; Fua, 1999; Johansson,
2005; Siirtola, 2000; Hauser, 2002) that draws poly-
lines in adequate colors and transparency levels
according to their crowding densities, and there is a
similar method for the same purpose (Graham, 2003)
that draws curbed lines instead of poly-lines to
indicate high crowding dense attribute values.
Although we have not implemented these techniques
yet, it is possible technically to introduce them into
our Parallel Coordinates version of Time-tunnel. We
are supposed to do that. Also, there is a unique
proposal (Johansson, 2005) that visualizes Parallel
Coordinates by vertical axes each stands on a circle
in a 3D space. One more vertical axis stands at the
center of the circle. This axis corresponds to the
user selected attribute of database records and other
vertical axes standing on the circle correspond to
several attributes most strongly related to the center
axis attribute. This proposal is interesting but is not
directly related to our proposed system. Our
proposed Parallel Coordinates version of Time-
tunnel visualizes multiple charts like Parallel
Coordinates on one individual rectangular plane.
Time-tunnel originally provides multiple data-wings
in a virtual 3D space so that if the user has a huge
amount of data records, he/she can analyze them by
separating into several groups using multiple
rectangular planes. This is the one advantage of our
Parallel Coordinates version of Time-tunnel.
Another popular data analysis method is based
on star chart or radar chart. As the similar tools,
there are Star Glyphs of XmdvTool (Ward et al.,
1994) and Stardinates Tool (Lanzenberger and Miksch,
2003). Stardinates Tool has combined feature of
Parallel Coordinates and Glyphs (Ward et al., 1994).
Our Time-tunnel has combined feature of Parallel
Coordinates and star chart (radar chart) visualization
tool with interactive interfaces. Moreover, Time-
tunnel has also aspects as a multimedia presentation
tool. These points are further differences of our
Parallel Coordinates version of Time-tunnel from
the above visual analysis tools.
3 TIME-TUNNEL
In this section, we introduce original Time-tunnel
and Parallel Coordinates version of Time-tunnel.
First of all, we describe system configuration of
original Time-tunnel, its components and how Time-
tunnel works for the analysis of multidimensional
data, especially multiple time-series numerical data.
After that, we show Parallel Coordinate version of
Time-tunnel.
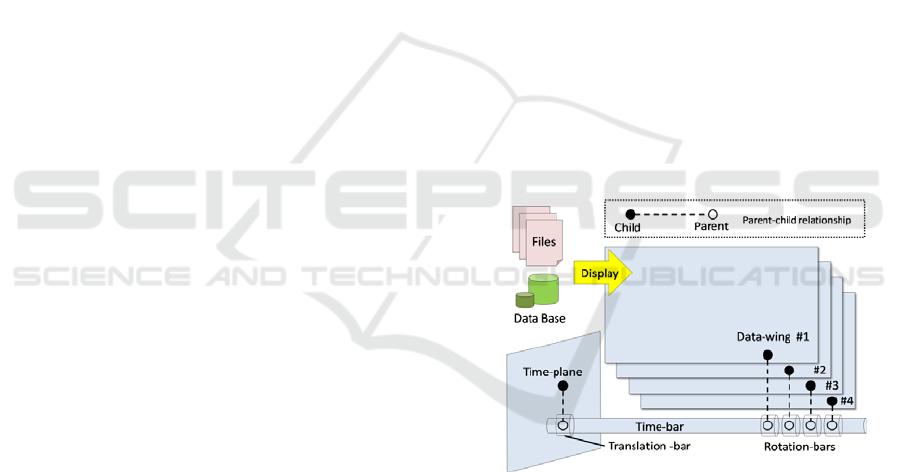
3.1 System Configuration
Time-tunnel consists of three main types of
components, i.e., data-wing, time-plane and time-bar.
Parent-child relationships among data-wings, time-
planes and time-bar are as shown in Figure 1.
Rotation-bar works as the hinge and the parent of
data-wing, and time-bar is the parent of each
Rotation-bar.
Figure 1: Component structure of Time-tunnel.
3.1.1 Data-wing
Data-wing has a shape like a sheet. It displays one
multidimensional data, one time-series numerical
data, as a chart on its sheet. For the visualization of
multiple data, the user can use multiple data-wings
as he/she wants. Each data-wing is connected to
time-bar by its hinge. The hinge is also another
component that has a rotation functionality called
rotation-bar. Therefore, by rotation operations on
data-wings, the user can put multiple charts
overlapped together to compare them. Each time-
series numerical data of each data-wing is sent to
WEBIST 2009 - 5th International Conference on Web Information Systems and Technologies
416
time-bar through rotation-bar. Data-wing keeps one
time-series numerical data. It makes a chart from the
data and displays the chart on its surface.
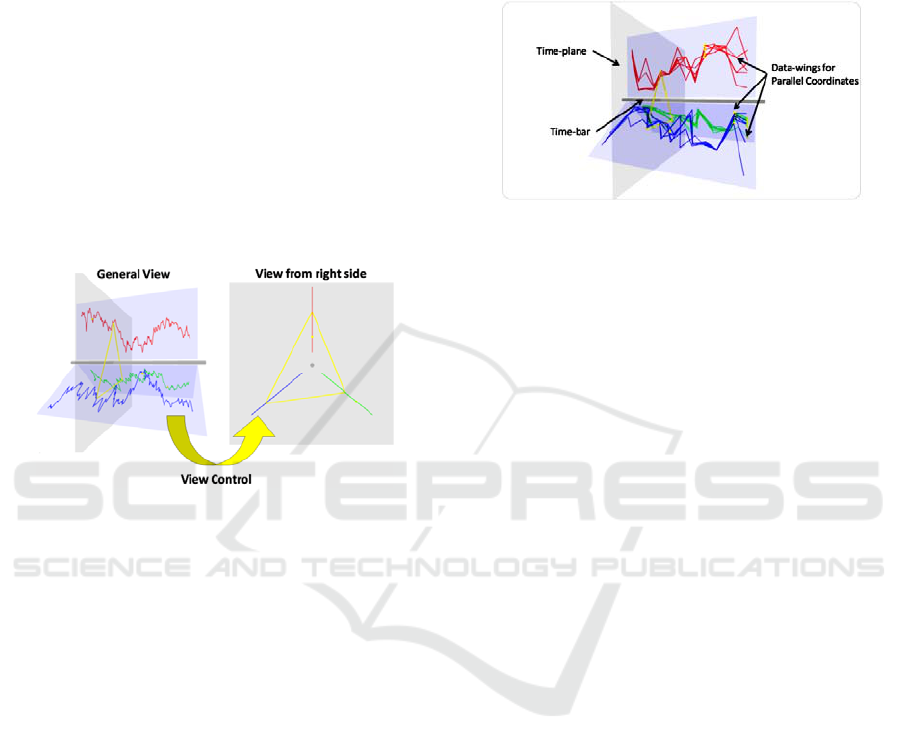
3.1.2 Time-plane
Time-plane also has a shape like a sheet. Time-
plane is connected to time-bar perpendicular to data-
wings and used for displaying a radar chart. Figure 2
shows its detail of the radar chart. Its position data is
sent to time-bar to specify a time of data among
charts to be displayed as a radar chart. Actually
time-plane is connected to time-bar through
translation-bar. Time-plane moves along time-bar by
the user manipulations on the translation-bar,
because the translation-bar is the parent of time-
plane.
Figure 2: Radar chart display.
3.1.3 Time-bar
Time-bar has a thin, long cylindrical shape. Time-
bar works as a time pivot of data-wings. It collects
multiple time-series numerical data from each data-
wing and displays a radar chart on one of time-
planes.
3.2 Parallel Coordinates Version of
Time-tunnel
When visualizing a large number of time-series
numerical data records, the user has to prepare
exactly the same number of data-wings. To deal with
this problem, we extended the functionality of data-
wing as explained in the following.
Figure 3 shows Parallel Coordinates version of
Time-tunnel. We extended data-wing to enable it to
display more than two time-series numerical data
records, i.e., multiple database records as multiple
charts, in it like Parallel Coordinates. Even if there
are a huge number of database records to be
visualized, the user can divide them into several
groups and assign each group to one of the multiple
data-wings of the same Time-tunnel. Since Time-
tunnel has multiple data-wings and displays multiple
Parallel Coordinates using those data-wings, it is
easy to separate database records shown on one
data-wing and to visualize each of them on each of
the multiple data-wings.
Figure 3: Parallel Coordinates version of Time-tunnel.
In this way, the user can visualize a huge number
of database records using Parallel Coordinates
version of Time-tunnel. The user can select one
record that he/she wants to analyze in each data-
wing and the selected chart is soon highlighted.
Since the user can rotate and put any data-wings
overlapped together, he/she can compare his/her
selected records by looking at highlighted charts.
Furthermore, a radar chart among the selected charts
can also be displayed similarly to original Time-
tunnel.
4 IMPLEMENTATION OF
TIME-TUNNEL AS A
WEB APPLICATION
The original Time-tunnel is developed using
IntelligentBox (Okada and Tanaka, 1995) which is a
constructive visual software development system for
interactive 3D graphic applications. IntelligentBox
applications run only on the IntelligentBox system
so that the user needs to install IntelligentBox in
order to use original Time-tunnel.
Web version of Time-tunnel is realized as a flash
content by ActionScript programming with the use
of Papervision3D ActionScript library. The user can
use Time-tunnel through a web browser in which
Adobe Flash Player plug-in is installed. So, it is
possible to provide Time-tunnel functionalities as
one of the SaaS (Software as a Service) applications.
In addition, Web version of Time-tunnel has
JavaScript API to allow the user to embed Time-
tunnel functionalities in his/her own web page and
MashUp is also possible. The functions provided by
the Time-tunnel API are specifically to create new
Time-tunnel in a 3D virtual space, to add new data-
INTERACTIVE ANALYSIS OF MULTIDIMENSIONAL DATA ON THE WEB BY USING TIME-TUNNEL
417
wing to current Time-tunnel, to read database
records and to assign them to data-wings, and so on.
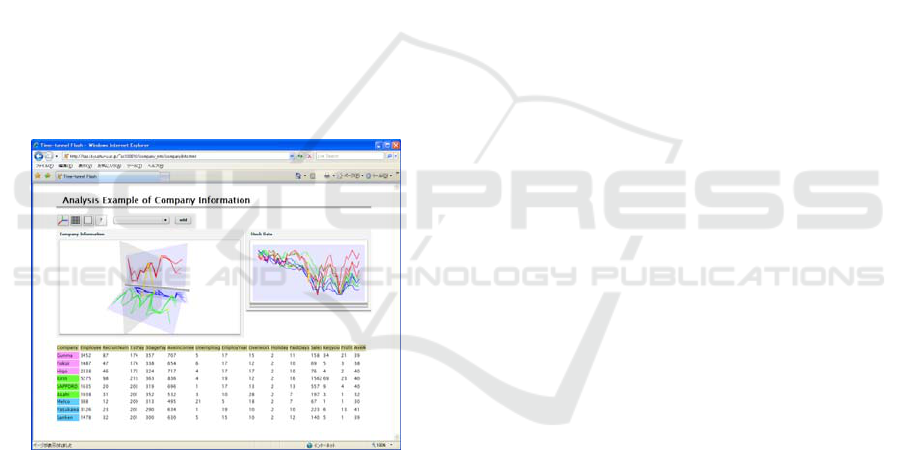
5 DATA ANALYSIS EXAMPLE
This section introduces data analysis example.
Figure 4 shows a web service example consisting of
two Time-tunnels. This web service analyzes
company information. One of the Time-tunnels
shown in the left part of Figure 4 has multiple data-
wings each of which displays multiple Parallel
Coordinates. Each data-wing of the Time-tunnel
displays database records of each of the three kinds
of Japanese companies, i.e., finance companies,
industry companies, and food stuff companies.
These database records have fourteen types of
attributes, e.g., head-count, number of recruitment,
beginning salary, and so on.
Another Time-tunnel shown in the right part of
the figures displays time-series stock data
categorized into three on three data-wings put
overlapped together. In this way, the user can
analyzes database records interactively on the web.
Figure 4: Web service example to analyze company
information by using two Time-tunnels together.
6 CONCLUSIONS
In this paper, we introduced interactive visualization
tool called Time-tunnel and proposed web version of
Time-tunnel to analyze multidimensional data on the
web. Then, we described its usefulness by showing a
practical data analysis example using real database
records.
As future works, we will propose a new analysis
tool that is realized as a combination of Time-tunnel
and another web API. We also have to evaluate the
usefulness of Time-tunnel by consulting actual users
who use it.
REFERENCES
Akaishi, M., Okada, Y., 2004. Time-tunnel: Visual
Analysis Tool for Time-series Numerical Data and Its
Aspects as Multimedia Presentation Tool. Proc. 8th
International Conference on Information Visualization
(IV04). IEEE CS Press, pp.456-461, 2004.
Akaishi, M., Okada, Y., 2005. Time-tunnel: Visual Analysis
Tool for Time-series Numerical Data and Its
Combinational Variation. Proc. 1st International
Conference on Geometric Modeling, Visualization &
Graphics (GMVAG 2005), Salt Lake, USA, July 21- 26,
2005.
Notsu, H., Okada, Y., Akaishi, M., Niijima, K., 2005.
Time-tunnel: Visual Analysis Tool for Time-series
Numerical Data and Its Extension toward Parallel
Coordinates. International Conference on Computer
Graphics, Imaging and Vision (CGIV05), July 2005.
Okada, Y., Tanaka, Y., 1995. IntelligentBox: A Constructive
Visual Software Development System for Interactive
3D Graphic Applications. Proc. of Computer
Animation '95, IEEE CS Press, pp.114-125, 1995.
Inselberg, A., Dimsdale, D., 1990. Parallel Coordinates: A
Tool for Visualizing Multidimensional Geometry. Proc.
IEEE Visualization 1990, IEEE CS Press, pp. 361-
378,1990.
Ward, M. O., 1994. XmdvTool: Integrating Multiple
Methods for Visualizing Multivariate Data. IEEE Conf.
on Visualization '94, pp 326-333, 1994.
Artero, A O., Ferreira de Oliveira, M C., and Levkowitz,
H., 2004. Uncovering Clusters in Crowded Parallel
Coordinates Visualizations. Proc. IEEE Information
Visualization 2004 (InfoVis 2004), pp.131-136, 2004.
Graham, M., Kennedy, J., 2003. Using Curves to Enhance
Parallel Coordinate Visualizations. Proc. Information
Visualization IV’03, IEEE CS Press, pp.10-16,2003.
Fua, Y. –H., Ward, M. O., Rundensteiner, E. A., 1999.
Hierarchical Parallel Coordinates for Exploration of
Large Datasets. Proc. IEEE Visualization ’99, IEEE CS
Press,pp.43-50,1999.
Johansson, J., Cooper, M., Jern, M., 2005. 3-Dimensional
Display for Clustered Multi-Relational Parallel Coordinates.
Proc. IEEE Information Visualization 2005 (InfoVis 2005),
pp.188-193,2005.
Siirtola, H., 2000. Direct Manipulation of Parallel
Coordinates. Proc. Information Visualization IV’00,
IEEE CS Press,pp.373-378,2000.
Hauser, H., Ledermann, F., Doleisch, H., 2002. Angular
Brushing of Extended Parallel Coordinates. Proc.
IEEE Information Visualization (InfoVis 2002),
pp.127-130, 2002.
Lanzenberger, M., Miksch, S., 2003. The Stardinates –
Visualizing Highly Structured Data. Proc. of Information
Visualization IV’03, IEEE CS Press, pp. 47-52, 2003.
WEBIST 2009 - 5th International Conference on Web Information Systems and Technologies
418
