
HOW DOES ALGORITHM VISUALIZATION AFFECT
COLLABORATION?
Video Analysis of Engagement and Discussions
Ari Korhonen
Department of Computer Science and Engineering, Helsinki University of Technology
P.O. Box 5400, FI-02015 TKK, Finland
Mikko-Jussi Laakso
Department of Information Technology, University of Turku, FI-22014 Turun Yliopisto, Finland
Niko Myller
Department of Computer Science and Statistics, University of Joensuu, P.O. Box 111, FI-80101 Joensuu, Finland
Keywords:
Extended engagement taxonomy, Collaborative learning, Algorithm animation, Visual algorithm simulation.
Abstract:
In this paper, we report a study on the use of Algorithm Visualizations (AV) in collaborative learning. Our pre-
vious results have confirmed the hypothesis that students’ higher engagement has a positive effect on learning
outcomes. Thus, we now analyze the students’ collaborative learning process in order to find phenomena that
explain the learning improvements. Based on the study of the recorded screens and audio during the learning,
we show that the amount of collaboration and discussion increases during the learning sessions when the level
of engagement increases. Furthermore, the groups that used visualizations on higher level of engagement,
discussed the learned topic on different levels of abstraction whereas groups that used visualizations on lower
levels of engagement tended to concentrate more on only one aspect of the topic. Therefore, we conclude that
the level of engagement predicts, not only the learning performance, but also the amount of on-topic discus-
sion in collaboration. Furthermore, we claim that the amount and quality of discussions explain the learning
performance differences when students use visualizations in collaboration on different levels of engagement.
1 INTRODUCTION
Empirical evaluations have yielded mixed results
when determining the usefulness of Algorithm Vi-
sualizations (AV) with empirical experiments. The
meta-analysis by (Hundhausen et al., 2002) con-
cluded that the activities performed by the students
are more important than the content of the visual-
ization. This has led to the proposition of Engage-
ment Taxonomy by (Naps et al., 2002) to characterize
the different levels of activities the students can per-
form with AV. The taxonomy is based on the Cogni-
tive Constructivistlearning theory (Hundhausenet al.,
2002; Garrison, 1993; Piaget, 1977) and a student is
supposed to achieve better learning results on higher
engagement levels. Moreover, (Myller et al., 2008)
have developed the taxonomy further by introducing
Extended Engagement Taxonomy (EET), which de-
scribes the levels of engagement in finer level of de-
tail. Furthermore, they have correlated the qualities
of students’ collaboration processes to different EET-
levels, and therefore, extended the taxonomy into the
direction of Social Constructivism (Palincsar, 1998;
McMahon, 1997; Vygotsky, 1978).
Collaborative learning has become popular in
Computer Science education (Beck and Chizhik,
2008; Teague and Roe, 2008; Valdivia and Nuss-
baum, 2007). Although visualizations have been em-
ployed in collaborative learning, collaboration intro-
duces new challenges for the visualization tools. For
example, the exchange of experiences and ideas, and
coordination of the joint work are needed when stu-
dents are no longer working individually (Suthers and
Hundhausen, 2003). Furthermore, visualizations can
479
Korhonen A., Laakso M. and Myller N.
HOW DOES ALGORITHM VISUALIZATION AFFECT COLLABORATION? - Video Analysis of Engagement and Discussions.
DOI: 10.5220/0001825104790488
In Proceedings of the Fifth International Conference on Web Information Systems and Technologies (WEBIST 2009), page
ISBN: 978-989-8111-81-4
Copyright
c
2009 by SCITEPRESS – Science and Technology Publications, Lda. All rights reserved

provide a shared external memory that can initiate ne-
gotiations of meanings and act as a reference point
when ideas are explained or misunderstandings are
resolved (Suthers and Hundhausen, 2003). This im-
plies that also new theories or extension of the pre-
vious ones are needed to guide the development and
research of the visualization tools for collaborative
learning.
In this paper, we study the use of AV in collabora-
tive learning. We have utilized EET as a framework
to test the impact of engagement levels on the learning
process when the students work in pairs. In this exper-
imental study, students collaborating on different en-
gagement levels were compared with each other while
they were learning concepts related to binary heaps.
This is a follow-up study in a series of studies. The
previous studies have shown that the engagement lev-
els have a role to play in learning and showed that the
use of visualizations on higher levels of engagement
improves learning results (Laakso et al., 2009; Myller
et al., 2007). However, this further investigation re-
vealed new results that support the view that higher
engagement levels have an effect not only on learning
outcomes, but also on the amount of collaboration or
discussion students have during the learning sessions.
In other words, the engagement seems to have an ef-
fect not only on the student-content interaction, but
also on the student-student interaction (see (Moore,
1989)). We hypothesize that these two together have
influenced the students learning results.
Although a plethora of studies that concentrate on
students’ performance (Grissom et al., 2003; Naps
and Grissom, 2002; Naps et al., 2002; Hundhausen
et al., 2002) exist, we also need to understand the
learning process and how the visualizations affect it
(Hundhausen, 2002; Hundhausen and Brown, 2008).
This information is essential when developing new
systems in order to enhance students’ learning with
algorithm visualizations.
The structure of this paper is as follows: section 2
presents previous work on visualizations, engagement
and interaction. The setup and design of the study are
described in section 3. In section 4, the results are
presented and they are further discussed in section 5.
Finally, conclusions and future directions are given in
section 6.
2 PREVIOUS WORK
2.1 Engagement
As an attempt to describe the mixed results of previ-
ous research in AV usage (Hundhausen et al., 2002)
in learning and teaching of algorithms and data struc-
tures, Engagement Taxonomy (ET) was introduced by
(Naps et al., 2002). The central idea of the taxonomy
is that the higher the engagement between the learner
and the visualization, the higher the positive effects
on learning outcomes. ET consists of six levels of en-
gagement between the user and the visualization:
No viewing – There is no visualization to be viewed.
Viewing – The visualization is only looked at with-
out any interaction.
Responding – Visualization is accompanied with
questions, which are related to the content of the
visualization.
Changing – Modification of the visualization is al-
lowed, for example, by varying the input data set
or algorithm simulation.
Constructing – Visualization of program or algo-
rithm is created.
Presenting – Visualizations are presented to others
for feedback and discussion.
ET has been used in the development of AV
tools and several studies have utilized the frame-
work and provided further support for it (?, see,
e.g.,)]Grissom2003, Grissom2002. There are also
other studies which have shown that visualizations
improve learning results, without actually utilizing
the ET framework in the design of the study (Ben-
Bassat Levy et al., 2003). In addition to this, research
in educational psychology and multimedia learning
have received similar results (Evans and Gibbons,
2007).
Although there is some anecdotal evidence on
how the visualizations could affect collaborative
learning process (Hundhausen, 2002; Hundhausen,
2005), there have been very few formal studies in-
vestigating it, especially from the point of view of
engagement (Hundhausen and Brown, 2008). In this
paper, we aim to research how the engagement be-
tween the learners and the visualization affects the in-
teractions (i.e. collaboration and discussion) between
learners.
(Myller et al., 2008) have proposed an extension
to the ET called Extended Engagement Taxonomy
(EET). The idea of this extension is to let the design-
ers and researchers of visualizations to use finer gran-
ularity of engagement levels in their tools and exper-
imental designs. They provide the following engage-
ment levels to be used together with the original ones:
controlled viewing, providing input, modification, and
reviewing. In this study, we will utilize the controlled
viewing level in order to make a difference between
WEBIST 2009 - 5th International Conference on Web Information Systems and Technologies
480

the visualizations that can only be viewed by the stu-
dent (EET level: viewing, e.g. static visualizations or
animations with only a playing option) compared to
those which can be controlled (EET level: controlled
viewing, e.g., animations with VCR-like controls in
order to step and play the animation both forwards
and backwards).
2.2 TRAKLA2
TRAKLA2 is a practicing environment for visual al-
gorithm simulation exercises (Korhonen et al., 2003;
Malmi et al., 2004) that are automatically assessed
tracing exercises solved by a student in a web-based
learning environment. The system distributes individ-
ually tailored exercises to students and provides in-
stant feedback on students’ solutions. In visual algo-
rithm simulation exercises, a student directly manipu-
lates the visual representations of the underlying data
structures. Thus, the student actually manipulates real
data structures through operations of the graphical
user interface (GUI) with the purpose of performing
the same changes on the data structures as the actual
algorithm would perform. Each change leads the data
structure to a new state. An answer to an exercise is
a sequence of these states, and the task is to perform
the correct operations that will simulate the running
of the algorithm.
Each TRAKLA2 exercise consists of a description
of the exercise accompanied with pseudo-code repre-
sentation of the algorithm, and possibly support ma-
terial that introduces the theory and examples of the
algorithm in question, instructions on how to interact
with the GUI, and an interactive Java applet that is
utilized to enter the answer. The current exercise set
consists of over 50 assignments on basic data struc-
tures, search structures, hashing methods as well as
sorting and graph algorithms.
Example: Let us consider the exercise in Fig-
ure 1. The student is supposed to manipulate the vi-
sual representation(s) of the Binary Heap data struc-
ture by invoking context-sensitive drag-and-drop op-
erations. The idea is to simulate the linear time Build-
Heap algorithm. The manipulation can be done in ei-
ther of the representations shown in the figure (i.e. the
array or the binary tree representation). A key can be
shifted up in terms of swap operations with its par-
ent until the heap property is satisfied (the key at each
node is smaller than or equal to the keys of its chil-
dren). A single swap operation is performed by drag-
ging and dropping a key in the heap on top of another
key
An exercise applet is initialized with randomized
input data. The BuildHeap exercise, for example, is
initialized with 15 numeric keys that correspond to
the priority values. The student can reset the exer-
cise by pressing the Reset button at any time. As a
result, the exercise is reinitialized with new random
keys. When attempting to solve the exercise, the stu-
dent can review the answer step by step using the An-
imator panel. Moreover, the student can Submit the
answer for immediate assessment and feedback. The
feedback reports the number of correct steps out of
the total number of steps in the exercise. This kind
of automatic assessment is possible due to the fact
that the student is manipulating real data structures
through the GUI. Thus, it is possible to implement
the same algorithm the student is simulating, and exe-
cute it so that the algorithm manipulates the same data
structures with same data, but different instances, as
the student. Therefore, the assessment is based on
the comparison of the two instances of the same data
structures with each other.
An exercisecan be submitted an unlimited number
of times. However, a solution for a single instance of
an exercise with certain input data can be submitted
only once. In order to resubmit a solution to the ex-
ercise, the student has to reset the exercise and start
over with new randomized input data. A student can
also review a Model answer for each attempt. It is
represented in a separate window as an algorithm an-
imation accompanied with a pseudo code animation
so that the execution of the algorithm is visualized
step by step. The states of the model solution can
be browsed back and forth using a similar animator
panel as in the exercise. For obvious reasons — af-
ter opening the model solution — the student cannot
submit a solution until the exercise has been reset and
resolved with new random data.
2.3 Our Previous Studies on the Same
Topic
The study reported in this paper belongs to a series of
studies that have been run since autumn 2006 (Laakso
et al., 2009; Myller et al., 2007). This is actually
a follow-up video analysis of an experiment that we
carried out in spring 2007 (Laakso et al., 2009). The
objective of the experiment was to compare the learn-
ing outcomes of students who collaboratively used al-
gorithm visualizations on two different EET levels,
namely controlled viewing and changing. The results
in sections 2.3.1 and 2.3.2 have already been reported
and explained in more detail elsewhere (Laakso et al.,
2009) but are given here in order to allow the discus-
sion of them in relation to the findings that are re-
ported in this paper in section 4. In the sections 2.3.1
and 2.3.2, the analysis was done for all the partic-
HOW DOES ALGORITHM VISUALIZATION AFFECT COLLABORATION? - Video Analysis of Engagement and
Discussions
481
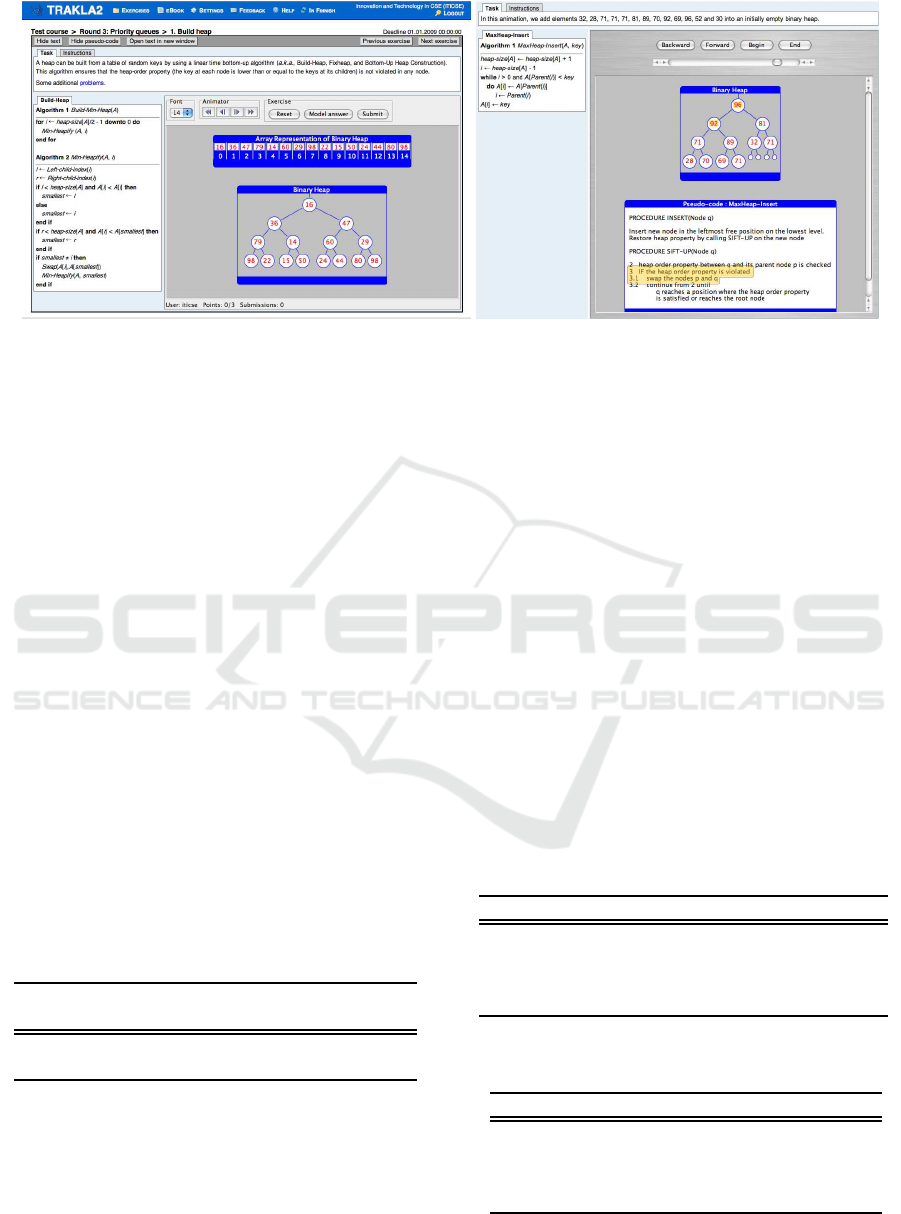
Figure 1: TRAKLA2 algoritm simulation exercise is on the left and corresponding model answer animation on the right.
ipants or groups of the same experiment that is re-
ported in this paper. See section 3 for further descrip-
tion of the study design.
2.3.1 Learning Results
The pre- and post-test results for both conditions are
given in Table 1. Based on the two-tailed t-test, the
differences in the pre-test scores between conditions
were not statistically significant meaning that the stu-
dents’ preliminary knowledge on the topic was sim-
ilar. The differences in the post-test scores between
conditions, both individual and group averages, were
statistically significant based on the one-tailed t-test
(t(69) = −1.73, p < 0.05 and t(31) = −1.97, p <
0.05, respectively). We used the one-tailed t-test to
analyze the post-test scores because of our hypothe-
sis that the treatment group was expected to perform
better. This hypothesis was formed based on the En-
gagement Taxonomy (Naps et al., 2002) and the pre-
vious results in similar studies performed by others
(Grissom et al., 2003; Hundhausen and Brown, 2008;
Naps and Grissom, 2002) and us (Myller et al., 2007).
Table 1: The pre- and post-test results between conditions
(standard deviations are given in parentheses) (n = 71).
Pre-test Post-test Post-test
individual avg group avg
Control 8.9 (6.1) 30.5 (6.5) 30.4 (4.6)
Treatment 9.3 (5.7) 33.3 (6.7) 33.5 (4.3)
2.3.2 Time Allocation between Engagement
Levels
Table 2 presents the distribution of the average times
spent on each EET level. This was measured by
watching the videos and marking times when the EET
level changed from one to another, and then summing
up the times on each EET level. Based on this anal-
ysis, we made the final classification of groups into
different conditions, because although some students
were originally assigned to treatment condition, in
which they were supposed to work on changing level,
they never did, and therefore belonged to the control
condition. This also shows that the amount of time
that students spent on reading or looking at static im-
ages is almost the same in both groups and only the
looking at the animations, which they could control,
and the algorithm simulation exercises were used dif-
ferently. In the control condition, the animations were
the only active form of engagement whereas in treat-
ment condition they also had the option of solving al-
gorithm simulation exercises. The latter was more im-
portant due to the fact that this group used animations
almost only for figuring out how they should simulate
the algorithm.
Table 2: The distribution of time between EET levels (stan-
dard deviations are given in parentheses) (n = 35).
Control Treatment
No viewing 48.1% (15.8) 43.2% (19.2)
Viewing 38.3% (15.8) 38.1% (13.1)
Controlled viewing 13.8% (6.0) 5.1% (6.0)
Changing 0.0% (0.0) 12.6% (2.0)
Table 3: The number of times each EET level is entered
(standard deviations are given in parentheses) (n = 35).
Control Treatment
No viewing 6.9 (2.1) 6.2 (1.7)
Viewing 7.7 (3.4) 6.7 (3.2)
Controlled viewing 5.2 (2.8) 2.4 (2.6)
Changing 0.0 (0.0) 4.1 (1.6)
Table 3 shows how many times students used ma-
WEBIST 2009 - 5th International Conference on Web Information Systems and Technologies
482

terials on each EET level. For example, students
in the control group used user-controlled animations
(controlled viewing) 5 times on average, whereas stu-
dents in the treatment group used them 2 or 3 times on
average. This also shows the shift from the use of an-
imations to the algorithm simulations in the treatment
condition.
3 METHODOLOGY
This is a follow-up analysis for the quantitative study
(Laakso et al., 2009), in which we showed that the use
of higher engagement levels has an positive effect on
the students’ learning outcomes. Thus, the descrip-
tion of the experiment in this section is in many ways
similar to the previous report. However, as we ana-
lyze the learning process — not its outcomes — the
methodology is naturally different.
The objective in this study is to compare the learn-
ing processes of students who collaboratively used al-
gorithm visualizations on two different EET levels,
namely controlled viewing and changing. This is an
observational study based on screen capture and audio
recording analysis of students’ interactions during the
experiment. Students’ activities were recorded utiliz-
ing a screen capturing software. The recordings were
accompanied by an audio track and thus, contained
on-screen activities, i.e., mouse movements, keyboard
typings, scrolling of the tutorial page back and forth
in the browser window, as well as the conversation
between the pair members.
3.1 Participants
Students were mainly first year students, however,
some students from other years were also on the
course. All students had previously been using
TRAKLA2 during the course to complete three as-
signment rounds related to basic data structures (e.g.
lists, stacks and queues) and algorithm analysis, sort-
ing and binary tree traversing. Thus, all students
should have known how to use TRAKLA2, been fa-
miliar with its visualizations and all its features that
were needed to complete the assignments.
Students were randomized to the computer lab
sessions and sessions were randomly assigned to each
condition with the limitation that parallel sessions be-
longed to different EET levels. The total number of
participating students was 92. However, not all of
them allowed to monitor their performance, nor were
they willing to do group work. In addition, in some
of the workstations, the Java applet was not work-
ing properly and there were problems in data cap-
ture. Thus, the total number of participants (students)
was 71, divided into 7 groups (sessions). The original
number of lab sessions was 8, but the last one (that
would have been a control group) was excluded be-
cause it was an English speaking group, and the ma-
terials were mostly in Finnish.
The study was performed at the computer lab ses-
sions that lasted for 2 hours, and they were run on two
days in two consecutive weeks. Each day, there were
two times two sessions with different conditions (con-
trol and treatment) running simultaneously. There
were 10 to 15 participants in each session in both con-
ditions. The external conditions, such as noise level,
were similar in all sessions and based on the video and
audio analysis it did not affect the learning process.
3.2 Procedure
In the beginning of the session, students took the in-
dividual pre-test, in which they answered questions
related to binary heaps in 15 minutes. There were 9
simple questions about binary heaps, which could be
answered with a few words, and one question asked
students to draw a binary heap’s tree representation.
After this, they freely formed pairs with their peers
and gave their consent to participate in the experiment
and to be monitored during the experiment. If there
was an odd number of students, one group consisted
of 3 students. Each pair was allocated to a single com-
puter.
After the pre-test, students had 45 minutes to go
through the learning materials of their condition. The
collaboration was monitored by recording their talk-
ing and capturing their activities on the computer
screens. In addition, in this learning phase student
were given three paper-and-pencil assignments. The
session ended with an individual post-test. The stu-
dents were given 30 minutes to answer the questions
in the post-test. The post-test contained six questions
which were the same as in the pre-test, and in ad-
dition to that, there were seven questions that were
more difficult and comparable to the questions stu-
dents needed to answer during the learning session.
Each question in the pre- and post-tests was ana-
lyzed on a scale from 0 and 4. Zero points meant less
than 25 percent of the answer was correct in the an-
swer, and each point meant a 25 percent increase in
the correctness of the answer.
3.3 Method
In this overt research method, we observed the stu-
dents in their activities, i.e., by watching the record-
ings afterwards (Gall et al., 2006). Participants were
HOW DOES ALGORITHM VISUALIZATION AFFECT COLLABORATION? - Video Analysis of Engagement and
Discussions
483
Computer Science major students on a data structures
and algorithms course at Helsinki University of Tech-
nology. The students worked in pairs, and they were
aware of being observed. We asked a permission to
monitor them in advance.
We utilized TRAKLA2 in order to provide the stu-
dents with algorithm simulation exercises that act on
the EET level changing (i.e, treatment group). How-
ever, the students did not have the option to reset the
exercise in order to obtain a new similar exercise with
new input data, but they had to work with a fixed input
data for each exercise for the whole session. The an-
imations that the students used on controlled viewing
level (i.e., control group) were similar to the model
answers provided by the TRAKLA2 system.
There was a total of 35 videos (about 45 minutes
each), and we included three videos from both con-
ditions into this analysis, in total six videos. From
each video, we randomly selected a clip about 20 min-
utes long that contained activities on all applicable en-
gagement levels. The videos were analyzed in five
second time slots that were classified according to the
following four factors.
The first factor classified the engagement level ac-
cording to the extended engagement taxonomy: no
viewing (e.g., reading phase), viewing (e.g., watching
figures), controlled viewing (e.g., watching anima-
tions or model solutions step-by-step with user in con-
trol), and changing (i.e., solving an algorithm simula-
tion exercise). However, if the students were solving
the paper-and-pencil exercises, these episodes were
classified into a separate class that was not used in the
analysis. The second factor categorized each time slot
based on audio analysis and determined whether the
pair was having a conversation (or if they were silent).
The third aspect specified the content of the conversa-
tion according to the following six categories: algo-
rithm and data structure (DS) behavior (e.g., students
discuss the features of binary heap), the tool and its
features (e.g., students discuss how to use the tool),
exercise (e.g., students discuss how to solve the ex-
ercise), referring to the learning materials (e.g., stu-
dents are reading parts of the learning material out
loud and then discussing that part of the materials),
on-topic (i.e., students are discussing something that
is related to the learning but does not belong to any
other category) and off-topic (i.e., student are dis-
cussing something that does not relate to the learning
process in any way).
Three different persons classified randomly se-
lected videos with the restriction that each person an-
alyzed at least one video from the control group and
one from the treatment group.
4 RESULTS
In this section, we present the results of our study in
which we analyzed the students’ behavior during their
learning process. Six groups were randomly selected
(three groups from both conditions) from a total of 35
groups. We analyzed a 20-minute-long clip of screen
capturing video and audio for each group in order to
collect the amount of discussions, their contents, and
the EET-level at each moment in order to understand
the differences in the amount of discussions and their
contents between the engagement levels.
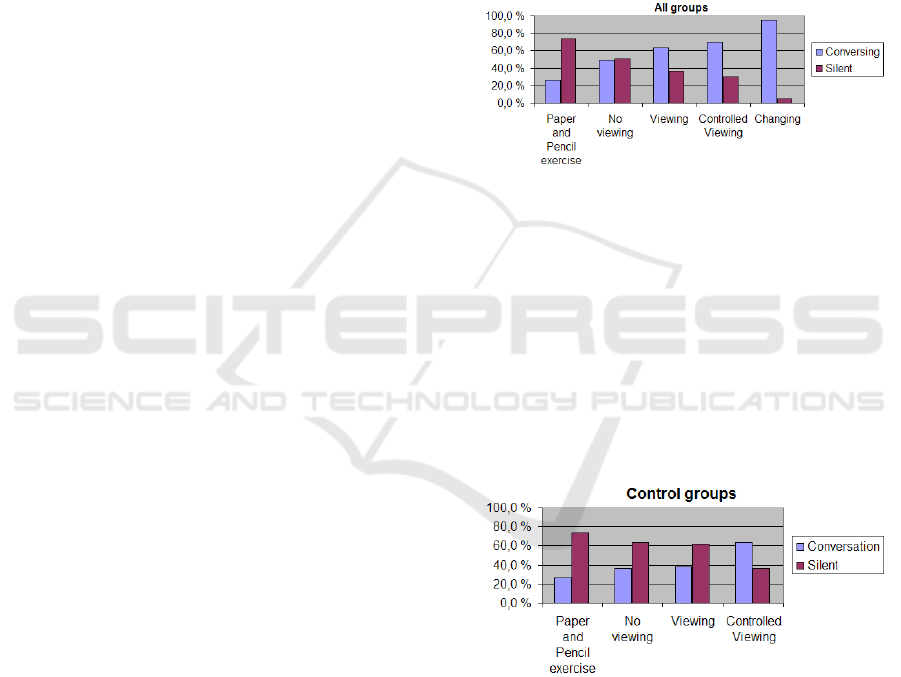
Figure 2: Distribution of activities in all groups on all EET-
levels.
Figures 2, 3 and 4 show the distributions between
the percentages of time that the students were con-
versing and silent. Based on the figures, one can
see that the amount of conversation increases when
the engagement level increases. This was also con-
firmed by using the χ
2
-test on counts (all: χ
2
(4) =
330.5, p < .001, control: χ
2
(4) = 84.1, p < .001,
treatment: χ
2
(4) = 134.4, p < .001), which showed
that the engagement level has an effect on the amount
of discussion, overall and in each condition.
Figure 3: Distribution of activities for control groups on all
EET-levels.
Pairwise comparison of the distributions on each
EET level between conditions (see Figure 5) with the
χ
2
-test on counts showed that the distributions were
different on levels no viewing (χ
2
(1) = 9.2, p < .001),
viewing (χ
2
(1) = 24.4, p < .001) and controlled view-
ing (χ
2
(1) = 21.4, p < .001), but not when students
were doing a paper and pencil exercise. The test could
not be performed on the changing level as it was only
available to treatment condition.
WEBIST 2009 - 5th International Conference on Web Information Systems and Technologies
484
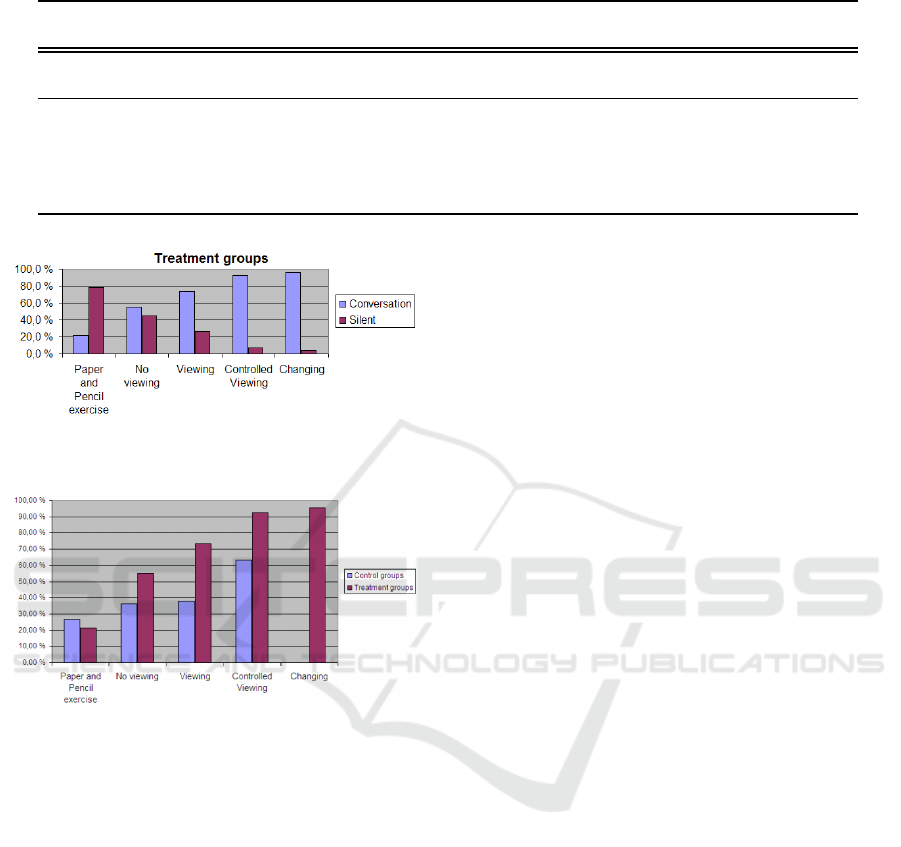
Table 4: Discussion content for all groups on all EET-levels.
Alg. & DS Code Exercise Referring to Tool Coordination On Off
behavior reading learning mat. topic topic
Paper and pencil 65.2% 0.9% 11.3% 0.0% 0.0% 15.7% 1.7% 5.2%
exercise
No viewing 39.2% 14.9% 5.4% 14.2% 4.1% 6.8% 10.1% 5.4%
Viewing 32.8% 24.8% 5.1% 4.4% 2.2% 7.3% 16.8% 6.6%
Controlled 68.7% 19.4% 0.9% 3.3% 1.9% 3.8% 0.0% 1.9%
viewing
Changing 65.0% 0.0% 7.8% 0.0% 13.8% 1.8% 9.7% 1.8%
Figure 4: Distribution of activities for treatment groups on
all EET-levels.
Figure 5: The percentages of time that students were dis-
cussing on each EET-level. The rest of the time students
were silent. The control group does not have a value for the
changing level, because it was unavailable for them.
Tables 4 and 5 showthe distributions of the discus-
sion contents on each engagement level and in each
condition. When looking at the overall distribution,
one can observe that the distributions of the discus-
sion contents are similar on the controlled viewing
and changing levels and when students are doing the
paper and pencil exercises. Similarly, the distribu-
tions of no viewing and viewing seem more alike.
However, when the distributions between the con-
ditions are compared, it can be seen that the no view-
ing, viewing and controlled viewing levels induce dif-
ferent kinds of discussions between the conditions.
In control condition, the discussions are more re-
lated to the algorithm and data structure (DS) be-
havior, whereas in treatment condition larger propor-
tions of the discussions on these levels are related to
the pseudo code reading. In treatment condition, the
changing level seems to be similar to the controlled
viewing level and the paper and pencil exercise doing.
5 DISCUSSION
In this study, we have investigated the collaboration
process when students were learning with visualiza-
tion on different engagement levels. We can con-
clude that higher engagement with the visualization
has a positive effect on students interaction with each
other. Moreover, it seems that when students work on
a larger number of engagement levels, their collabo-
ration and communication is further improved.
Our results support the findings of (Hundhausen
and Brown, 2008; Hundhausen, 2002), i.e., the higher
engagementlevel between the visualization and learn-
ers increases the peer-to-peer (or student-student by
(Moore, 1989)) communication. Students are more
actively involved as the engagement level increases.
Based on the results, we can say that if students work
on higher engagement levels, their activities also pos-
itively change on lower levels. This phenomenon can
be easily observed when we investigate the changes
in the amount of discussion in the Figures 3 and 4
on controlled viewing and viewing between control
and treatment groups. When students were working
on changing level in the treatment group, the amount
of silence dramatically decreased as the engagement
level increased. At the two highest levels, the silence
is practically absent. In control condition, the amount
of silence decreases, but the change is smaller. For
example, there is over 30% of the time when stu-
dents are silent on controlled viewing level in con-
trol group while the time of being silent is well below
10% for the treatment group. The same difference is
much more drastic in the viewing-level between the
groups. Our understanding is that this is due to the
fact that while students are solving a paper-and-pencil
or TRAKLA2 algorithm simulation exercise, they re-
alize that they cannot solve it. Therefore, they need to
go back to the learning materials or the correspond-
HOW DOES ALGORITHM VISUALIZATION AFFECT COLLABORATION? - Video Analysis of Engagement and
Discussions
485

Table 5: Discussion content for control and treatment groups on all EET-levels.
Alg. & DS Code Exercise Referring to Tool Coordination On Off
behavior reading learning mat. topic topic
CONTROL
Paper and pencil 67.0% 0.9% 11.6% 0.0% 0.0% 13.4% 1.8% 5.4%
exercise
No viewing 25.7% 0.0% 11.4% 25.7% 14.3% 14.3% 2.9% 5.7%
Viewing 54.2% 0.0% 12.5% 4.2% 0.0% 8.3% 8.3% 12.5%
Controlled 79.7% 7.4% 0.7% 4.7% 0.7% 4.1% 0.0% 2.7%
viewing
TREATMENT
Paper and pencil 0.0% 0.0% 0.0% 0.0% 0.0% 100.0% 0.0% 0.0%
exercise
No viewing 43.4% 19.5% 3.5% 5.3% 0.9% 4.4% 12.4% 5.3%
Viewing 28.3% 30.1% 3.5% 5.3% 2.7% 7.1% 18.6% 5.3%
Controlled 42.9% 47.6% 1.6% 0.0% 4.8% 3.2% 0.0% 0.0%
viewing
Changing 65.0% 0.0% 7.8% 1.8% 13.8% 1.8% 9.7% 1.8%
ing animation in order to understand, how to solve
the exercise. The reason that this is happening more
in the treatment condition is the instant feedback that
TRAKLA2 provides on each simulation, which helps
students to understand when their mental models of
the algorithms and data structures are not viable and
they need to revise them. This example also indicates
that the visiting of the engagement levels does not
happen in any particular order, but can happen ran-
domly.
(Teasley, 1997) has found that talking is correlated
with better learning results. This, at least partially,
explains why students learned better in the treatment
condition compared to the control condition. The
visualization helped them to discuss relevant topics
in order to learn them. Because the topic that the
participants were studying was unfamiliar to most of
the participants, the conversations in the group aided
students to better cope with the questions and prob-
lems that arose during the learning process. There-
fore, we believe that pair-support is one of the key
factors in enhancing students’ learning, and it should
be taken into account when designing and developing
next generation learning tools and methods. Teasley
has also found that transactive reasoning (Berkowitz
and Gibbs, 1983) is strongly correlated with learning
results, and in the future studies, we will also ana-
lyze the amount of transactive reasoning in the dis-
cussions.
In addition to the amount of discussion, we an-
alyzed the discussion contents. Based on the analy-
sis, we found that the students’ discussions were re-
lated to the learned topic, otherwise there were no
large differences. The only noticeable difference was
the absence of code reading on the changing level.
When we compared the distributions between condi-
tions, there were more noticeable difference. In the
treatment condition, the discussions related to the al-
gorithm and data structure behavior and code read-
ing were more balanced on levels no viewing, viewing
and controlled viewing compared to the control con-
dition, where students concentrated on the algorithm
and data structure behavior and had very little discus-
sion on the code. One could argue that the discus-
sions on various levels of abstraction increased the
students’ understanding of the topic, and therefore,
this could also be an explanation why students per-
formed better in the post-test in the treatment condi-
tion.
6 CONCLUSIONS
Many studies related to the use of algorithm visualiza-
tions (AV) in teaching and learning have focused on
the learning outcomes. On the one hand, (Extended)
Engagement Taxonomy (EET) has been suggested to
answer the question, if an AV system is effective in
this respect or not. On the other hand, collaborative
learning (CL) has proven to be an efficient teaching
and learning method. However, very little is known
about the interconnection between EET and CL.
We have investigated the use of AV in CL in many
repeated studies. Our previous studies have confirmed
that the engagementlevels havea role to play in learn-
ing outcomes. The pairs of students that used AV
WEBIST 2009 - 5th International Conference on Web Information Systems and Technologies
486

on higher engagement levels performed better in the
post-test than those pairs learning on lower engage-
ment levels. The research in this paper has revealed
that the amount of discussion in collaboration is also
different between engagement levels, and increases as
the engagement level increases.
Based on this study, EET not only predicts the in-
crease in learning performance when student groups
learn with visualization on higher engagement level,
but also explains it by enabling students to have more
discussions on topics that are relevant for learning.
Thus, engagement goes hand in hand with collabora-
tion so that the engagement taxonomy level has an in-
fluence over the collaborativelearning process as well
as the learning outcomes.
6.1 Future Directions
(Teasley, 1997) has found that transactive reasoning
(Berkowitz and Gibbs, 1983) (TR) is strongly corre-
lated with learning results. Transactive reasoning is
discussion about one’s own or collaboration partner’s
reasoning and logical thinking. TRAKLA2 exercises
have interesting interconnections with the character-
izations of TR categories. For example, Teasley de-
scribes prediction type TR as “explaining ..., stating
a hypothesis about causal effects ... .” Moreover, the
feedback request category can be characterized with a
question: “Do you understand or agree with my posi-
tion?”
Even though these do not correspond directly to
TRAKLA2 exercises, the same elements are present
in the exercise solving process. The student is sup-
posed to predict each step in the algorithm simulation;
and s/he receives instant feedback from the exercise.
Thus, this kind of framework could function as a fu-
ture testbed to explain good learning results that also
individual learners get in the TRAKLA2 environment
or in any other environment.
ACKNOWLEDGEMENTS
This work was supported by the Academy of Finland
under grant numbers 111396. Any opinions, find-
ings, and conclusions or recommendations expressed
in this material are those of the authors and do not
necessarily reflect the views of the Academy of Fin-
land.
REFERENCES
Beck, L. L. and Chizhik, A. W. (2008). An experimental
study of cooperative learning in CS1. In SIGCSE ’08:
Proceedings of the 39th SIGCSE technical symposium
on Computer science education, pages 205–209, New
York, NY, USA. ACM.
Ben-Bassat Levy, R., Ben-Ari, M., and Uronen, P. A.
(2003). The Jeliot 2000 program animation system.
Computers & Education, 40(1):15–21.
Berkowitz, M. W. and Gibbs, J. C. (1983). Measuring the
development of features in moral discussion. Merill-
Palmer Quarterly, 29:399–410.
Evans, C. and Gibbons, N. J. (2007). The interactivity ef-
fect in multimedia learning. Computers & Education,
49(4):1147–1160.
Gall, M. D., Gall, J. P., and Borg, W. R. (2006). Educa-
tional Research: An Introduction (8th Edition). Allyn
& Bacon.
Garrison, D. R. (1993). A cognitive constructivist view of
distance education: An analysis of teaching-learning
assumptions. Distance Education, 14:199–211.
Grissom, S., McNally, M., and Naps, T. L. (2003). Algo-
rithm visualization in CS education: Comparing levels
of student engagement. In Proceedings of the First
ACM Symposium on Software Visualization, pages
87–94. ACM Press.
Hundhausen, C. D. (2002). Integrating algorithm visual-
ization technology into an undergraduate algorithms
course: Ethnographic studies of a social constructivist
approach. Computers & Education, 39(3):237–260.
Hundhausen, C. D. (2005). Using end-user visualization
environments to mediate conversations: A ‘Commu-
nicative Dimensions’ framework. Journal of Visual
Languages and Computing, 16(3):153–185.
Hundhausen, C. D. and Brown, J. L. (2008). Designing,
visualizing, and discussing algorithms within a CS 1
studio experience: An empirical study. Computers &
Education, 50(1):301–326.
Hundhausen, C. D., Douglas, S. A., and Stasko, J. T.
(2002). A meta-study of algorithm visualization ef-
fectiveness. Journal of Visual Languages and Com-
puting, 13(3):259–290.
Korhonen, A., Malmi, L., and Silvasti, P. (2003).
TRAKLA2: a framework for automatically assessed
visual algorithm simulation exercises. In Proceedings
of KolinKolistelut / Koli Calling – Third Annual Baltic
Conference on Computer Science Education, pages
48–56, Joensuu, Finland.
Laakso, M.-J., Myller, N., and Korhonen, A. (2009). Com-
paring learning performance of students using algo-
rithm visualizations collaboratively on different en-
gagement levels. Accepted to the Journal of Educa-
tional Technology & Society.
Malmi, L., Karavirta, V., Korhonen, A., Nikander, J.,
Sepp¨al¨a, O., and Silvasti, P. (2004). Visual algo-
rithm simulation exercise system with automatic as-
sessment: TRAKLA2. Informatics in Education,
3(2):267 – 288.
HOW DOES ALGORITHM VISUALIZATION AFFECT COLLABORATION? - Video Analysis of Engagement and
Discussions
487

McMahon, M. (1997). Social constructivism and the world
wide web – a paradigm for learning. In Proceedings
of the ASCILITE conference, Perth, Australia.
Moore, M. G. (1989). Editorial: Three types of interac-
tion. The American Journal of Distance Education,
page 16.
Myller, N., Bednarik, R., Ben-Ari, M., and Sutinen, E.
(2008). Applying the Extended Engagement Taxon-
omy to Collaborative Software Visualization. Ac-
cepted to the ACM Transactions on Computing Ed-
ucation.
Myller, N., Laakso, M., and Korhonen, A. (2007). Analyz-
ing engagement taxonomy in collaborative algorithm
visualization. In Hughes, J., Peiris, D. R., and Ty-
mann, P. T., editors, ITiCSE ’07: Proceedings of the
12th Annual SIGCSE Conference on Innovation and
Technology in Computer Science Education, pages
251–255, New York, NY, USA. ACM Press.
Naps, T. L. and Grissom, S. (2002). The effective use of
quicksort visualizations in the classroom. Journal of
Computing Sciences in Colleges, 18(1):88–96.
Naps, T. L., R¨oßling, G., Almstrum, V., Dann, W., Fleis-
cher, R., Hundhausen, C., Korhonen, A., Malmi, L.,
McNally, M., Rodger, S., and Vel´azquez-Iturbide,
J.
´
A. (2002). Exploring the role of visualization and
engagement in computer science education. In Work-
ing Group Reports from ITiCSE on Innovation and
Technology in Computer Science Education, pages
131–152, New York, NY, USA. ACM Press.
Palincsar, A. S. (1998). Social constructivist perspectives on
teaching and learning. Annual Review of Psychology,
49:345–375.
Piaget, J. (1977). The Development of Thought: Equilibra-
tion of Cognitive Structures. Viking, New York.
Suthers, D. D. and Hundhausen, C. D. (2003). An exper-
imental study of the effects of representational guid-
ance on collaborative learning processes. Journal of
the Learning Sciences, 12(2):183–219.
Teague, D. and Roe, P. (2008). Collaborative learning: to-
wards a solution for novice programmers. In ACE
’08: Proceedings of the tenth conference on Aus-
tralasian computing education, pages 147–153, Dar-
linghurst, Australia, Australia. Australian Computer
Society, Inc.
Teasley, S. (1997). Talking about reasoning: How important
is the peer in peer collaboration. In Resnick, L., S¨alj¨o,
R., Pontecorvo, C., and Burge, B., editors, Discourse,
Tools and Reasoning: Essays on Situated Cognition,
pages 361–384. Springer, New York.
Valdivia, R. and Nussbaum, M. (2007). Face-to-face col-
laborative learning in computer science classes. Inter-
national Journal of Engineering Education, 23:434–
440(7).
Vygotsky, L. S. (1978). In Cole, M., John-Steiner, V., Scrib-
ner, S., and Souberman, E., editors, Mind in Society.
Harvard University Press, Cambridge, Mass.
WEBIST 2009 - 5th International Conference on Web Information Systems and Technologies
488
