
T-PROX
A User-tracking Proxy for Usability Testing
Sven Lilienthal
Chair of Computer Science 4, RWTH Aachen University, Ahornstrasse 55, 52074 Aachen, Germany
Keywords:
Usability, Web, Evaluation, Testing, Web based, Proxy, User interfaces, Tracking, Web interfaces, Web appli-
cations.
Abstract:
While usability analyses become more and more accepted for conventional software, there are many reasons
told to forgo usability analyses for web-based applications and websites. Most companies dread the high
monetary and personnel costs together with the unacquainted process. Nevertheless, this leads to a lowered
acceptance and thereby to lowered success (Tedeschi, 1999; Fogg et al., 2001). This motivates the development
and creation of an easy to use solution which enables companies and institutions to easily analyze their web
systems without having to rely on external usability experts and expensive labs and equipment.
1 INTRODUCTION
In this work, we present a solution to track users and
their interactions with web based systems. The main
purpose is to establish an easy to use solution, which
is both non-intrusive for the test participant and easy
to use for the experimenter.
In recent years, the numbers of web based applica-
tions and websites has increased. While some are de-
signed with regard to usability, most are designed by
amateurs who do not know about user interface design
at all. Most companies dread the high cost of a profes-
sional designer, as they are often more than hundred
times higher than that of a semi-professional. Other
sites are build by technicians, who do know how to
build websites conforming to technical standards, but
who lack the knowledge about usability and user in-
teractions.
This leads to lowered acceptance, one of the
main factors for the success of company websites
(Tedeschi, 1999). And as (Fogg et al., 2001) ex-
plains, hard to navigate website have a low credibil-
ity. Nevertheless, many companies oppose usability
tests, mainly because of their alleged high monetary
and personnel costs.
This motivates the development of an easy to use
and cost efficient tool, which is able to capture and
log the user interaction with a web based user inter-
face automatically and provide this data for further
analysis.
In section 2 we describe the requirements and the
basic principles of HTML (HyperText Markup Lan-
guage) used in our approach. Section 3 then presents
existing approaches and other related work. After-
wards we explain our own implementation in section
4 and finish with a conclusion in section 5.
2 PRELIMINARIES
When talking about usability, you first have to clarify
one thing:
What does usability really mean?
The International Organization for Standardization
(ISO) defines usability in their norm ISO 9241-11 as
following:
The extent to which a product can be used by
specified users to achieve specified goals with
effectiveness, efficiency and satisfaction in a
specified context of use (ISO, 1998).
That means that usability describes the amount to
which a typical users can use the product in an effi-
cient and effective way. It has to be pointed out, that
neither the programmer of a software nor the designer
of a web site corresponds to the typical user. The ef-
ficiency is the time needed to complete the goals, the
effectiveness is the accuracy and completeness. An-
other point which is often left out, is that usability is
always defined in a specified context.
225
Lilienthal S.
T-PROX - A User-tracking Proxy for Usability Testing.
DOI: 10.5220/0001818102250231
In Proceedings of the Fifth International Conference on Web Information Systems and Technologies (WEBIST 2009), page
ISBN: 978-989-8111-81-4
Copyright
c
2009 by SCITEPRESS – Science and Technology Publications, Lda. All rights reserved
2.1 How to Test?
From the above definition, we can deduce most re-
quirements of usability testing and, therefore, the
main requirements of our software. Most usability
testing is conducted in an usability lab, even though
usability always has to take the environment into ac-
count. Therefore, we will try to provide means for
testing usability in the user’s normal environment.
One often cited rule of thumb for usability testing
is: “Test early, test often”. Hence, recruiting of par-
ticipants has to be easy, otherwise it would be hard
to regular get enough people for the tests. To lower
the hurdle, we want the test to be taken part in from
anywhere, without the needs to travel to an usability
lab.
2.2 Why aren’t more Tests Conducted?
This leads to the question, why tests aren’t more com-
mon than they actually are. The one thing is, that us-
ability testing is still seen as to expensive, with low
return-on-investment and, on the other hand, that it
is to complicated. Nielsen introduced some ideas
to reduce cost in (Nielsen, 1994; Nielsen, 1997) but
for several reasons, these are not applicable for most
companies. These include the prerequisite to have a
video camera and the the office space to set up an us-
ability lab. Additionally, the analysis of the conducted
tests has normally to be done by an expensive expert.
2.3 Requirements
From the preceding section, we can deduce our re-
quirements as following:
• easy to use, for both the participant and the exper-
imenter, which means, that the client should not
need to install extra software, and has to make as
little changes as possible to his computer systems
and his environment,
• transparent to the participant, meaning that his
user experience is not changed,
• no need for access to the server, as we want to
have the possibility to test foreign servers,
• high grade of automation and
• platform independence.
If the tool is easy to use for the experimenter, it
will be used more often, if it is easy to user for the par-
ticipant, it will be easier to recruit them, which is cru-
cial to the success of the test, as even though Nielsen
says that 5 users are enough (Nielsen and Landauer,
1993; Nielsen, 2000), others disagree with that (Spool
and Schroeder, 2001). It has to be transparent to the
participant, as we don’t want to alter the test results
in any way. A higher grade of automation leads to
less work for the experimenter and therefore to lower
overall costs.
Moreover, the increased automation leads to an
easier analysis of the gathered data. The tool should
enable even non-experts to at least draw some con-
clusions from the tests. To achieve this, we have do
measure a range of metrics.
2.3.1 Metrics
The metrics which are essential for a sound usability
evaluation will be described in this section. We need a
means to identify sites which are difficult to navigate
or where ambiguous data is presented. For that, we
will measure and calculate the following values:
• the efficiency, as measured by the time needed to
navigate from the first to the last page,
• the average time spend on a page,
• the quantity and quality of the actions, taken by
the user,
• the average actions per time.
Additionally, we will point out the user’s returns
to the start page, as this often indicates that the user
got lost while surfing the web site.
2.4 Basic Principles
DOM is the acronym for Document Object Model and
is a way to access HTML-elements as objects defined
by the W3C (World Wide Web Consortium).
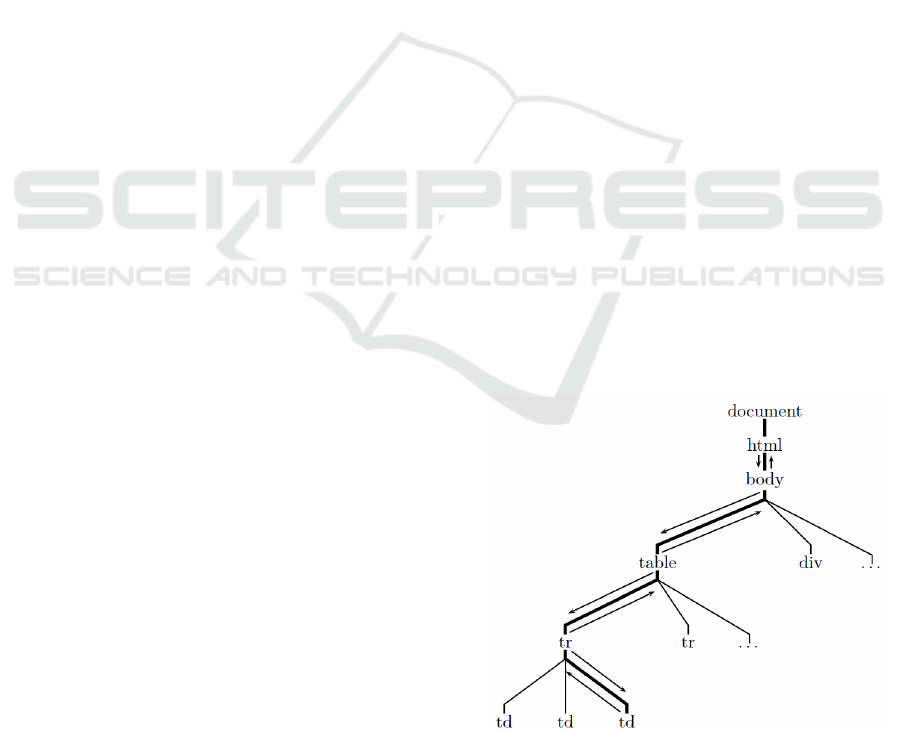
Figure 1: Event-bubbling/-capturing in the DOM-tree.
For all elements of the HTML-page a DOM-
object is created. These objects are then merged into a
WEBIST 2009 - 5th International Conference on Web Information Systems and Technologies
226
tree structure. All browsers generate DOM-events for
a set of user actions and other events for a web page.
Notifications for these events are then delivered to all
elements of that branch of the DOM-tree which con-
tains the element the event originated at, via a mech-
anism called event-bubbling and -capturing. (See fig-
ure 1 for an example, the event originated in the cell
of a table)
This means, that any script registered as an event
handler at the body element of a HTML-page will re-
ceive all events generated by the browser. The noti-
fication for these events provides the origin and the
type of the event. In this way, we can record these
information easily at one single position.
2.5 Different Approaches
We can classify different approaches according to the
locations where the data is captured. We can distin-
guish three main strategies: at the client, at the server
or at a proxy.
2.5.1 Client Based
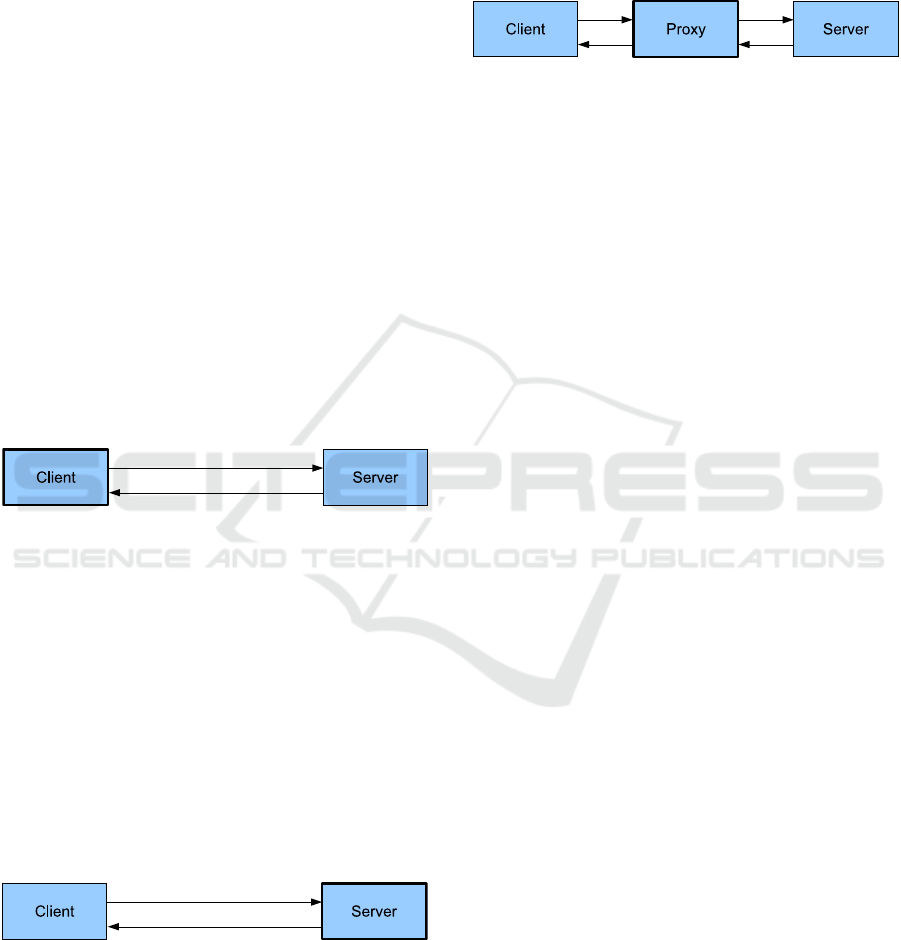
Figure 2: Client based solution.
In the client based approach, some special software
has to be installed on every client computer, which
will log the users actions. Most of the time, a screen
recorder is used which will record the whole screen
as a video, without capturing additional data like net-
work traffic. The upside of this approach is the de-
tailed logging of the user’s mouse actions. On the
other hand, this technique results in high manual ex-
penditure as the software has to be installed on every
client machine which should be used in the test.
2.5.2 Server Based
Figure 3: Server based solution.
The plus of the server based approach lies in the com-
plete transparency to the user. The big disadvantage
of this method is the prerequisite of access to the com-
puter system the web application is based on, some-
thing which is not necessarily applicable.
2.5.3 Proxy Based
A proxy is some hard- or software which is places
in between the client and the server. All traffic and
communication is then passed through the proxy.
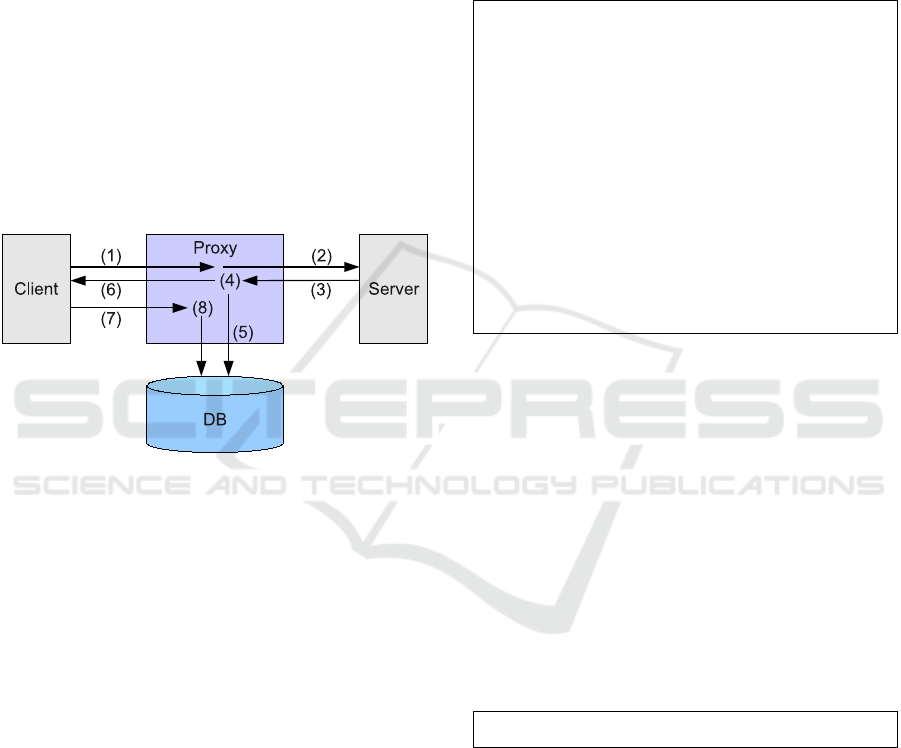
Figure 4: Proxy based solution.
The proxy based approach combines the up- and
downsides from the other two, with the upsides pre-
vailing. You neither need access to the web server nor
do you need to install software on all the client com-
puters. The changes to the clients are minimal easy to
do. This way, the participants can conduct the test in
their usual environment.
2.5.4 Assessment of the Different Approaches
Both the client and the server based approach do not
suit our requirements. With the client based approach,
you have to install some kind of software on every
participants computer, with the server-based approach
you need to have access to the servers, hosting the
web sites or web applications you want to test. As
this is either not applicable in case of the servers or
means a lot of work in case of the client based way,
we go for a third kind, the proxy based approach. In
this case, you insert a machine between the server and
the client, through which all data is tunneled. For that,
you need to either configure the clients web browser
to use the proxy, or you can configure your web server
to deliver all pages through our tool.
The proxy has full access to all data transmit-
ted between the client and the server and can trans-
parently log all requests. As only logging the re-
quests would be in no way better than parsing the web
servers log-files, we need additionally means of cap-
turing user actions. This can be done by inserting a
Java-Script, which registers as a event handler for all
DOM-Events generated by the clients browser.
3 RELATED WORK
3.1 Prior Approaches
There ist some work already done in this area, most
notably are the tools WET (Web Event-logging Tool)
and WebQuilt. WET was developed in 1999 by
AT&T to help testing their web based applications
(Etgen and Cantor, 1999). It not only featured
T-PROX - A User-tracking Proxy for Usability Testing
227

a HTTP-Proxy, which captured all data requested
through it, but also used Java-Script to capture events
on the client-side. It’s downside was, that the script
had to be inserted manually, and even more, that it
wasn’t released to the public.
WebQuilt was developed in 2001/02 at the Uni-
versity of California in Berkeley (Hong et al., 2001).
It featured a slightly different approach. In this case,
all requests were dispatched through an URL (Uni-
form Resource Locator) relative to the proxy. This
meant event less configuration on the client side, but
fails today in most cases. The proxy had to rewrite all
URL found in the HTML code to redirect the links.
This fails for all dynamically generated ones, and is
therefore not advisable. Especially noteworthy about
WebQuilt was the graphical analysis tool. It displayed
all visited pages as a graph, where the pages were dis-
played as the vertices and the traversed links were dis-
play as edges between them. The more often a link
was used, the stronger it was emphasized. Further-
more WebQuilt measured the time a user spend on a
site, and marked those pages, where the user spend
more time than on others.
4 T-PROX: A NEW APPROACH
TO USABILITY TESTING
We will first discuss some preliminary considerations
before explaining the implementation details of our
solution “T-Prox”.
4.1 Preliminary Considerations
For the best possible analyses, we have to solve two
problems, the identification of the user and the identi-
fication of the user’s actions.
4.1.1 Identifying the User
We have three possibilities to identify the user:
• via Cookies,
• via IP-address and the browser’s ’user agent’
string or
• via ’Proxy-Authentication’.
Cookies are small portions of data used to store
information on the client side while browsing the web.
They are widespread used by the advertising industry
and have therefore a very bad reputation. Many users
dismiss them, which would disturb our test. We will
therefore have to choose a different possibility.
Using the IP-address and the ’user-agent’ as an
identification can lead to problems, too. Due to a tech-
nique called ’Network-Address-Translation’ (NAT)
many users share one external IP-address. As the
used browsers are limited, too, we could then iden-
tify to users as one and thereby eliminate the usability
of these data records.
The identification via the ’Proxy-Authentication’-
mechanism is suiting our needs the best. It isn’t com-
pletely transparent as it needs for the user to enter cre-
dentials when visiting the first page via the proxy, but
this way, we can ensure that we can not only distin-
guish between different users, but can also identify
every user for later questioning. (See (Fielding et al.,
1999) and (Franks et al., 1999) for details on ’Proxy-
Authentication’).
4.1.2 Identifying the User’s Actions
We can distinguish between several different user ac-
tions like clicking on a link or on a non-interactive
element (a so called blind-click), changes in a form,
drag ’n’ drop, text-selection or hovering (no mouse
movements for a specific time). For each type of ac-
tion we have to gather different information:
• the time and position,
• the affected element(s),
• key or mouse button,
• the selected text and
• the current page.
Not all particulars have to be logged for every action,
only those which are applicable. Additional data we
need include which page is loaded in which browser
window and the size of the windows.
The problem is that we don’t get exactly one no-
tification for each individual action. There are some
user actions that we get several notifications for, and
some we don’t get any events for. The second prob-
lem when identifying the user’s actions is, that two
actions can lead to the same event notifications by the
browser.
For that reason, we have to deduce what the user
did, from the information we get. A “drag ’n’ drop”
leads to the same DOM-events as a simple text-
selection. In both cases, the users presses the primary
mouse button, moves the mouse while holding it, and
releases the button again. The difference is, that in
one case, the selection in the text changes, and in the
other it stays the same.
WEBIST 2009 - 5th International Conference on Web Information Systems and Technologies
228
4.2 Implementation
The implementation consists of two main compo-
nents:
• the proxy, build to log all traffic and as much of
the user interaction as possible and
• the reporter, a tool build to help in analyzing the
gathered data.
Our programming language of choice was Java, as
one of our requirements was the portability of the tool.
With Java, we had a sufficient level of network ac-
cess and performance combined with a wide range of
available platforms. For the database back-end, we
chose the PostgreSQL server as it is a very reliable
and fast open-source database system.
4.2.1 The Proxy
Figure 5: Handling of a client request.
The proxy is composed of the main proxy, a minimal
web server and the database. Figure 5 shows the nor-
mal handling of a client request:
1. Client requests page
2. Proxy fetches page
3. Server delivers page
4. Proxy modifies page
5. Proxy stores page
6. Modified page is delivered to the client
7. Client send notifications and information about
user actions to the proxy
8. Proxy saves info about user actions
To ensure the fastest possible execution of the
script, hooking the logging functions into the browser,
it is linked inside the head-tag. These scripts are
loaded and execute even before the whole page is
loaded. To identify the proper placement, a simple
finite state machine is constructed as matching with
a regular expression could fail due to HTTP/1.1’s
chunked-encoding. The inserted link points to the
proxy server itself, which delivers the script through
its minimal web server.
When the script is executed it registers itself as a
listener for all user events at the document body and
therefore receives all events that originate on the page
as pointed out in section 2.4. It then sends notifica-
tions about these events along with all necessary in-
formation via a XMLHttpRequest to the proxy.
click
abspos=(843,387)
pos=(158,349)
path=body8:div2:table2:tbody1:tr4:td21:p
value=p[]
anchor=
button=0
eventbutton=0
shift=false
ctrl=false
alt=false
time=1201258528468
window.name=41878-1201258520187
href=http://www.heise.de/
Figure 6: Protocol data transmitted via POST-request.
The security guidelines of XMLHttpRequest only
allow connections the originating server (Web API
Working Group, 2007). This means that we have to
identify and capture our request and to not pass them
on. We achieve this by constructing a specific URL,
which can easily be identified and distinguished from
normal requests. The data is then send in the POST-
request’s body to the proxy. (See figure 6)
In the context of identifying the user’s actions,
we also have to identify the involved elements. To
achieve this, we traverse the DOM-tree from the ele-
ment to the document’s body and trace this path. For
the “td”-element in figure 1, the resulting path is:
body1:table2:tr3:td
With this information, it is easy to identify the in-
volved elements later on.
The next stage is to identify and note the element’s
value. To achieve this, we take a look at the ele-
ment’s attributes. We will record all of the element’s
attributes together with their values. For elements
which directly enclose text, like a “p”-tag, this text
is stored, too.
Whenever an element is clicked, we have to de-
cide if the click was a blind-click or if the user clicked
on a link. To achieve this, we try to determine an ele-
ment’s link status by searching the DOM-tree towards
T-PROX - A User-tracking Proxy for Usability Testing
229
Algorithm 1 : Tracing an element’s path.
while element <> body do
for i := 0 to parent.children.length do
if parent.children[i] = element then
pos := i;
break;
end if
end for
path := element.parent.name + pos + ’:’ + path;
element := element.parent;
end while
the root for an “anchor”-tag. If the search is success-
ful we note the link target and destination, where the
target is the targeted browser window.
4.2.2 The Reporter
The reporter GUI eases the analyses of the captured
data. Its implementation utilizes the Java Univer-
sal Network/Graph Framework (JUNG) to display the
graph and the Pentaho Reporting Framework (for-
merly known as JFreeReport) to create printouts.
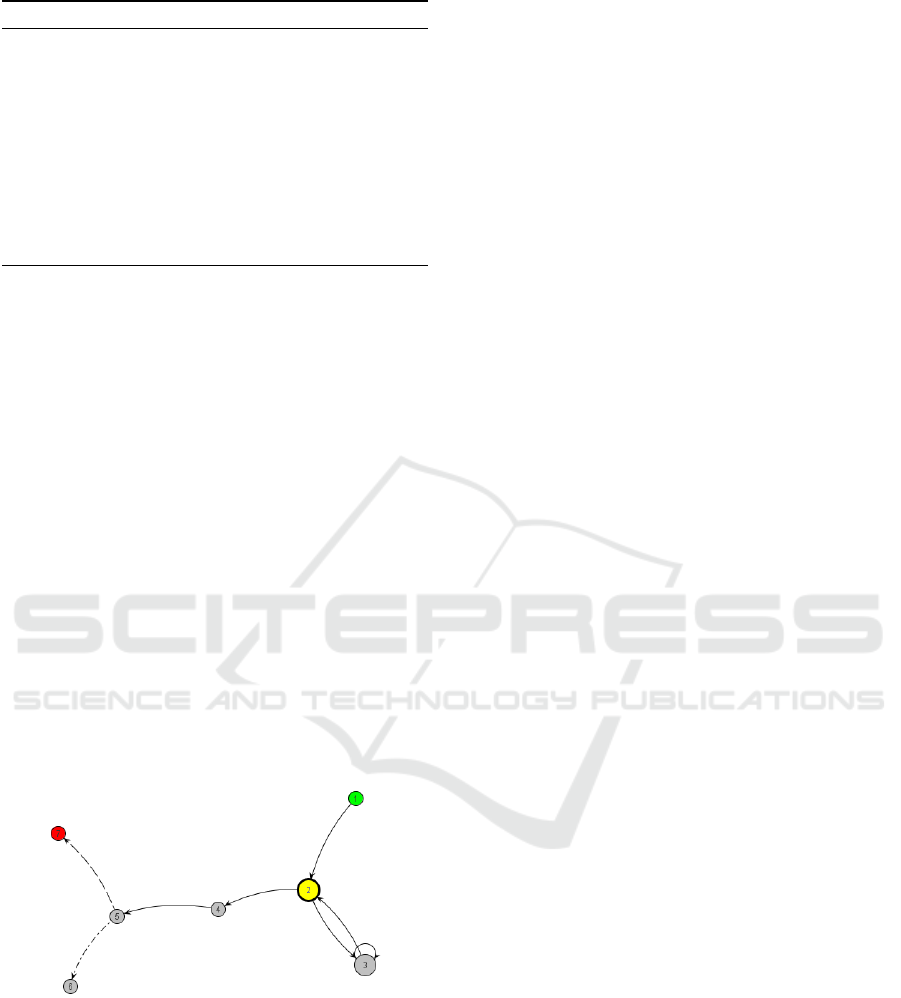
It displays the visited pages as a graph (shown
in figure 7). The vertices are created from the sin-
gle URLs (Uniform Resource Locator (Berners-Lee
et al., 2005)) the user visited and the edges corre-
spond to the links the user used to move between
them. Pages which are visited more often are shown
bigger to easily identify possible obstacles when navi-
gating the web site. The first and and last visited page
are indicated by colors.
Figure 7: The graph, representing the user’s movement
through a web site.
The data shown consists of the first and the last
visited page, the overall time the user needed to get
from the first to the last page, how often the first
page was visited, how many pages were visited sev-
eral times, the count of clicks and especially the count
of blind click, and the average actions per minute. The
last visited page provides an easy way to determine if
the user reached the aspired goal, the first page shows
if the user approached the test correctly. The amount
of time is an instrument to measure the performance
of the participant if they are normalized by the count
of clicks and the average clicks per minute.
In case a page seems to be problematic, the list of
user actions for this site together with the graphical
representation of clicks and blind clicks can provide
more insight. Here you can reproduce what the user
did on one specific web page. The aggregated amount
of time spend on this page along with the average
amount of time spend at every visit can be another
important indicator for a difficult site.
All these information can also be printed out in an
easy to read protocol for offline analyses.
5 CONCLUSIONS AND FUTURE
WORK
We succeeded in our goal to develop an easy to use
and cost efficient tool, which helps in testing web
based user interfaces. The gathered data is then pre-
sented for easy analysis and evaluation. As out tool
is non intrusive, it should be easier to acquire partici-
pants for the usability tests and hence the tests can be
carried out more often.
Since no access to the web server is needed,
universities and and other researchers can run tests
against every chosen web site. Seeing as the software
is available for free and as it is open source and there-
fore easily adapted, it should find a wide acceptance
in the scientific community. To ease the future devel-
opment of “T-Prox” a website was created as a central
point for further discussion and progress.
5.1 Future Work
To even enhance the process of analysis, we are work-
ing on several improvements. The first one is to con-
solidate several user records into one to clarify which
pages are the most problematic. The second add-on
will construct the website’s structure and enhance the
displayed graph with this information. The tester can
than see which shortcuts the user did not user and
where the user took a wrong turn while navigating the
web site.
ACKNOWLEDGEMENTS
This work was partly funded by the German Research
Association DFG.
WEBIST 2009 - 5th International Conference on Web Information Systems and Technologies
230

REFERENCES
Berners-Lee, T., Fielding, R., and Masinter, L. (2005). Uni-
form resource identifier (URI): Generic syntax. RFC
3986. http://www.ietf.org/rfc/rfc3986.txt.
Etgen, M. and Cantor, J. (1999). What does get-
ting wet (web event-logging tool) mean for
web usability? In Proceedings of the 5th
Conference on Human Factors & the Web.
http://zing.ncsl.nist.gov/hfweb/proceedings/procee-
dings.en.html.
Fielding, R., Gettys, J., Mogul, J., Frystyk, H., Masin-
ter, L., Leach, P., and Berners-Lee, T. (1999). Hy-
pertext transfer protocol – HTTP/1.1. RFC 2616.
http://www.ietf.org/rfc/rfc2616.txt.
Fogg, B. J., Marshall, J., Laraki, O., Osipovich, A., Varma,
C., Fang, N., Paul, J., Rangnekar, A., Shon, J., Swani,
P., and Treinen, M. (2001). What makes web sites
credible?: a report on a large quantitative study. In
CHI ’01: Proceedings of the SIGCHI conference on
Human factors in computing systems, pages 61–68,
New York, NY, USA. ACM.
Franks, J., Hallam-Baker, P., Hostetler, J., Lawrence,
S., Leach, P., Luotonen, A., and Stew-
art, L. (1999). HTTP authentication: Ba-
sic and digest access authentication. RFC
2617.http://www.ietf.org/rfc/rfc2617.txt.
Hong, J. I., Heer, J., Waterson, S., and Landay, J. A. (2001).
Webquilt: A proxy-based approach to remote web us-
ability testing. ACM Transactions on Information Sys-
tems, 19(3):263–285.
ISO, editor (1998). ISO 9241-11:1998 Ergonomic require-
ments for office work with visual display terminals
(VDTs) – Part 11: Guidance on usability. ISO.
Lilienthal, S. (2008). T-Prox: Vorstellung einer L
¨
osung zur
Proxy-gest
¨
utzten Usabilityanalyse von webbasierten
GUIs. In Informatiktage, volume S-6 of LNI, pages
133–136. GI.
Nielsen, J. (1994). Guerrilla hci: using discount usabil-
ity engineering to penetrate the intimidation barrier.
pages 245–272.
Nielsen, J. (1997). Discount usability for the web. Online.
http://www.useit.com/papers/web discount usability
.html.
Nielsen, J. (2000). Why you only need to test with 5 users.
http://www.useit.com/alertbox/20000319.html.
Nielsen, J. and Landauer, T. K. (1993). A mathematical
model of the finding of usability problems. In CHI
’93: Proceedings of the INTERACT ’93 and CHI ’93
conference on Human factors in computing systems,
pages 206–213, New York, NY, USA. ACM.
Spool, J. and Schroeder, W. (2001). Testing web sites: five
users is nowhere near enough. In CHI ’01: CHI ’01
extended abstracts on Human factors in computing
systems, pages 285–286, New York, NY, USA. ACM
Press.
Tedeschi, B. (1999). Good web site design can
lead to healthy sales. The New York Times.
http://www.nytimes.com/library/tech/99/08/cyber/co-
mmerce/30commerce.htm
Web API Working Group (2007). The xml-
httprequest object. Working draft, W3C.
http://www.w3.org/TR/XMLHttpRequest/.
T-PROX - A User-tracking Proxy for Usability Testing
231
