
EPSNR FOR OBJECTIVE IMAGE QUALITY MEASUREMENTS
Chulhee Lee, Guiwon Seo and Sangwook Lee
School of Electrical and Electronis Engineering,Yonsei University, Shinchon dong, Seoul, Korea Rep.
Keywords: EPSNR, Objective quality measurement, Perceptual image quality.
Abstract: In this paper, we explore the possibility to apply a recently standardized method for objective video quality
measurements to measure perceptual quality of still images. It has been known that the human visual system
is more sensitive to edge degradation. We apply this standardized method to several image data sets which
have subjective scores. The standardized method is compared with existing objective models for still images.
Experimental results show that the standardized method shows better performance than the conventional
PSNR and show similar performance compared to top-performance models.
1 INTRODUCTION
Objective quality assessment emerges an important
problem. As multimedia services, such as mobile
broadcasting, video on demand (VOD) and
videophones, over channels where bandwidth can
not be guaranteed become widely available, quality
monitoring becomes a critical issue. Traditionally,
perceptual video quality has been measured by a
number of evaluators who subjectively evaluate
video quality. Although this subjective evaluation is
considered to be the most accurate method, it is
expensive and cannot be done in real time. As a
result, efforts have been made to develop objective
models for perceptual video quality measurement.
These efforts have resulted in several international
standards (ITU-R, 2003, ITU-T, 2004). For example,
in (ITU-R, 2003, ITU-T, 2004), four objective
models are included. Although these models are
developed to measure perceptual quality of video
signals, they also might be used to measure
perceptual quality of still images.
Traditionally, codec optimization has been done
by minimizing mean square errors (equivalently
PSNR). However, it has been known that the
correlation between PSNR and perceptual quality is
not high and efforts are made to better metrics to
measure perceptual quality. These metrics can be
used for parameter optimization during encoding
process. They can be also used to evaluate new
codecs, video transmission systems, traffic
optimization, etc. In this paper, we explore the
possibility to apply the standardized method to
measure perceptual quality of still images. Among
the four models of (ITU-R, 2003, ITU-T, 2004), we
tested the model developed by Yonsei. The model is
easy to implement and very fast. Consequently, it
can be used for codec optimization which requires a
large number of computations of the metric. We
applied the method the database which has been
widely used for quality measurement of still images.
We also conducted our own subjective test and
evaluate the performance of the model.
2 EPSNR
It has been known that the human visual system is
more sensitive to edge degradation. Thus, in (ITU-R,
2003, ITU-T, 2004), an edge detection algorithm is
first applied to find edge areas. For example, the
horizontal gradient image and the vertical gradient
image are first computed using gradient operators.
Then, the magnitude gradient image is computed as
follows:
(,) (,) (,)
horizontal vertical
gmn g mn g mn=+. (1)
Then, thresholding operation is applied to the
magnitude gradient image to determine edge pixels.
In (ITU-R, 2003, ITU-T, 2004), the Sobel operator
is recommended.
Alternatively, it is possible to use the successive
edge detection procedure. First, a vertical gradient
operator is applied to the reference image, producing
a vertical gradient image. Then, a horizontal gradient
operator is applied to the vertical gradient image,
92
Lee C., Seo G. and Lee S. (2009).
EPSNR FOR OBJECTIVE IMAGE QUALITY MEASUREMENTS.
In Proceedings of the First International Conference on Computer Imaging Theory and Applications, pages 92-95
DOI: 10.5220/0001807800920095
Copyright
c
SciTePress
producing a horizontal and vertical gradient image.
Then, a thresholding operation produces edge areas.
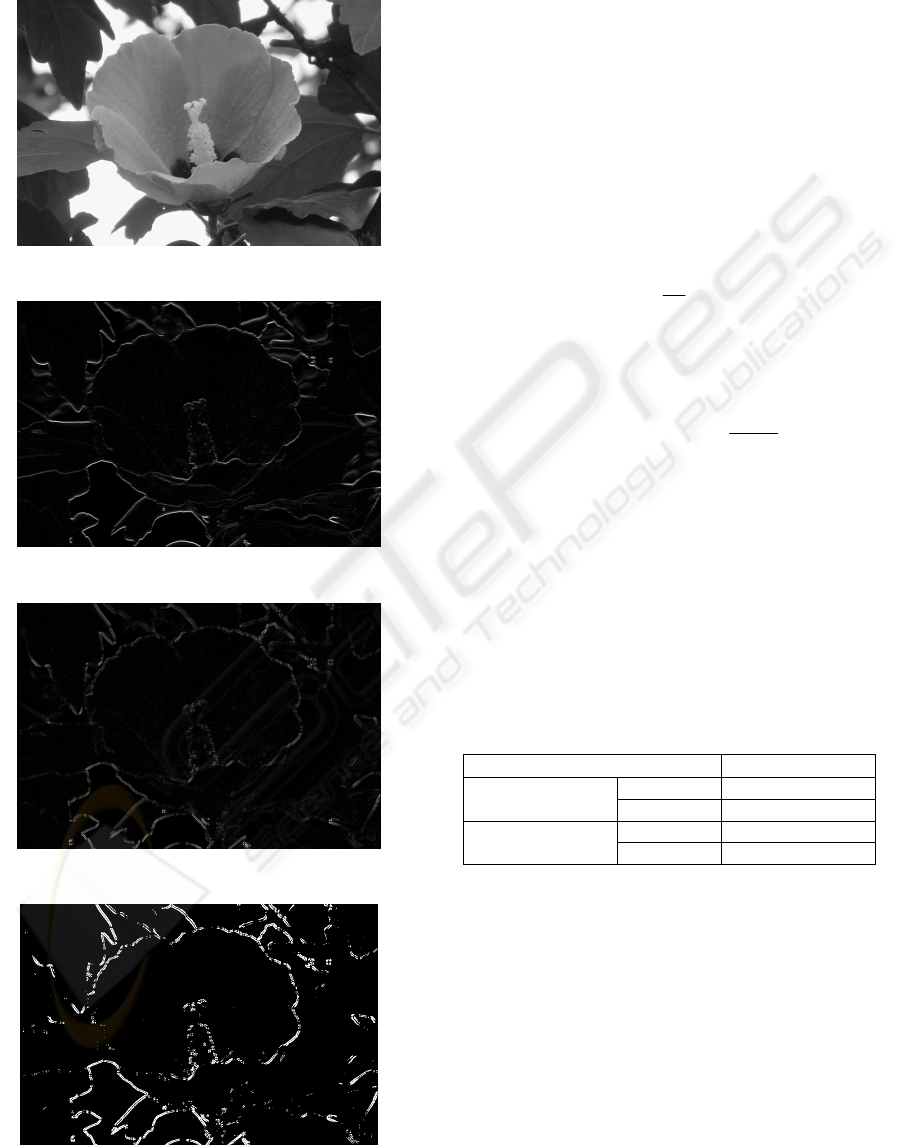
Figs. 2-4 illustrate this procedure.
Figure 1: An original image.
Figure 2: A vertical gradient image.
Figure 3: A horizontal and vertical gradient image.
Figure 4: Edge pixels.
Next, errors between the edge pixels of the source
image and those of the processed image are
computed. For example, the squared error of edge
areas of the l-th frame can be computed as follows:
pixeledgeanisjiSif
jiPjiSse
l
ij
lll
e
),(
}),(),({
2
∑∑
−=
(2)
where
),( jiS
l
is the l-th image of the source video
sequence,
),( jiP
l
represents the l-th image of the
processed video sequence. Finally, the global edge
mean squared error is computed as follows:
1
1
L
l
ee
l
mse se
K
=
=
∑
where K is the total number of pixels of the edge
areas. Finally, the edge PSNR (EPSNR) is computed
as follows:
2
10
10log ( )
e
P
EPSNR
mse
=
where P is the peak value. If the number of edge
pixels is smaller than a certain value, the threshold
value is reduced by 20 until a sufficient number of
edge pixels are obtained. In the Yonsei model, this
EPSNR is used as a base objective video quality
metric after some posting-processing (C. Lee et al.,
2006). The model was validated by independent
laboratories and significantly outperformed PSNR
(Table 1).
Table 1: Performance comparison on the VQEG Phase II
Data.
correlation
The Yonsei
model
525 0.9086
625 0.8519
PSNR
525 0.7573
625 0.6954
3 EXPERIMENTAL RESULTS
We applied the Yonsei model to the database
provided by LIVE Lab (H. R. Sheikh, et al. 2005). In
(H. Sheikh, 2006), a number of perceptual quality
metrics for still images are compared using the same
database. Thus, we compared the Yonsei model with
the models of (H. Sheikh, 2006). Table 2 shows
performance comparison. It is noted that all the other
metrics are taken from (H. Sheikh, 2006) except for
EPSNR FOR OBJECTIVE IMAGE QUALITY MEASUREMENTS
93

EPSNR. As can be seen, EPSNR provides high
correlations.
Table 2: Performance comparison (H. Sheikh, 2006).
jp2k#2 jpeg#2
PSNR 0.8740 0.9167
JND 0.9734 0.9870
DCTune 0.7834 0.9418
PQS 0.9364 0.9777
NQM 0.9463 0.9783
Fuzzy 0.9133 0.9509
BSDM 0.9450 0.9747
SSIM(MS) 0.9711 0.9879
IFC 0.9626 0.9744
VIF 0.9787 0.9885
EPSNR 0.9515 0.9457
In the next test, we printed some of the LIVE data
set using two colour printers. Using the printed
images, we performed subjective tests. Fig. 5 shows
the scatter plots between the subjective scores and
EPSNR. As can be seen, EPSNR shows high
correlations.
5 CONCLUSIONS
In this paper, we applied the recently standardized
method for objective video quality measurements to
measure perceptual quality of still images.
Experimental results show that it would be possible
to use the model for still images. By taking into
account the characteristics of still images, it would
be also possible to improve the performance of the
model.
REFERENCES
Recommendation ITU-R BT.1683, “Objective perceptual
video quality measurement techniques for digital
broadcast television in the presence of a full
reference,” 2003. Smith, J., 1998. The book, The
publishing company. London, 2
nd
edition.
ITU-T Recommendation J.144, “Objective perceptual
video quality techniques for digital cable television in
the presence of a full reference,” 2004. 11
C. Lee, S. Cho, J. Choe, T. Jeong, W. Ahn and E. Lee,
“Objective Video Quality Assessment,” Optical
Engineering, vol. 45, no. 1, pp. 1-11, 2006.
(a)
(b)
Figure 5: Scatter plot between EPSNR and subjective
scores of the printed images (a) Printer A, correlation
coefficient: 0.894179 (b) Printer B, correlation coefficient:
0.918683.
H. Sheikh, M. Sabir, and A. Bovik, “A Statistical
Evaluation of Recent Full Reference Image Quality
Assessment Algorithms,” IEEE Trans. Image
Processing, Vol. 15, No. 11, pp. 3441-3452, 2006.
JNDmetrix Technology Sarnoff Corp., evaluation Version,
2003 [Online].Available:
http://www.sarnoff.com/products-services/video-
vision/jndmetrix/downloads.asp
A. B. Watson, “DCTune: A technique for visual
optimization of DCT quantization matrices for
individual images,” Soc. Inf. Display Dig.Tech. Papers,
vol. XXIV, pp. 946–949, 1993.
M. Miyahara, K. Kotani, and V. R. Algazi, “Objective
Picture Quality Scale (PQS) for image coding,” IEEE
IMAGAPP 2009 - International Conference on Imaging Theory and Applications
94

Trans. Commun., vol. 46, no. 9,pp. 1215–1225, Sep.
1998.
N. Damera-Venkata, T. D. Kite, W. S. Geisler, B. L.
Evans, and A.C. Bovik, “Image quality assessment
based on a degradation model,”IEEE Trans. Image
Process., vol. 4, no. 4, pp. 636–650, Apr. 2000.
D. V. Weken, M. Nachtegael, and E. E. Kerre, “Using
similarity measures and homogeneity for the
comparison of images,” Image Vis.Comput., vol. 22,
pp. 695–702, 2004.
I. Avcibas¸, B. Sankur, and K. Sayood, “Statistical
evaluation of image quality measures,” J. Electron.
Imag., vol. 11, no. 2, pp. 206–23, Apr., 2002.
Z. Wang, E. P. Simoncelli, and A. C. Bovik, “Multi-scale
structural similarity for image quality assessment,”
presented at the IEEE Conf. Signals, Systems, and
Computers, Vol. 2, pp. 1398-1402, Nov. 2003.
H. R. Sheikh, A. C. Bovik, and G. de Veciana, “An
information fidelity criterion for image quality
assessment using natural scene statistics,”IEEE Trans.
Image Process., vol. 14, no. 12, pp. 2117–2128, Dec.
2005.
H. R. Sheikh and A. C. Bovik, “Image information and
visual quality,”IEEE Trans. Image Process., vol. 15,
no. 2, pp. 430–444, Feb. 2006.
H. R. Sheikh, Z. Wang, L. Cormack, and A. C. Bovik,
LIVE Image Quality Assessment Database, Release 2
2005(Online). Available:
http://live.ece.utexas.edu/research/quality.
EPSNR FOR OBJECTIVE IMAGE QUALITY MEASUREMENTS
95
