
OBJECTS VISUALIZATION IN DIGITAL TERRAINS USING
ADAPTIVE VIEW-DEPENDENT TECHNIQUES
Rafael Moreira Savelli, Roberto de Beauclair Seixas
Computer Graphics Technology Group, Pontifical Catholic University of Rio de Janeiro
Rua Marqu
ˆ
es de S
˜
ao Vicente 255, Rio de Janeiro, Brazil
Anselmo Antunes Montenegro and Esteban Walter Gonzalez Clua
Computer Institute, Federal Fluminense University, Rua Passo da P
´
atria 156, Niter
´
oi, Brazil
Keywords:
Terrain Visualization, View-dependent Techniques, Image-base Rendering.
Abstract:
There are many applications involving featured terrains visualization. One of them is for gaming purposes.
However, when dealing with real data, many of this applications fail to cope with such information. So,
this work presents an efficient way to minimize or even remove this kind of problem. We propose a method
based on image-based rendering and view-dependent visualization techniques. These methods were applied in
terrain visualization with real vegetation data where distribution and type is determined from digital satellite
images.
1 INTRODUCTION
There are many problems related to real-time visual-
ization and simulation of featured terrains and some
of these problems were already solved by a large
number of computer graphics researchers. However,
the problem of efficiently rendering featured terrains
is still a challenge as recent demands for larger and
more complex terrains are leading to an increase in
the number of objects to be rendered. Depending on
the current amount of objects to be rendered on each
frame, the final results can be unsatisfactory because
many applications are not well prepared to deal with
such amounts of information.
Nowadays we can find many terrain visualization
and simulation applications that require the display of
objects with dense distribution. In many cases, the
objects are vegetation data which include forests with
many different elements as trees, bushes, grass and
so on. Examples of works that have investigated the
problem of visualization of vegetation data on terrains
are (Lluch et al., 2004; Jakulin, 2000; Dietrich et al.,
2005). In this work we also deal with the problem
of rendering terrain with dense vegetation and part of
the motivation is from the problem investigated in a
previous work (Savelli and Beauclair, 2006).
In (Savelli and Beauclair, 2006), a satellite im-
age was used extensively to help composing a cer-
tain visualization. First of all, the authors used the
own satellite image as the terrain texture. Later, the
authors have shown how to classify different kinds
of vegetation using only information provided by the
satellite image by applying a method based on the
combination of wavelets representation and the split-
and-merge algorithm for grouping similar informa-
tion. The solution that was proposed was able to place
a large number of elements on the considered terrain
in a semi-automatic way.
The work presented here suggests a natural con-
tinuation based on the previous results where a sim-
ple, but efficient method, integrates a group of visu-
alization techniques based on image-based rendering
with level of detail representations (Akenine-Mller
and Haines, 1998). The aim is to solve the problem
of terrain rendering with a large amount of vegeta-
tion data. To be more specific, we propose a scheme
that combines multi-resolution billboards representa-
tion with a mechanism for object rendering in which
density may vary according to related camera position
and viewing angle. In addition, a hierarchical struc-
ture is used in order to represent, in an efficient way,
billboards collections placed on terrain.
The document structure is organized as following:
in section 2 we discuss some important fundamentals
and some relevant works associated to them; in sec-
tion 3, we describe the proposed method giving a brief
379
Moreira Savelli R., de Beauclair Seixas R., Antunes Montenegro A. and Walter Gonzalez Clua E.
OBJECTS VISUALIZATION IN DIGITAL TERRAINS USING ADAPTIVE VIEW-DEPENDENT TECHNIQUES.
DOI: 10.5220/0001802003790386
In Proceedings of the Fourth International Conference on Computer Graphics Theory and Applications (VISIGRAPP 2009), page
ISBN: 978-989-8111-67-8
Copyright
c
2009 by SCITEPRESS – Science and Technology Publications, Lda. All rights reserved

explanation on the first sub-section and a more de-
tailed one on the following sub-sections; in section 4
results are presented from the implementation of the
methods described in section 3. In section 5 we dis-
cuss probable future works. Finally, in section 6 we
present a conclusion and some considerations.
2 MODELING TERRAIN AND
OBJECTS
In general, interactive terrain visualization algorithms
are rather complex. For this reason, in the last
decade, the subject has received attention from many
researches from all around the world. Hence, many
strategies and solutions were developed since then.
In computer graphics, a terrain is basically a
graphical object where a surface is used as the main
geometrical support. Commonly, this surface is rep-
resented as a triangulated network where every sin-
gle point has attributes and information provided from
one or more texture maps. So, a given geographical
region is modelled as a graphical three-dimension ter-
rain composed by a triangulated network and a geo-
referenced texture. The final result is an empty ter-
rain with no objects on it. All user can see is some
elevation and geographical accidents like rivers and
lagoons.
2.1 Terrain Level of Detail
In many cases, terrain data are represented by a huge
amount of triangles and textures with very high res-
olution. In such conditions, simpler strategies are no
longer capable to deal with all information for real
time interaction. In order to avoid this problem, other
sophisticated methods must be used. Such meth-
ods must take into consideration the properties of the
scene as well as some intrinsic characteristics of vi-
sualization processes as existing spatial and temporal
coherence in the environment.
Most actual methods agree that, in real time vi-
sualization algorithms, the more distant from the ob-
server a given region is, the less refinement is neces-
sary. This is a usual way to cut off unnecessary pro-
cessing without harming the visualization quality.
The need for different levels of refinement have
led developers to use a hierarchical structure where
every element represents a small terrain fragment in
a certain level of detail. Frequently, these structures
determine a recursive terrain subdivision producing
many regions that can be regular or irregular. In ad-
dition, it is necessary to define one or more schemes
which are capable of determining the best represen-
tation, for each region, as a function of distance and
observer position. In order to determine the level of
detail used, these schemes evaluate the projection er-
ror between the chosen level and the most refined
one (absolute error metric). Or optionally, between
the chosen level and the refinement level immediately
above in the same considered hierarchy (relative error
metric).
Among all proposed works involving level of de-
tail terrain visualization, two of the most significant
are those from (Lindstrom and Pascucci, 2001; Lind-
strom and Pascucci, 2002). The terrain visualization
method implemented in this work follows the same
principles and ideas described in both references (Po-
yart et al., 2002) and (Lindstrom and Pascucci, 2002).
2.2 Image-Base Object Modeling
Featured terrains are commonly useful for a very large
application range such as simulations and games. The
most difficult task consists in dealing with both terrain
and object data because the latter can be very complex
and numerous. A good example is a large terrain with
very dense vegetation on it.
Likewise in the case of empty terrains, it is also
possible to apply the same ideas and approaches of
view-dependent level of detail to every single object
spread all over the terrain surface. However, in some
cases like, for example, forest visualization, the num-
ber of objects can be so huge that even variable level
of detail geometric modelling may be insufficient to
keep interaction in usable rates. In such cases, a rea-
sonable alternative is to change completely or par-
tially the representation from geometric models to
image-based rendering structures.
Nowadays there are many image-based render-
ing visualization techniques including some simple
ones like sprites and billboards and others much
more sophisticated that in practice require implemen-
tation in Graphic Processing Units (GPUs), like depth
sprites (Pharr and Fernando, 2005) and relief textures
(Oliveira et al., 2000).
2.2.1 Sprites and Billboards
Sprites are graphical objects described, in most cases,
by planar textured surfaces. The given texture is ba-
sically a snapshot from an object (real or synthetic)
taken from a given point of view. In many cases, two
textures are placed in a perpendicular way in order to
produce a better approximation to 3D shapes as, for
example, in the representation of trees.
A billboard is a graphical object similar to a sprite,
however, differently from it, a billboard must rotate
GRAPP 2009 - International Conference on Computer Graphics Theory and Applications
380
itself in order to always face the observer, producing
the illusion of a three-dimensional effect in the visu-
alization process (McReynolds and Blythe, 1998).
Supposing that we are only interested in image-
base structures which require the less possible com-
plexity, we tested both sprites and billboards strate-
gies in a essay to figure out the most adequate one.
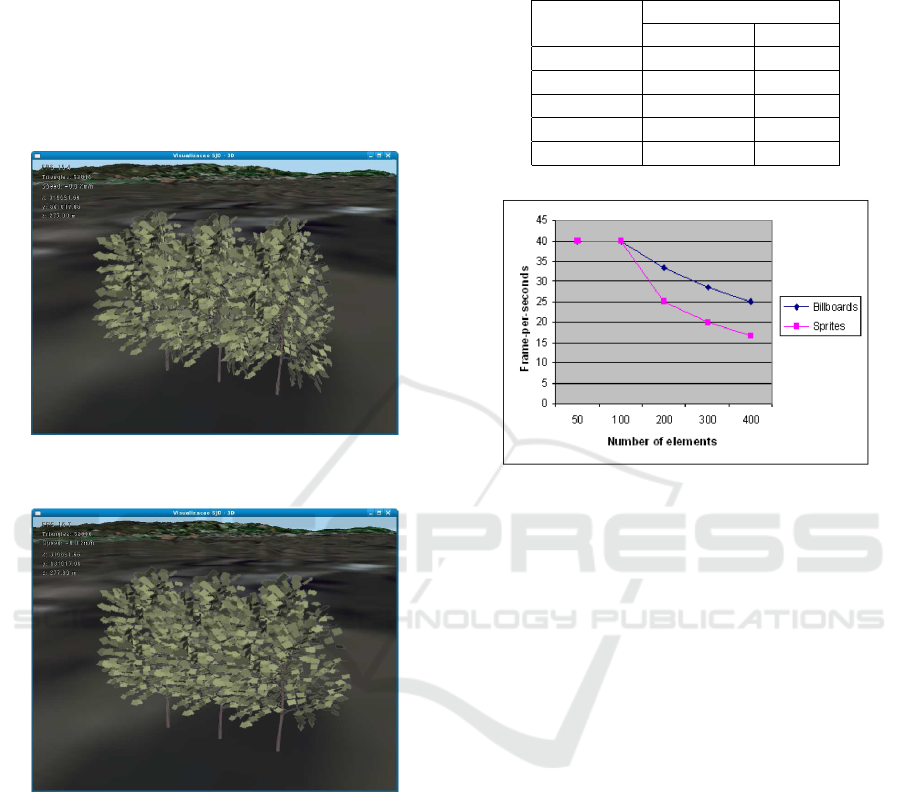
Figure 1 shows a little group of trees using only
sprites while Figure 2 shows only billboards trees.
Figure 1: Trees represented as sprites.
Figure 2: Trees represented as billboards.
In the beginning, we expected that sprite struc-
tures would require less computational effort than
billboard structures. However, practical tests have
shown exactly the opposite, frustrating our initial ex-
pectation. As we could observe, at each frame, draw-
ing sprites is usually much more expensive than draw-
ing the equivalent billboard. It became evident that
graphical processing units can draw a textured poly-
gon, evaluate a rotation matrix and finally, deal with
all basic operations faster than drawing two static tex-
tured polygons. As we can see in Table 1 and graphi-
cally in Figure 3 when adding more and more trees to
a given terrain, the frame-per-second taxes based on
sprite structures reduced faster than when using bill-
board structures.
Table 1: Billboards vs sprites performances.
Number of Frame-per-seconds:
elements: Billboards: Sprites:
50 40.0 40.0
100 40.0 40.0
200 33.3 25.0
300 28.6 20.0
400 25.0 16.7
Figure 3: Billboards vs sprites graphic performances.
All values in Table 1 were obtained by running a
very simple terrain visualization in a 1.6 GHz Intel 4
processor with 512 MB RAM memory and 256 MB
GeForce FX5200 video graphic card.
As a consequence of the results, we decided to use
a billboard-based strategy as the main representation
structure in our method. However, sophisticated tech-
niques like depth sprites and relief textures can be also
used for more realistic results.
It is important to say that another strategy that
was considered is the representation of vegetation el-
ements by models generated by procedural strategies
as, for example, L-Systems, using geometry shaders.
Although such strategy seems promising, the use of
geometry shaders has not produced competitive re-
sults yet, when large number of objects must be ren-
dered. The cause for such poor performance is due
to limitations in the buffer elements in current archi-
tectures. In the near future, it is expected that this
limitations will vanish as it is becoming evident with
the new generation of graphics hardware.
3 THE PROPOSED METHOD
All proposed techniques in this section are simple
but efficient and belong to the group of image-based
and view-dependent visualization problems. They
OBJECTS VISUALIZATION IN DIGITAL TERRAINS USING ADAPTIVE VIEW-DEPENDENT TECHNIQUES
381
are based in two main fundamental ideas: first, the
use of different image resolutions to represent three-
dimensional objects. Second, a technique which en-
ables the variation of the density of the vegetation dis-
tribution, depending on the distance to observer.
3.1 Overview
In a previous work, using methods and practices cited
in (Savelli and Beauclair, 2006), we distribute some
vegetation types all over the terrain by computing
their positions from satellite images. Here, for every
vegetation element, we built a set of textures from five
viewing angles in different digital resolutions. They
include front, back, left, right and top views. In run-
time and given a point of view, it is possible to create,
dynamically, a radial partition of the terrain into three
different regions in which we associate different lev-
els of density for the vegetation distribution. The idea
is to use less elements if the distance to the observer
is sufficiently large., use a medium density for the in-
termediary regions and finally, draw all elements in-
dividually in regions close to the observer.
Once decided which density to use, we select one
of the five viewing angle billboards according to the
camera orientation. Next, we must choose the appro-
priated resolution level according to distance between
camera and billboard. So, on the following subsec-
tions, we describe in details every necessary step to
compose the final visualization.
3.2 Billboards Construction
An important key to get an acceptable object repre-
sentation is to pick up a good texture to it. In the
Internet, there are many images that could be used as
tree textures, however, we opted to generate textures
from three-dimension polygonal models. The reason
to do so is simple and it is based on the idea that,
once you have the model, the creation of all discussed
viewing angles become more controllable and flexi-
ble increasing the chances to match our expectations
in the process of texture creation.
In this work, we capture texture images of objects
to create billboards. For that task, a software com-
ponent was integrated to our visualization application
in order to read and render three-dimensioned models
described in .obj format in a separated frame buffer.
This technique is also called frame buffer objects.
We also know that billboards are used with much
more efficiency when objects have axial symmetry.
When such symmetry is not present, billboards use
tend to be limited. A classical technique called impos-
tors (Schaufler, 1995) consists in generating dynamic
billboards just for small scene parts where approxima-
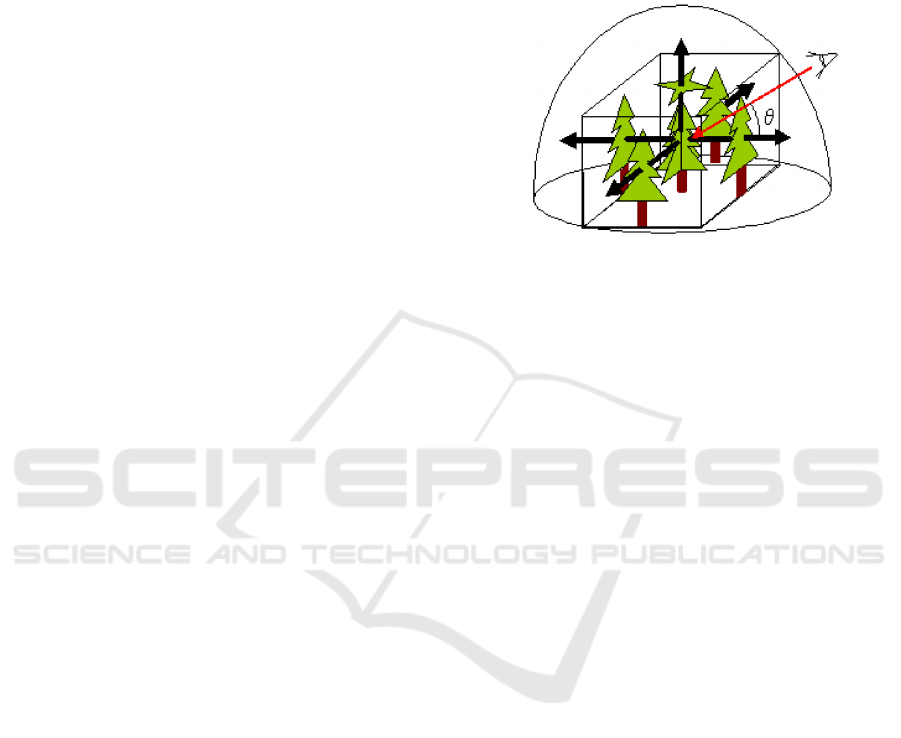
tion error is significant. In this work, we do not use
impostors and instead, we propose set of billboards
having a single texture for every orthogonal projec-
tion located in the top semi-hemisphere as shown in
Figure 4.
Figure 4: Billboards set and its orthogonal projections.
In our implementation, we get five textures where
each one represents a different viewing angle of an
object. In case, those five orthogonal textures are:
front, back, left, right and top. In the visualization
process, we select the billboard that has the mini-
mum difference between the creation angle and the
viewing one. Even with rotation transforms being ap-
plied to billboards, a special care is required in or-
der to guarantee continuity when textures must be
swapped. This could be solved by using 3D-warping
techniques (McMillan, 1997) as we know all depth
maps involved in such operation.
3.3 Elements Density Determination as
a Function of Distance
It is known that, the more distant to observer an ele-
ment is, the less vegetation details can be noticed. We
have simulated this notion by discarding some very
distant vegetation elements, saving CPU processing
in rendering time.
In Figure 5 we can identify three distinct vegeta-
tion groups with different distances between them and
the observer. The first group is the closest group to the
observer, located in the bottom of the figure. The sec-
ond group is around the middle of the figure, in an in-
termediary distance to observer. Finally, group three
can be found on the extreme top part of figure being
the most distant from all the analyzed ones. Looking
at each individual group is is possible to notice how
densities may vary according to distance.
In order to get the presented effect, we adopted
the common level-of-detail technique. This technique
is very useful to simplify three-dimensional model
networks as described in (Chamberlain et al., 1996;
GRAPP 2009 - International Conference on Computer Graphics Theory and Applications
382
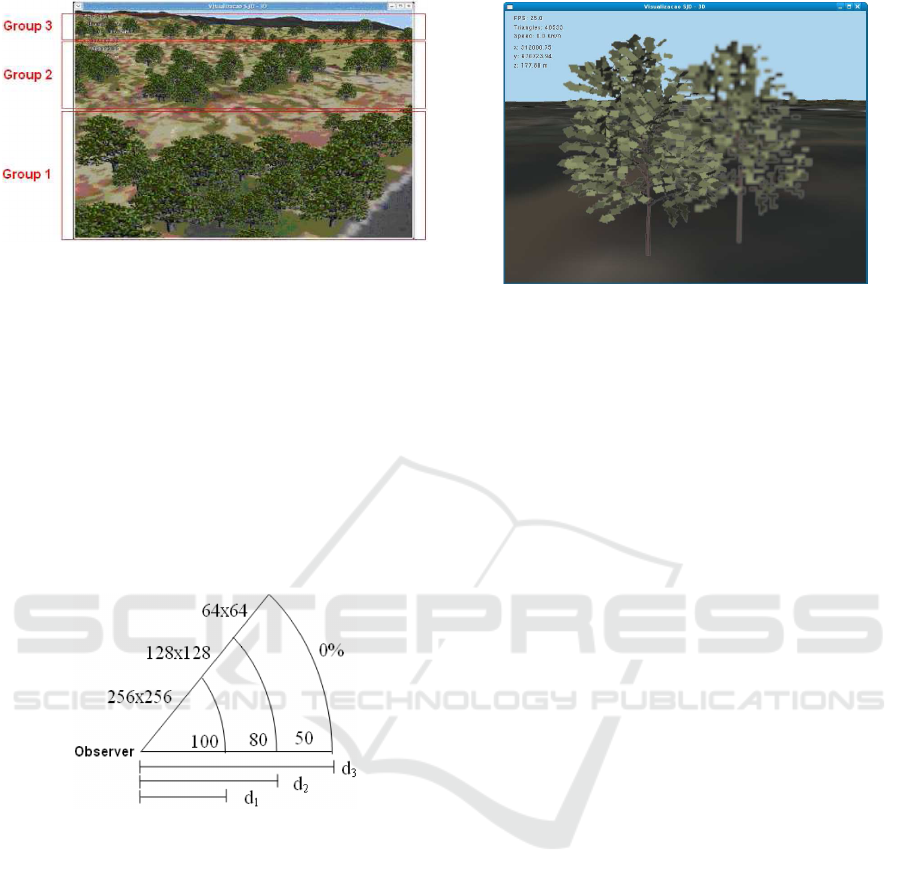
Figure 5: Billboards with adaptive density.
Funkhouser and Squin, 1993). In our case, level-of-
detail was adapted to cut off some very far away bill-
boards. The point is to do this in a smooth way with-
out harming the visualization. For that, we divided
the not culled terrain part into three different regions
with distances d
1
, d
2
and d
3
to the observer accord-
ing to Figure 6. We decided, by experiments, that for
a good visualization effect we must display 100% of
elements in the first group. In the second one, only
80% are shown. Finally, in the last group, we have
to cut off 50% of elements. After distance d
3
, no ele-
ments are displayed.
Figure 6: Mult-texture billboard distribution as function of
distance.
3.4 Multi-Resolution Billboard
In order to increase even more the frame rates, we
also include a multi-resolution representation for ev-
ery created billboard. In Figure 7, there are two bill-
boards with different resolutions. The left one has a
256x256 pixels texture while the right tree has only a
64x64 pixels texture.
The main idea consists in cutting off unnecessary
processing changing texture resolution dynamically
and at running time. To get the most efficiency, we
must attach higher quality textures in billboards near
observer and lower quality textures in billboards far
enough from observer.
In our case of study, we work with three distinct
resolution textures as described in (Jakulin, 2000).
Figure 7: Mult-texture billboard distribution as function of
distance.
Resolutions are 64x64, 128x128 and 256x256 pixels.
Figure 6 shows how we select texture resolution as a
function of distance d
1
, d
2
and d
3
.
3.5 Objects Grouping
The multi-resolution billboard method and the vari-
able density distribution mechanism yielded nice re-
sults, however, the final visualization did not reflect
precisely the real distribution as presented in satellite
images. To avoid this sort of problem, other tech-
niques must be used, such as level of detail and adap-
tive grouping.
Here, we consider that, if some vegetation element
is sufficiently distant from the observer, the angular
variations to make its billboard face the viewer would
be so small that a set of elements should be repre-
sented as a unique group displayed in a single bill-
board. Thus, depending on the distance and angle
visualization we can display now a set of objects as
being a single billboard placed onto the terrain, in-
stead of having only individual billboards. For this,
we propose then a new method based on collection of
imagens in which an hierarchical structure is used to
deal with different types of objects grouping.
The objects grouping method applied in this work
uses a special data structure based on a quadtree
where each node can store a group of images taken
from different points of view. The final quadtree has
not only individual objects but also groups of objects.
By construction, leaf nodes contain only individual
objects while internal nodes contain representations
of object groups. The set of nodes which have the
same parental node can be represented, in a specific
point of view, by a single image where all nodes ap-
pear together forming a unique group. Consequently,
the collection of graphical objects is represented by
an adaptive hierarchical structure.
OBJECTS VISUALIZATION IN DIGITAL TERRAINS USING ADAPTIVE VIEW-DEPENDENT TECHNIQUES
383

3.5.1 Quadtree Structure
To build the quadtree structure, an hierarchical par-
titioning of the entire terrain domain must be done,
where each cell (or node) represents a group of ob-
jects in a given level.
The subdivision method is done as following: we
start with the root node containing the whole domain
of the terrain. If that node contains more than one ob-
ject, then it must be divided into four equal parts. Oth-
erwise, the subdivision for that node is done. For each
leaf-nodes we associate references to a set of prede-
fined textures containing all views such as front, back,
left, right and top. This must be done for every veg-
etation type used in the visualization. In Figure 8,
we show a very small example where two kinds of
vegetation elements are placed on the terrain. Note
that, from bottom to top, internal nodes’ textures are
built based on their child-nodes. So, groups can be
formed by individual objects, by other groups of ob-
jects or even by a synthetic polygonal objects, in the
case they are available. The process is finished when
a predefined quadtree level is reached where a single
billboard will be hold too many objects. At this point,
the visualization will be compromised and this strat-
egy is no longer applicable.
Figure 8: Object grouping representation using billboards.
Note that having only one element in the leaf-
nodes is not the only possible solution. It is also pos-
sible to have leaf-nodes represent small groups of ob-
jects. In cases where terrains have a very dense veg-
etation, we could set an arbitrary amount of elements
as being the minimum displayed group. Those group
distributions would be based on the local average dis-
tribution that can be computed using basic statistical
methods.
3.5.2 Selecting Representation Level
In order to have the quadtree structure working on a
visualization process, a strategy is required for select-
ing the best representation level to use in a specific
terrain region from the hierarchical billboard collec-
tion structure.
This selection must be based on the projection er-
ror which depends on factors like distance and an-
gle of visualization. A reasonable error metric can
be evaluated as proposed by (Schaufler, 1995) in his
work about dynamic impostors.
Given a point of view, we must evaluate the pro-
jection error metric for each node starting from the
root to the leaf-nodes. If the billboard (with single
or multiple objects) has an error metric less than a
given threshold, then we use that billboard to repre-
sent the whole objects in that region. Otherwise, we
descend a level and repeat the same procedure until
we reach a node in which the error is acceptable. In
the worst case, all individual elements will be ren-
dered and displayed, giving us the worst frame per
second rate. However, in practice, this situation will
only occur in regions close to observer. In the other
ones, a single billboard will appear showing a group
of elements and saving lots of time in rendering many
objects.
An important comparison must be done about the
proposed idea and the impostors technique. Unlike
the impostors technique, here it is not necessary to
recompute the three-dimensional objects’ representa-
tion every time they are considered invalid. The main
idea here is to use the representations with the largest
groups of objects as possible according to the consid-
ered threshold. When this is not possible, the algo-
rithm must descend the quadtree nodes, searching the
first acceptable level of representation.
In order to illustrate how our structure can be used
in the selection of different level of detail, we pre-
pared a very simple prototype using only groups of
one, two or three billboards for a small and constant
bunch of three trees. The results from that prototype
are shown in Figure 9. When the observer is far away
from the given bunch of trees, only one billboard with
three-trees texture is used. For this example, that is
what we call the lowest level of representation. As
the observer comes closer to that bunch, the method
switches into two billboards now using two-trees and
single-tree textures. Then, the selection process con-
tinues until all trees in the example are represented in
different billboards using single-tree textures only. In
that situation, the highest level is now reached.
As seen previously, by grouping objects using the
proposed structure, we can render a larger amount of
GRAPP 2009 - International Conference on Computer Graphics Theory and Applications
384
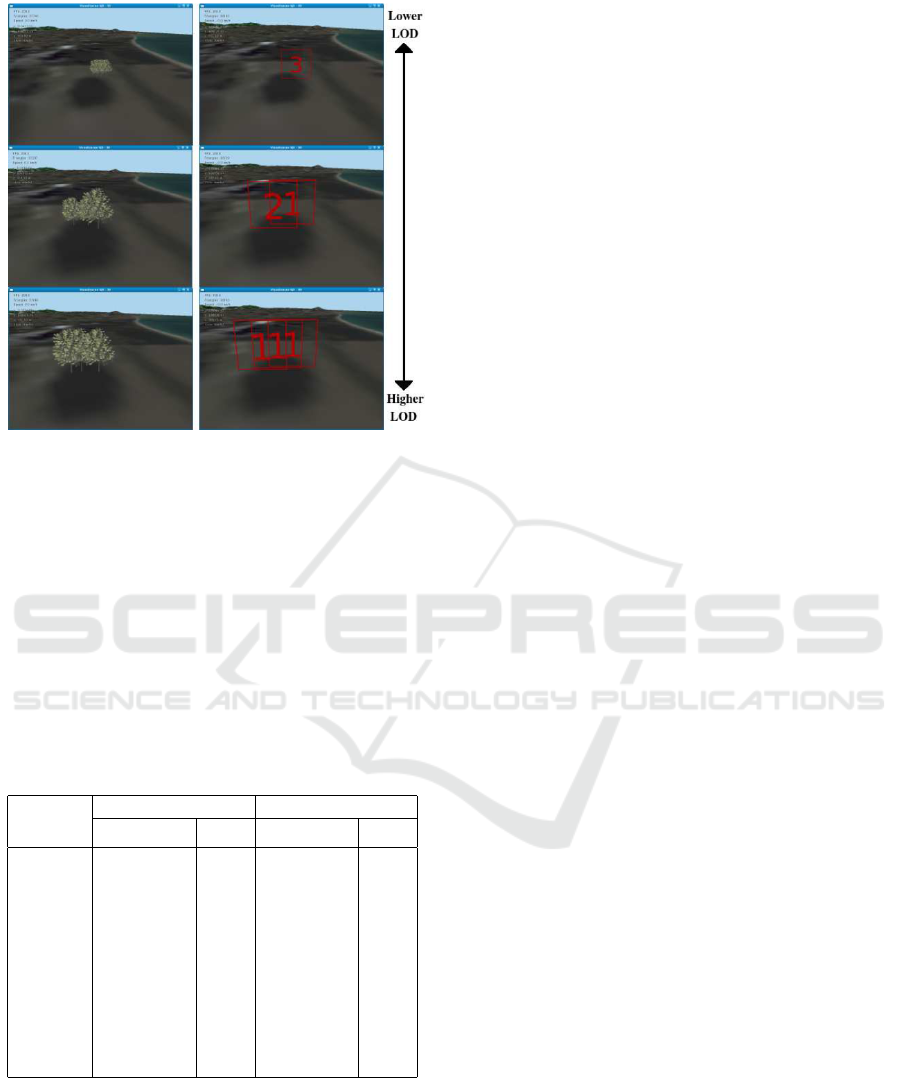
Figure 9: Simple example of representation level using
quadtree.
objects with a less number of physical billboards. As
a consequence, when using such strategy, we expect
to render larger scenes in a more efficient way. To
confirm this statement, we compared the FPS rate in
both strategies (with and without objects grouping).
For test purposes, we used a simple list of objects as
data structure instead of a quadtree when no objects
grouping are used in the visualization process. This
simple structure appears to be useful in our tests and
the performance results can be observed in Table 2.
Table 2: With and without objects grouping.
Objects
List Quadtree
billboards FPS billboards FPS
100 100 85,9 60 90,3
200 200 69,3 125 75,9
300 300 58,5 166 67,6
400 400 50,7 219 60,9
500 500 45,0 266 55,7
600 600 39,9 327 49,4
700 700 36,2 394 45,0
800 800 33,0 479 40,0
900 900 30,3 531 36,9
1000 1000 27,9 641 33,0
4 RESULTS
Every technique presented so far, yields a slight im-
prove in the processing performance. However, the
greatest enhancement arises when all techniques are
combined and applied simultaneously.
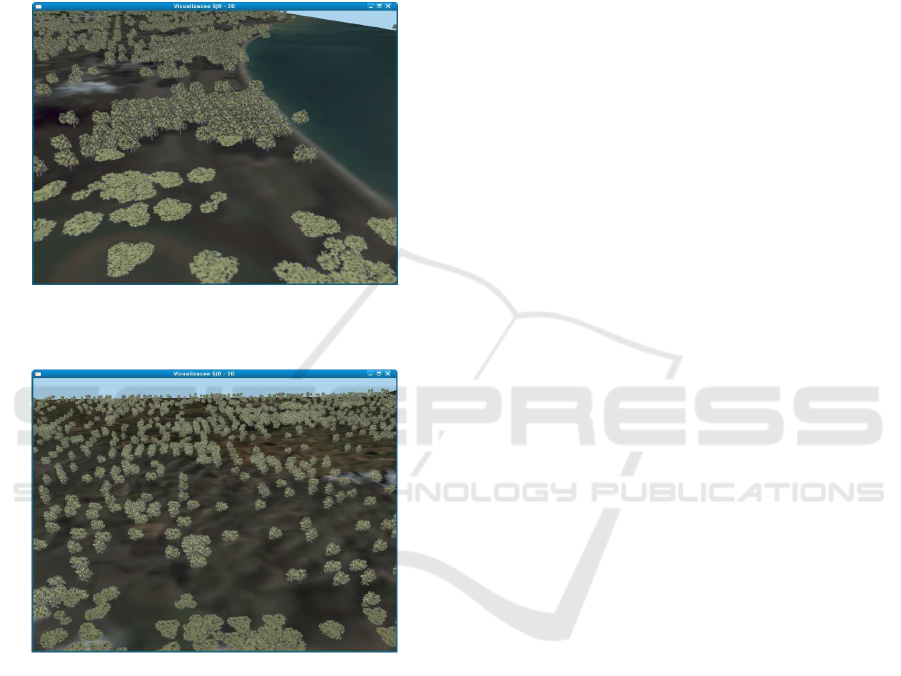
Final results can be observed with a reasonable de-
gree of realism and interactive rates. Figures 10 and
11, at the end of this document, show the final visual-
ization application in two different regions of a given
terrain. Note that the frames per second (FPS) rate ap-
pear in the top left image corner. With no techniques
seen in this paper, the frames per second rates would
be around 0.02 for the same terrain and number of
objects.
An important point is that it is not always possible
to have the perfect equivalence between both strate-
gies. We support the idea that, if the visualization
of the environment involves mainly groups that are
rather distant to the observer, then the designed ap-
proach becomes a very good approximation and vi-
able solution.
5 FUTURE WORKS
As future works, we propose a bunch of improve-
ments that solve some of the problems that appeared
in the presented techniques.
In the current implementation, when a billboard is
beyond a maximum distance, the application stops re-
painting it on every frame and the object disappears
from the terrain. An alternative approach to avoid this
abrupt change consists in using a technique called fad-
ing where imminent billboards would be removed in
a gradual way. Another improvement would consider
new techniques to minimize transitions between bill-
board views. In that case, a three-dimension warp-
ing strategy seems promising. Another interesting
point is to take into consideration non-photo-realistic
rendering techniques which can improve information
perception in the visualization process.
6 CONCLUSIONS
We presented in this work some techniques based
on three-dimension object representation by images
and view-dependent visualization. Those techniques
helped to handle very large terrains with densely dis-
tributed vegetation data . This work is also based on
real data extracted from satellite images.
All presented techniques here are simple but ef-
ficient and have shown us how important is to con-
sider view-dependent strategies in featured terrains,
even with all the advanced hardware resources avail-
able nowadays.
We realized that such work is important not only
considering the direct results but also understanding
OBJECTS VISUALIZATION IN DIGITAL TERRAINS USING ADAPTIVE VIEW-DEPENDENT TECHNIQUES
385
its uses in different contexts. Considering the fact
that we have vegetation information provided from
digital satellites images, this tool could be very use-
ful for helping environment governmental offices and
departments to monitor and control devastation in
some critic regions. Considering military purposes,
we could use this tool as a simulator attending part of
new officials training process.
Figure 10: Final composition with 7357 objects using 1824
physical billboards.
Figure 11: Final composition with 10211 objects using
2479 physical billboards.
ACKNOWLEDGEMENTS
We take this opportunity to thank the staff of both
the Federal Fluminense University and the Institute
of Pure and Applied Mathematics for their kind help
and support in many technological project aspects. A
special thanks for the CNPq and Faperj financial pro-
grammes that made possible this work.
REFERENCES
Akenine-Mller, T. and Haines, E. (1998). Real-Time Ren-
dering. A. K. Peters Ltd., London, 2nd edition.
Chamberlain, B., DeRose, T., Lischinski, D., Salesin, D.,
and Snyder, J. (1996). Faster rendering of complex
environments using a spatial hierarchy. In Proceed-
ings of Graphics Interface.
Dietrich, A., Colditz, C., Deussen, O., and Slusallek, P.
(2005). Realistic and interactive visualization of
high-density plant ecosystems. In EUROGRAPH-
ICS’05, Proceedings of the Eurographics 2005. IN-
STICC Press.
Funkhouser, T. and Squin, C. (1993). Adaptative display
algorithm for interactive frame rates during visualiza-
tion of complex virtual environments. In Computer
Graphics Proceedings.
Jakulin, A. (2000). Interactive vegetation rendering with
slicing and blending. In EUROGRAPHICS’00, Pro-
ceedings of the Eurographics 2000 (Short Presenta-
tions). INSTICC Press.
Lindstrom, P. and Pascucci, V. (2001). Visualization of
large terrains made easy. In Proceedings of the con-
ference on Visualization ’01. IEEE Computer Society.
Lindstrom, P. and Pascucci, V. (2002). Terrain simplifica-
tion simplified: A general framework for view depen-
dent out-of-core visualization. In IEEE Transactions
on Visualization and Computer Graphics. IEEE Edu-
cational Activities Department.
Lluch, J., Camahort, E., and Vivo, R. (2004). An im-
age based multiresolution model for interactive fo-
liage rendering. In WSCG’04, Workshop on Computer
Graphics and Geometric Modelling. UNION Agency
- Science Press.
McMillan, L. (1997). An Image Based Approach to Three
Dimensional Computer Graphics. Ph.d. thesis, Uni-
versity of North Caroline at Chapel Hill.
McReynolds, T. and Blythe, D. (1998). Advanced graphics
programming techniques using opengl. In Proceed-
ings of SIGGRAPH 1998.
Oliveira, M., Bishop, G., and McAllister, D. (2000). Relief
texture mapping. In Proceedings of SIGGRAPH 2000.
Pharr, M. and Fernando, R. (2005). GPU Gems 2: Pro-
gramming Techniques for High-Performance Graph-
ics and General-Purpose Computation. Addison Wes-
ley Professional.
Poyart, E., Frederick, P., Seixas, R. B., and Gattass, M.
(2002). Simple real-time flight over arbitrary-sized
terrains. In Workshop Brasileiro de GeoInformtica.
Savelli, R. and Beauclair, R. (2006). Semi-automatic detec-
tion of vegetations in digital satellite images for build-
ing 3d terrains. In VIIP’06, Sixth Iasted International
Conference on Visualization Imaging and Image Pro-
cessing. INSTICC Press.
Schaufler, G. (1995). Dynamically generated impostors. In
VI Workshop Modeling - Virtual Worlds.
GRAPP 2009 - International Conference on Computer Graphics Theory and Applications
386
