
SIGNIFICANCE OF THE WEIBULL DISTRIBUTION AND ITS
SUB-MODELS IN NATURAL IMAGE STATISTICS
Victoria Yanulevskaya and Jan-Mark Geusebroek
Intelligent Systems Lab Amsterdam, Informatics Institute, University of Amsterdam
Kruislaan 403, Amsterdam, The Netherlands
Keywords:
Natural image statistics, Weibull distribution, Model selection.
Abstract:
The contrast statistics of natural images can be adequately characterized by a two-parameter Weibull distribu-
tion. Here we show how distinct regimes of this Weibull distribution lead to various classes of visual content.
These regimes can be determined using model selection techniques from information theory. We experimen-
tally explore the occurrence of the content classes, as related to the global statistics, local statistics, and to
human attended regions. As such, we explicitly link local image statistics and visual content.
1 INTRODUCTION
While looking at the world around us, we see a wide
variety of images. These images, being a visual pro-
jection of the world on our eye, are not random, but
highly organized and structured. This is reflected
in the statistics of natural images. With natural im-
ages, we mean real-world photos, including both nat-
ural landscapes and man-made environments. Sur-
prisingly, the contrast statistics of such natural im-
ages can be adequately described by a simple model
(Geusebroek & Smeulders, 2003).
Natural image statistics have widely been studied
in the field of image coding (Field, 1987), image com-
pression and image representation (Mallat, 1989), and
more recently, in 3D scene geometry understanding
(Nedovic et al., 2007), visual categorization (Oliva &
Torralba, 2001). Despite its apparent importance, not
many efforts have been undertaken to gain a funda-
mental insight in understanding the cause and signifi-
cance of these statistics.
One of the most important image statistics is the
distribution of contrasts. Mallat (1989) and later Si-
moncelli (1999) propose the generalized Laplacian
distribution as a parameterized model which provides
a good fit to the statistics of natural images. Huang
and Mumford (1999) systematically investigate vari-
ous statistical properties of natural images on a large
calibrated image database (van Hateren, 1998). They
confirm that the statistics involving linear filters can
be modeled by a generalized Laplacian distribution.
Geusebroek and Smeulders (2005) generalize these
findings in showing that the dominant distribution of
texture statistics follows the Weibull distribution. An
overview of statistical modelling of natural images
can be found in Srivastava et al. (2003).
Scholte et al. (2008) examined to which degree
the brain is sensitive to these natural image statistics,
by considering the ERP brain measurements of hu-
man subjects. They found a correlation of 84% and
93% between the Weibull parameters as derived from
images and a simple model of ERP measurements
obtained from the parvo- and magnocellular system.
Given these results, one would expect the Weibull dis-
tribution to play a significant role in image statistics.
The central question we address in this paper is:
In how far can natural image statistics explain visual
content? To address this question, we explore edge
distributions of natural images at the global and local
level. We distinguish four classes of natural images
according to the behavior of the Weibull distribution.
As we will show, each class seems to reflect a specific
type of visual content. Furthermore, we study the oc-
currence of the different classes for human attended
regions.
Novel in our approach is the explicit link between
regional statistics and visual content, as reflected in
the Weibull sub-models. Furthermore, from a human
attention perspective we study the importance of each
sub-model.
The paper is organized as follows. Section 2 in-
troduces the integrated Weibull distribution to cap-
ture the natural image statistics. The maximum like-
lihood estimators of the Weibull parameters are pro-
355
Yanulevskaya V. and Geusebroek J. (2009).
SIGNIFICANCE OF THE WEIBULL DISTRIBUTION AND ITS SUB-MODELS IN NATURAL IMAGE STATISTICS.
In Proceedings of the Fourth International Conference on Computer Vision Theory and Applications, pages 355-362
DOI: 10.5220/0001793203550362
Copyright
c
SciTePress

vided. Furthermore, we distinguish four different sub-
models of the Weibull distribution, and apply infor-
mation theory to differentiate these sub-models. We
present the g-test as a goodness of fit test between the
data and the Weibull distribution. In Section 3 we
explore the occurrence of the different sub-models of
the Weibull distribution on an image data set, and we
link the sub-models to the visual content. We consider
three experiments. We start by analyzing the statistics
of the whole image. Then we zoom in on the local
image statistics. Finally, we explore the statistics of
human attended regions. We wrap up with conclu-
sions in Section 4.
2 IMAGE STATISTICS
The parameterized model which provides a good fit
to the edge distribution of natural images (Geuse-
broek & Smeulders, 2003; Simoncelli, 1999; Huang
& Mumford, 1999) has a probability density function
(pdf) given by,
p(x) =
γ
2γ
1
γ
βΓ(
1
γ
)
exp
−
1
γ
x
β
γ
, (1)
where x is the edge response to the Gaussian deriva-
tive filter, γ > 0 is the shape parameter and β > 0 is the
scale parameter of the distribution. Γ(·) is the com-
plete Gamma function,
Γ(x) =
Z
∞
0
t
x−1
exp
−t
dt. (2)
Through out the paper we will refer to this model
as the two parameter integrated Weibull distribution,
considering its close relationship to the Weibull dis-
tribution (Geusebroek & Smeulders, 2003). The pa-
rameter β denotes the width of the distribution and
the parameter γ represents the peakness of the distri-
bution. The width β reflects the local contrast. A wide
distribution indicates a texture with high contrast. The
shape γ is sensitive to the local edge spatial frequency.
These two parameters catch the structure of the image
texture (Geusebroek & Smeulders, 2005). Figure 1 il-
lustrates the integrated Weibull pdf for some example
images.
The integrated Weibull distribution captures the
behavior of other statistical distributions, mainly be-
ing the power-law, exponential, and gaussian distri-
bution. Our aim is to explore the link between the
Weibull statistics and visual content. Hence, besides
investigating the variation in image content as func-
tion of the Weibull parameters by means of scatter
plots, we will explore visual content by categorizing
these statistical sub-models. To distinguish between
Figure 1: Integrated Weibull PDF’s for different kind of tex-
tures: object-background image (a), images with moderate
contrast content (b), high-frequency texture image (c) and
image with a regular pattern (d).
the different sub-models, we need to know parame-
ters of each model. They can be estimated with the
Maximum Likelihood Estimation (MLE) technique.
After that, we can quantify the various sub distribu-
tions using model selection techniques.
2.1 Maximum Likelihood Estimation
The likelihood function indicates how well a distri-
bution describes the observed data X = x
1
,x
2
,...,x
n
.
The best fit is obtained when model parameters max-
imize the log-likelihood function, in which case their
respective derivatives should equal zero. For the in-
tegrated Weibull distribution given by Eq.(1), the best
fit is obtained when
∂
∂β
lnL
iw
(β,γ|X) = −
1
β
+
1
β
n
∑
i=1
x
i
β
γ
= 0, (3)
and
∂
∂γ
lnL
iw
(β,γ|X) =
1
γ
2
γ − 1 + ψ
1
γ
+
+ln(γ) +
n
∑
i=1
x
i
β
γ
!
−
1
γ
n
∑
i=1
x
i
β
γ
ln
x
i
β
= 0, (4)
where,
ψ(γ) =
d
dγ
lnΓ(γ) =
d
dγ
Γ(γ)
Γ(γ)
(5)
is the digamma function.
The parameter γ is obtained by eliminating β from
Eq. (4):
f (γ,X) = −
1
γ
n
∑
i=1
|
x
i
|
γ
∑
n
i=1
|
x
i
|
γ
ln
|
x
i
|
γ
∑
n
i=1
|
x
i
|
γ
+
1 +
1
γ
ln(γ) +
1
γ
ψ
1
γ
= 0. (6)
VISAPP 2009 - International Conference on Computer Vision Theory and Applications
356

Eq. (6) may be solved using standard iterative pro-
cedures, for example, the Newton-Raphson method:
γ
k+1
= γ
k
−
f (γ
k
)
∂
∂γ
f (γ
k
)
,
∂
∂γ
f (γ,X) =
n
∑
i=1
Λ
∑
n
i=1
x
γ
i
x
γ
i
− n
∑
Λ −
− n
n
∑
i=1
Λln
x
γ
i
n
∑
n
i=1
x
γ
i
, (7)
where
Λ =
∂
∂γ
x
γ
i
∑
n
i=1
x
γ
i
. (8)
The Newton-Raphson algorithm works as shown
in Alg. 1. Thus, the maximum likelihood estimator
ˆ
γ
is the solution of Eq. (6) and then
ˆ
β can be calculated
from Eq. (3), until convergence.
Algorithm 1 Integrated Weibull parameter estima-
tion.
γ = 1 initial value
ε = 0.001 accuracy of the calculations
γ
next
= γ −
f (γ,X)
∂
∂γ
f (γ,X)
while |γ
next
− γ| > ε
γ = γ
next
γ
next
= γ −
f (γ,X)
∂
∂γ
f (γ,X)
return γ
next
.
MLE for parameters of the power law, the expo-
nential, and the Gaussian distribution are well known
and can be easily calculated. Their pdf’s are given by
P(x) =
β
2a
x
a
β−1
, (9)
E(x) =
1
2β
exp
−
x
β
, (10)
G(x) =
1
p
2πβ
exp
−
x
2
2β
2
. (11)
The corresponding maximum likelihood estima-
tions are
ˆ
β
p
=
n
−
∑
n
i=1
log(|
x
i
a
|)
, (12)
ˆ
β
e
=
∑
n
i=1
|x
i
|
n
, (13)
ˆ
β
g
=
∑
n
i=1
(x
i
)
2
n
. (14)
2.2 Model Selection
We use Akaike’s information criterion (AIC) (Akaike,
1973) for appropriate model selection. AIC estimates
expected Kullback-Leibler information, based on the
log-likelihood function at its maximum point. Hence,
we do not need to assume that the ”true model” is in
the set of candidates (Burnham & Anderson, 2004).
AIC for model i is
AIC
i
= −log(L
i
(
ˆ
β
i
|X))+ K
i
, (15)
where L
i
is the likelihood function of the model i,
ˆ
β
i
is the maximum likelihood estimator of the model pa-
rameters based on the assumed model i and the data
X, and K
i
is the number of parameters of the model
i. In our case, parameter
ˆ
β
i
is defined by Eq. (12)-
(14) for each particular model. In the end we have
three AIC values corresponding to the power law, the
exponential, and the Gaussian distribution. The best
model is the one with minimum value AIC
min
. How-
ever, we follow (Burnham & Anderson, 2002) and as-
sign a probability to each model by
w
i
=
exp(−∆
i
/2)
Σ
R
r=1
exp(−∆
r
/2)
, (16)
where
∆
i
= AIC
i
− AIC
min
(17)
and R is the number of models, R = 3 in our case. The
w
i
are called Akaike weights and are interpreted as a
probability that model i fits the data X best over the
considered set of models.
2.3 g-Test
Sometimes none of the considered models represents
the data appropriately. Thus, it should be tested how
well the integrated Weibull distribution fits the data.
The g-test is the log-likelihood equivalent of the chi-
squared test, given by:
g = 2
k
∑
j=1
O
j
log
O
j
E
j
, (18)
where O
j
is the number of observed values x
i
in bin
j of the histogram of the data X. Furthermore, E
j
is
a number of expected values in the same bin j under
the fitted distribution. The hypothesis that the distri-
bution is of a given form is accepted if the calculated
test statistic g is less than an appropriate critical value.
The g-test can be applied with the same critical values
as the chi-squared test. In this paper we use a criti-
cal value which corresponds to a significance level of
α = 0.05 and 100 degrees of freedom (g < 77.929)
(Filliben, 2002).
SIGNIFICANCE OF THE WEIBULL DISTRIBUTION AND ITS SUB-MODELS IN NATURAL IMAGE STATISTICS
357
2.4 The Four Regimes of the Integrated
Weibull Distribution
We can now distinguish four types of natural images
according to the behavior of the integrated Weibull
distribution. When the integrated Weibull distribution
fits the data well, its sub-models define the first three
types, being: the power law, the exponential or the
Gaussian. The fourth type of natural images occurs
when the integrated Weibull distribution does not de-
scribe the data well. Our aim is to assign one particu-
lar type to a (sub-)image.
3 EXPERIMENTS
To illustrate the different regimes of the integrated
Weibull distribution, we analyze a data set contain-
ing 107 natural images of size 800x540 pixels. These
images are selected from three categories of National
Geographic wallpapers
1
: animals, landscapes, and
people. We are interested in the intensity edge dis-
tribution and its sub-models according to the four
regimes of the integrated Weibull distribution. To ob-
tain the intensity edge distribution, we do not use the
standard edge filters, e.g. Sobel style, instead we ap-
ply the Gaussian derivative filter (σ = 1) and steer
it in the gradient direction. Then we consider a his-
togram (101 bins) of the responses, and fit the inte-
grated Weibull distribution to this histogram. Finally,
we select the appropriate sub-model using Akaike’s
information criterion.
3.1 Global Image Statistic Analysis
We start by analyzing the presence of the various in-
tegrated Weibull sub-models in the statistics of the
whole image. We extract edges and study their dis-
tribution globally for each image from the data set.
The results are shown in Table 1.
Table 1: Four regimes of the integrated Weibull distribution
for global image analysis.
Int. Weibull Not Int. Weibull
100% 0%
Power Law Exp. Gauss. -
20% 78% 2% -
All images fit well to the integrated Weibull distri-
bution according to the g-test (α = 0.05). Power law
distribution is chosen as an appropriate sub-model for
1
http://www.nationalgeographic.com/
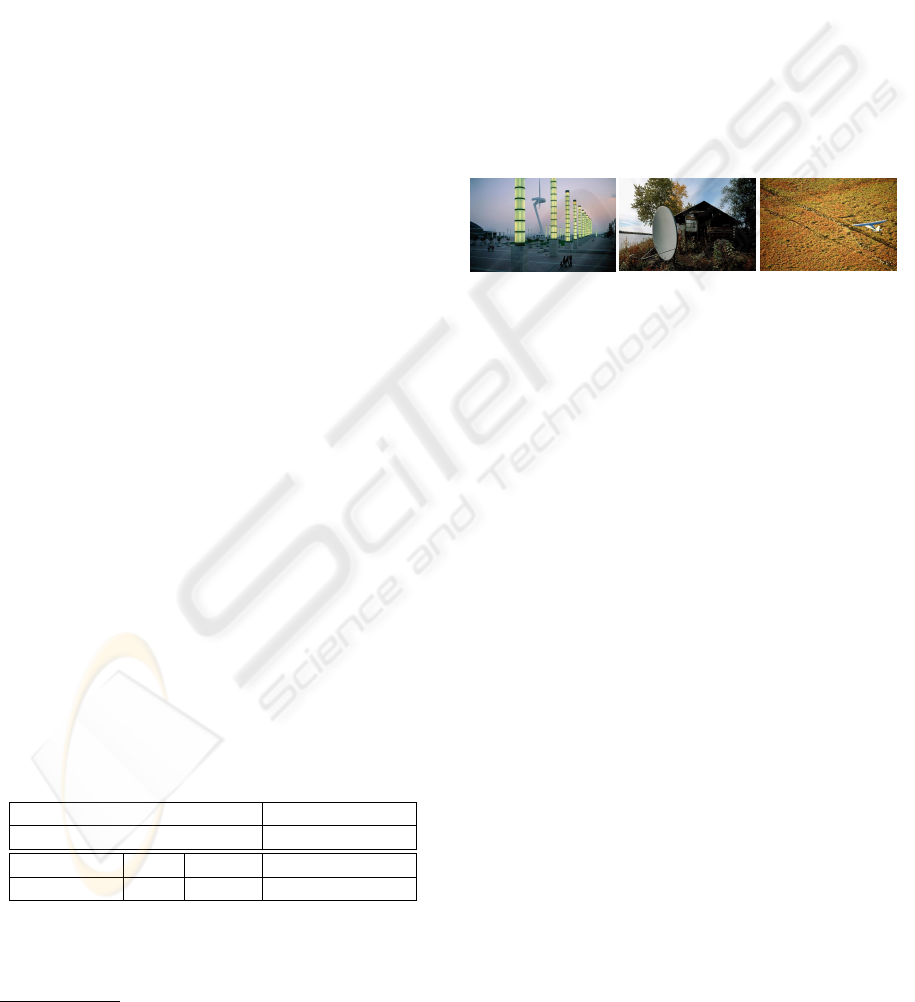
20% of the images. These images have well separated
foreground and uniform background regions, see Fig-
ure 2(a). Only 2% of the images are Gaussian dis-
tributed, these are images which contain mostly high-
frequency texture, illustrated in Figure 2(c). Most of
the images (78%) follow the exponential distribution,
which refers to moderate contrast contents. These im-
ages usually contain a lot of details at different scales,
see Figure 2(b).
Figure 3 gives an overview of the occurrence of
each sub-model in the entire image collection. Each
of the sub-models indicates different image content.
Images with strong object-background contrasts are
close to the power law behavior. Images with mod-
erate contrast tend to follow the exponential distribu-
tion. High-frequency texture images are described by
the Gaussian distribution.
(a)
(b) (c)
Figure 2: Typical images for three sub-models of the inte-
grated Weibull distribution. Figure (a) corresponds to the
power law sub-model, (b) and (c) show, respectively, exam-
ples for the exponential and the Gaussian sub-models.
3.2 Local Image Statistic Analysis
Edge distributions of natural images follow the in-
tegrated Weibull when looking at global statistics
as shown above. More important, the various sub-
models of the integrated Weibull distribution seem to
reflect visual content. One would expect this effect
to be even stronger when considering local patches,
as local visual content is more coherent. Therefore,
for the local analysis, we divide images into rectan-
gular patches (60x60 pixels) and consider the edge
histogram and model selection over these patches.
Results are presented in Table 2. For experimen-
tal setup reasons (see below), we consider a subset
of 49 images, however, results for the whole data set
are similar (data not shown). Comparing these re-
sults with the global analysis (Table 1), local patches
do not always follow the integrated Weibull distribu-
tion according to the g-test (α = 0.05). For one, re-
gions without edges are dominated by compression
artifacts and may not follow the integrated Weibull
distribution. Furthermore, in many cases, patches are
composed of a few parts, each following a different
sub-model. Thus, each part seems to conform the
integrated Weibull distribution, but all together they
do not follow one of the sub-models. In the global
VISAPP 2009 - International Conference on Computer Vision Theory and Applications
358

Figure 3: Scatter plot of integrated Weibull parameters β
and γ with each image positioned at its respective (β,γ) val-
ues. The horizontal axis represents the value of the β param-
eter, indicating contrast. The vertical axis represents value
of the γ parameter (between 0 and 3). A red frame indicates
the image is fitted by the power law distribution. Images
with blue frames follow the exponential distribution. Yel-
low framed images are described with the Gaussian distri-
bution.
analysis, we have the same situation, where images
are composed of many parts due to objects and clut-
ter. However, the resulting distribution of the whole
image combines into the exponential distribution due
to the large amount of parts (Burghouts et al., 2007).
This explains the smaller portion of local patches de-
scribed with the exponential sub-model in compari-
son with the global analysis.
Table 2: Four regimes of the integrated Weibull distribution
for local region analysis.
Int. Weibull Not int. Weibull
87% 13%
Power Law Exp. Gauss. -
26% 47% 14% -
The Gaussian sub-model occurs more often at lo-
cal scale. The Gaussian distribution describes uni-
form regions of high-frequency textures. Images con-
taining only high-frequency textures are rather rare in
a photo stock. However, uniform textured regions do
occur in images, and local analysis reflects this. Com-
paring the results for the power law sub-model, the
model behaves relatively similar at the global and lo-
cal levels.
Figure 4 illustrates how the patch’s visual content
is reflected by the integrated Weibull sub-models. The
figure represents a scatter plot of integrated Weibull
parameters β and γ with each patch positioned at its
respective (β,γ) value. The power law sub-model
is concentrated at the bottom which corresponds to
small γ values (γ < 1). This sub-model is linked to
the patches containing uniform regions separated by
strong edges, but are not very detailed, as shown in
the inset. The exponential sub-model spans a wide
range of γ values, starting within the power law sub-
model, and ending at the lower regions of the Gaus-
sian sub-model. This sub-model corresponds to γ val-
ues around 1 and describes more detailed patches.
The Gaussian sub-model ends up at the top of the
figure, where the γ parameter is close to 2. High-
frequency with high contrast patches are reflected in
the Gaussian sub-model, as well as smoothed patches
with Gaussian noise.
3.3 Attention based Analysis of Local
Image Statistics
Visual content is closely connected to human atten-
tion while observing the world around us. Our vi-
sual system samples the environment not randomly,
but is driven by visual stimuli, like variations in con-
trast or color (Baddeley & Tatler, 2006; Itti et al.,
1998; Mante et al., 2005; Reinagel & Zador, 1999).
We are interested in the occurrence of various sub-
models of the integrated Weibull distribution in the
statistics of local regions attended by humans. To
obtain the ground truth attended regions, human eye
fixations were recorded for the subset of 49 images.
Eighteen subjects participated in the experiment, they
were shown each image for 5 seconds. For each fix-
ation point we consider a fovea-sized patch (60x60
pixels). Again the local edge distribution analysis is
applied for each fixated patch.
Based on the results shown in Table 3, we can con-
clude that attended regions differ from arbitrary se-
lected local regions (Table 2). People tend to look to
strong edges, which are power law distributed, in our
results 33% for attended regions compared to 26% for
arbitrary regions, respectively.
Gaussian distributed patches occur more rare in at-
tended regions in comparison with arbitrary regions,
7% versus 14%. The examples of Gaussian regions in
Figure 4 (in yellow frames) show two types of Gaus-
sian distributed patches. As one can notice, smooth
patches with gaussian-like noise on the top left are
not informative, thus, people generally do not fixate
on such kind of regions. Instead, people look to de-
SIGNIFICANCE OF THE WEIBULL DISTRIBUTION AND ITS SUB-MODELS IN NATURAL IMAGE STATISTICS
359
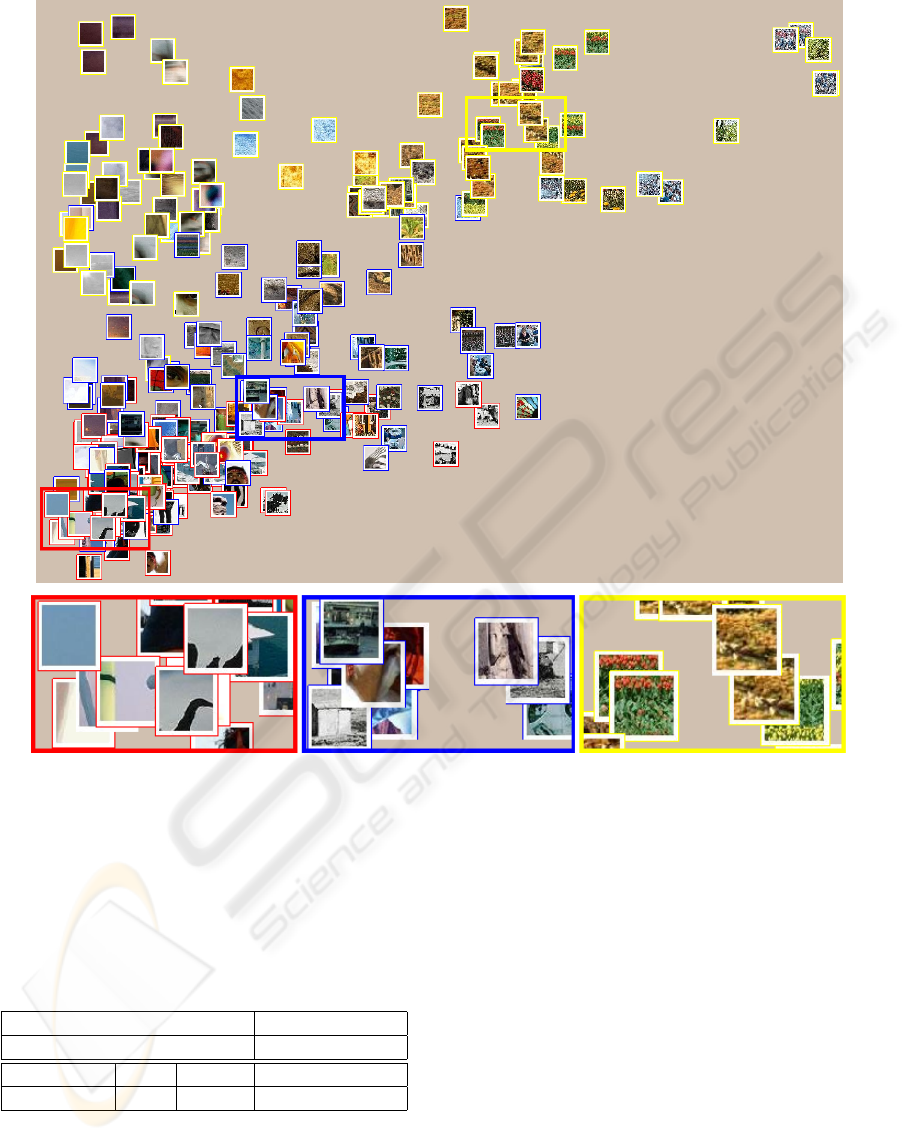
Figure 4: Scatter plot of integrated Weibull parameters β and γ with each patch positioned at its respective (β,γ) value. Again,
the horizontal axis represents value of the β parameter, and the vertical axis represents value of the γ parameter (between
0 and 3). Red framed patches correspond to the power law sub-model. These patches contain uniform regions separated
by strong edges, but are not very detailed, see the inset on the bottom left. Patches with blue frames follow the exponential
distribution. Clearly they are showing more small scale details, as illustrated by the inset in the middle. Yellow framed patches
are Gaussian distributed, there we observe two types of visual content. On the top right, high-frequency with high contrast
patches are gathered, enlarged version is in the bottom right inset. On the top left, there are smooth patches with gaussian-like
noise.
Table 3: Four regimes of the integrated Weibull distribution
for attended region analysis.
Int. Weibull Not int. Weibull
95% 5%
Power Law Exp. Gauss. -
33% 55% 7% -
tailed regions, which follow the exponential distribu-
tion. In our attention based analysis, the exponential
sub-model is present in 55% of the results (Table 3),
whereas this is only for 47% the case when consid-
ering arbitrary regions (Table 2). Regions which do
not follow the integrated Weibull distribution accord-
ing to the g-test, are less present in attended regions
than in arbitrary regions, 5% versus 13%. This is may
be due to the portion of regions without edge content
as discussed previously.
Figure 5 illustrates the occurrence of different
regimes of the integrated Weibull distribution with su-
perimposed human gaze directions. As can be seen
from the Figure, subjects seldom look to the Gaus-
sian distributed regions, but prefer areas which follow
the power law and the exponential distributions.
As discussed in Section 2, the integrated Weibull
parameter β reflects the local contrast. From literature
it is known that contrast plays an important role in
VISAPP 2009 - International Conference on Computer Vision Theory and Applications
360
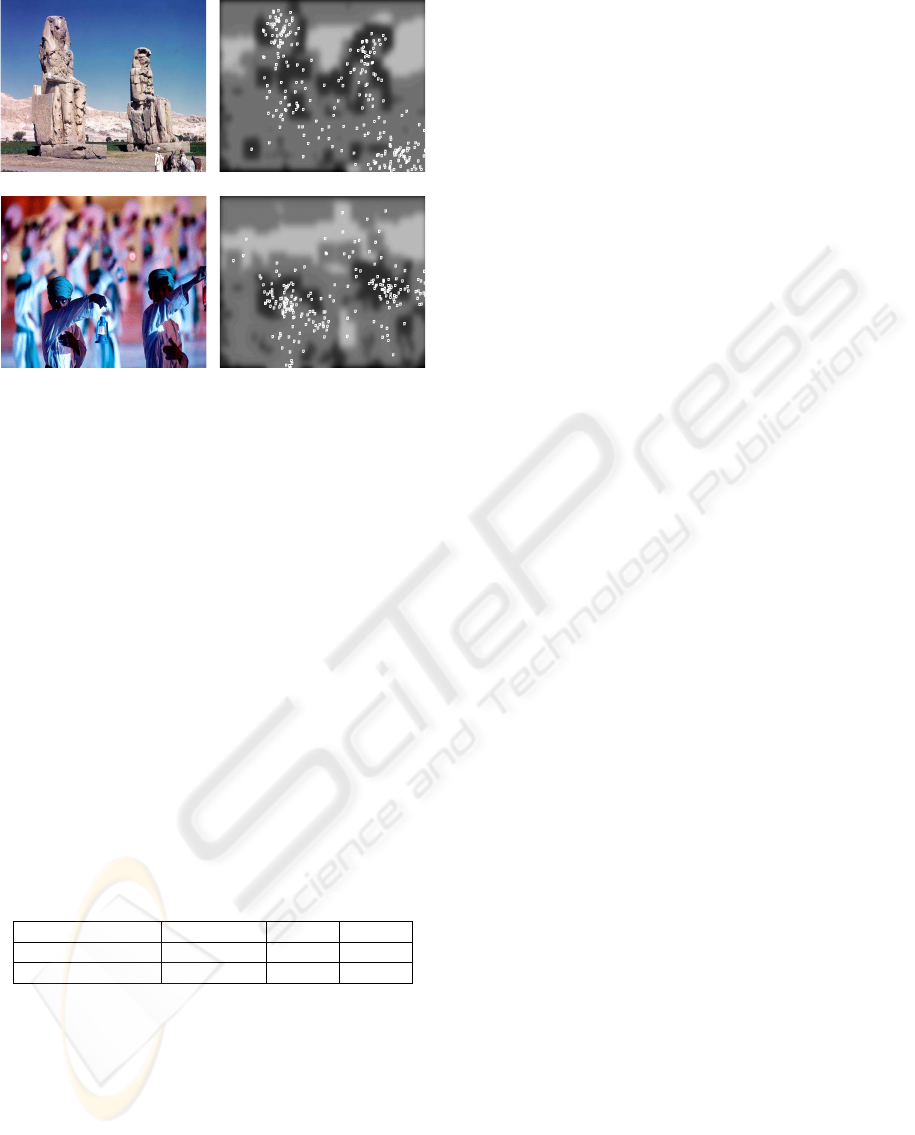
Figure 5: Visualization of the integrated Weibull sub-
models with superposed human gaze directions. On the
left two example images. On the right a visualization
of the local model selection and the eye-tracking experi-
ment. The black areas correspond to patches with power
law sub-model, dark and light grey areas correspond to
patches with the exponential and Gaussian sub-models, re-
spectively. White small squares depict the human fixation
points.
human eye fixations (Reinagel & Zador, 1999; Bad-
deley & Tatler, 2006). Table 3 illustrates the mean
values of the parameter β within each sub-model for
arbitrary regions versus attended regions. The t-test
shows that the local contrast captured by β is signif-
icantly higher (p < 10
−10
for each sub-model) in av-
erage for attended regions than for arbitrary regions.
Therefore, our experiments reproduce the tendency of
people to look at higher contrast regions. The results
identify both contrast and edge frequency reflected in
the integrated Weibull parameters and its sub-models
might be cues for human attention.
Table 4: Mean integrated Weibull β parameter.
Power Law Exp. Gauss.
Arbitrary regions 0.0090 0.0149 0.0249
Attended regions 0.0119 0.0189 0.0287
4 CONCLUSIONS
In this paper, we have explored the link between vi-
sual content and natural image statistics modelled by
the integrated Weibull distribution. We have given
four different regimes with respect to the integrated
Weibull distribution: power-law, exponential, Gaus-
sian, and the case when the integrated Weibull distri-
bution is not appropriate. With model selection tech-
niques from information theory, we can determine the
probability for every sub-model to explain the statis-
tical properties of the regions. Our results show that
natural image statistics explain a lot of visual content.
Each sub-model reflects a specific type of visual con-
tent, at the global (see Figure 3), and at the local level
(see Figure 4).
At the global level, all images from our collection
follow the integrated Weibull distribution, see Table 1.
Most of the images, around 80%, are exponentially
distributed. The rest is mainly power law distributed,
the Gaussian distribution being rare. In the local anal-
ysis we have considered the statistics of arbitrary and
attended regions, see Tables 2 and 3, respectively. We
have shown that the occurrence of the various sub-
models in human attended versus arbitrary regions is
significantly different. This might indicate a role of
the Weibull sub-models in human attention.
In future work, we plan to address salient re-
gion detection algorithms based on these local image
statistics. Furthermore, recent studies show natural
image statistics play an important role in 3D scene
perception (Pelli & Tillman, 2008). We plan to further
exploit the various Weibull sub-models in condensed
representations of 3D scenes.
REFERENCES
Akaike, H. (1973). Information Theory and an Extension
of the Maximum Likelihood Principle. Int. Sympos.
Inform. Theory (pp. 267–281).
Baddeley, R. J. & Tatler, B. W. (2006). High frequency
edges (but not contrast) predict where we fixate: A
Bayesian system identification analysis. Vision Res.,
46(18), 2824–2833.
Burghouts, G. J., Smeulders, A. W. M. & Geusebroek, J. M.
(2007). The distribution family of similarity distances.
In NIPS.
Burnham, K. P. & Anderson, D. R. (2002). Model selection
and multimodel inference: A Practical Information-
Theoretic Approach. Springer.
Burnham, K. P. & Anderson, D. R. (2004). Multimodel In-
ference: Understanding AIC and BIC in Model Selec-
tion. Sociological Methods & Research, 33(2), 261.
Field, D. J. (1987). Relations between the statistics of natu-
ral images and the response properties of cortical cells.
J. Opt. Soc. Am., 4, 2370–2393.
Filliben, J. J. (2002). NIST/SEMATECH
e-Handbook of Statistical Methods.
http://www.itl.nist.gov/div898/handbook/. NIST,
Gaithersburg.
Geusebroek, J. M. & Smeulders, A. W. M. (2003). Frag-
mentation in the vision of scenes. In ICCV.
SIGNIFICANCE OF THE WEIBULL DISTRIBUTION AND ITS SUB-MODELS IN NATURAL IMAGE STATISTICS
361

Geusebroek, J. M. & Smeulders, A. W. M. (2005). A six-
stimulus theory for stochastic texture. Int. J. Comput.
Vision, 62(1), 7–16.
van Hateren, J. H. (1998). Independent component filters of
natural images compared with simple cells in primary
visual cortex. Biological Sciences, 265(1394), 359–
366.
Huang, J. & Mumford, D. (1999). Statistics of natural im-
ages and models.
Itti, L., Koch, C. & Niebur, E. (1998). A model of saliency-
based visual attention for rapid scene analysis. Trans.
Pattern Anal. Machine Intell., 20(11), 1254–1259.
Mallat, S. G. (1989). A theory for multiresolution signal
decomposition: the wavelet representation. Pattern
Anal. Machine Intell., 11(7), 674–693.
Mante, V., Frazor, R. A., Bonin, V., Geisler, W. S. & Caran-
dini, M. (2005). Independence of luminance and con-
trast in natural scenes and in the early visual system.
Nature Neurosci., 8(12), 1690–7.
Nedovic, V., Smeulders, A. W. M., Redert, A. & Geuse-
broek, J. M. (2007). Depth information by stage clas-
sification. In ICCV.
Oliva, A. & Torralba, A. (2001). Modeling the shape of
the scene: A holistic representation of the spatial en-
velope. Int. J. Comput. Vision, 42(3), 145–175.
Pelli, D. G. & Tillman, K. A. (2008). The uncrowded win-
dow of object recognition. Nature Neurosc. (p. to ap-
pear in october).
Reinagel, P. & Zador, A. (1999). Natural scene statistics at
the centre of gaze. Network: Comput. Neural Syst.,
10(4), 341–350.
Scholte, H. S., Ghebreab, S., Smeulders, A. W. M. &
Lamme, V. (2008). The parvo and magno-cellular sys-
tems encode natural image statistics parameters. J. Vi-
sion, 8(6), 686a.
Simoncelli, E. P. (1999). Modeling the joint statistics of
images in the wavelet domain. Volume 3813 (pp. 188–
195).
Srivastava, A., Lee, A. B., Simoncelli, E. P. & Zhu, S. C.
(2003). On Advances in Statistical Modeling of Nat-
ural Images. J. Math. Imaging Vision, 18(1), 17–33.
VISAPP 2009 - International Conference on Computer Vision Theory and Applications
362
