
RECONSTRUCTION OF HYPERSPECTRAL IMAGE BASED ON
REGRESSION ANALYSIS
Optimum Regression Model and Channel Selection
Yuji Sakatoku, Jay Arre Toque and Ari Ide-Ektessabi
Advanced Imaging Technology Laboratory, Graduate School of Engineering, Kyoto University
Yoshida-honmachi, Sakyoku, 606-8501, Kyoto, Japan
Keywords: Multispectral imaging, Hyperspectral image, Spectral reflectance, Regression analysis, AIC, Cultural
heritage.
Abstract: The purpose of this study is to develop an efficient appraoch for producing hyperspectral images by using
reconstructed spectral reflectance from multispectral images. In this study, an indirect reconstruction based
on regression analysis was employed because of its stability to noise and its practicality. In this approach
however, the regression model selection and channel selection when acquiring the multispectral images play
important roles, which consequently affects the efficiency and accuracy of reconstruction. The optimum
regression model and channel selection were investigated using the Akaike information criterion (AIC). By
comparing the model based on the AIC model based on the pseudoinverse method (the pseudinverse method
is a widely used reconstruction technique), RMSE could be reduced by fifty percent. In addition, it was
shown that AIC-based model has good stability to noise.
1 INTRODUCTION
Hyperspectral imaging technology, which records
detailed spectral reflectance of each pixel of a digital
image, is continuously attracting increasing attention.
It has a wide range of applications in various fields
such as remote sensing, medicine, archiving of
cultural heritage, and others (Y. Miyake et.al, 2005;
P. Cotte et.al, 2005).
There are two ways to obtain a hyperspectral
image. One is to measure the spectral reflectance
directly on every point of an image.(Pezzati L. et.al,
2006) The other is to reconstruct it from the image
with lower dimensional spectral information, such as
RGB image or multispectral image (Berns R. S. et.al,
1996).
A considerable number of studies have been
conducted on the second approach, especially in the
field of archiving of cultural heritage (i.e. from
multispectral image). This is done in order to
minimize the radiation on the target and record the
image in high resolution (Konig, 1999; Shimano,
2007). There is strict restriction in the amount of
radiation on the cultural heritage, therefore the
development of an efficient multispectral image
acquisition system and a mathematical approach that
requires fewer channels and therefore enables
reconstruction of more accurate spectral reflectance
is imperative.
Several methods are used to reconstruct spectral
reflectance from multispectral image namely, direct
reconstruction, indirect reconstruction, and
interpolation reconstruction. Direct reconstruction is
based on a transfer function that is obtained from the
spectral characteristics of the image acquisition
system such as spectral radiance of the light source
and spectral sensitivity of the sensor. Theoretically,
this approach enables the user obtain the most
accurate results. However, this procedure is complex
and unstable because of the difficulty in measuring
the necessary spectral characteristics of the system
accurately. Indirect reconstruction is based on a
transfer function obtained from the spectral
information and the multispectral image of a
learning sample using statistical analysis. Once the
spectral reflectance of the learning sample is
measured accurately, this approach is the most
practical. Finally, interpolation reconstruction only
focuses on the sensor response and requires only a
white reference, but this approach requires more
spectral channels compared to the other methods.
The final goal of this study is to apply
hyperspectral imaging technology into digital
50
Sakatoku Y., Toque J. and Ide-Ektessabi A. (2009).
RECONSTRUCTION OF HYPERSPECTRAL IMAGE BASED ON REGRESSION ANALYSIS - Optimum Regression Model and Channel Selection .
In Proceedings of the First International Conference on Computer Imaging Theory and Applications, pages 50-55
DOI: 10.5220/0001791800500055
Copyright
c
SciTePress

archiving of cultural heritage with corresponding
material analysis. For this purpose, the image
acquisition system should be stable and safe for the
target. In this study, the indirect method was
selected since it is the most practical approach
especially in the analysis of cultural heritage.
Regression analysis was used in obtaining the
transfer functions. The target used was a color chart
made of pigments commonly used in classical
Japanese painted arts.
There has been no study that tried to investigate
the optimum regression model for a spectral
reflectance reconstruction. Adopting Akaike’s
information criterion (AIC) as the criterion of model
selection, the optimum regression model was
investigated. In addition, a new statistical approach
for determining the number of channels and
selecting the optimum combination were also
explored.
2 LINEAR TRANSFER MODEL
FOR RECONSTRUCTION OF
SPECTRAL REFLECTANCE
2.1 General Model to Reconstruct
Spectral Reflectance
The relationship between the response of the camera
sensor from each channel which is defined as the
sensor which has certain spectral sensitivity band,
and spectral reflectance of the target is generally
expressed as
eCp +=
∫
λλλλ
d)()()( rL (1)
where p is an M
×
1 vector consisting of the
response from the M-channel sensor, C(λ) is an M
× 1 vector of spectral sensitivity of the sensor, L(λ)
is the spectral radiance of the illumination, r(λ) is
the spectral reflectance of the target, and e is an M
× 1 additive noise vector. For mathematical
convenience, equation (1) can be expressed with a
vector space notation as follows:
eCLrp += (2)
where C is an M
× N matrix of spectral sensitivity
of the sensor, L is an N × N diagonal matrix of
spectral radiance of the illumination, and r is an N
×
1 spectral reflectance vector of the target. This
expression shows that there is a linear relationship
between the sensor response and spectral reflectance
of the target. Therefore the transfer function from
the sensor response to the spectral reflectance can be
expressed as a matrix. Indirect reconstruction
approach is required for solving this inverse problem.
2.2 Regression Model for Spectral
Reflectance Reconstruction
There are several methods available in obtaining the
transfer function for indirect reconstruction. In this
paper a method for constructing the optimum
regression model is proposed. Furthermore the result
is compared with the pseudoinverse method (R. S.
Bern, 2005), which is a widely used approach, in
order to reconstruct the spectral reflectance based on
regression analysis. In the new approach suggested,,
Akaike’s information criterion was adopted as the
criterion of model selection and this method is
described as “AIC-based method”.
2.2.1 Model based on Pseudoinverse Method
Let p
i
be a sensor response vector that is obtained
from the ith learning sample in learning chart with
known spectral reflectance r
i
. Let P be an M
×
k
matrix and let R be an N
×
k matrix as following.
[
]
[]
k
k
rrrR
pppP
L
L
21
21
=
=
(3)
Then the transfer function matrix W is determined to
minimize
WPR −
. The matrix W is given by
(
)
−
+
==
tt
PPRPRPW (4)
where P
+
is the pseudoinverse matrix of P. By
applying a matrix W to a sensor response vector,
spectral reflectance of the target is reconstructed as
follows:
Wpr
=
ˆ
(5)
2.2.2 Model based on AIC
In the pseudoinverse model, responses of every
channel are used to reconstruct the reflectance at
each wavelength, though some of them should have
almost no information at that wavelength. In this
case, the sensor responses which have no
information will act as noise and the model will
generally become unstable. In order to solve this
problem, optimum regression model is constructed
in following approach.
First, the following linear multiple regression
model is assumed.
RECONSTRUCTION OF HYPERSPECTRAL IMAGE BASED ON REGRESSION ANALYSIS - Optimum Regression
Model and Channel Selection
51
epr
kki
+=
∑
β
(6)
where r
i
is the reflectance at ith wavelength, p
k
is the
sensor response of kth channel, and e is a constant.
β
k
which minimizes
ii
rr −
ˆ
is to be obtained by
multiple regression analysis.
Next, in order to determine whether the kth
explaining variable should be added or removed
from the model, the model should be evaluated
based on adequate criterion. In this paper, AIC was
adopted for model selection.
In the evaluation of multiple regression models,
AIC is described as follows,
() ()()
12ln22ln AIC
e
++++
⎟
⎠
⎞
⎜
⎝
⎛
=
π
nk
n
S
n
(7)
where n is the number of data, S
e
is the residual sum
of squares, and k is the number of explaining
variables. The model which minimize AIC should be
selected. Omitting the constant terms in Equation 7,
Equation 7 can be simplified as following.
k
n
S
n 2ln AIC
e
+
⎟
⎠
⎞
⎜
⎝
⎛
= (8)
Given that number of channel is m, the number of
possible models is 2
m
. In this paper after optimum
channel selection, which is described in next
subsection, AIC was calculated for all possible
models and the model with the minimum AIC was
selected for every wavelength.
2.2.3 Optimum Channel Selection
In order to reconstruct the spectral reflectance
accurately, the channels that have high sensitivity at
a given wavelength should be selected (Hardeberg,
2003). Based on this idea, the correlation coefficient
R
2
between reflectance at a wavelength and sensor
response is adopted as the selection criterion. The
channel with the highest R
2
value was selected for
each wavelength. By taking the R
2
values into
account, the channel which has low AIC was
removed to minimize the number of channels.
3 EXPERIMENTAL PROCEDURE
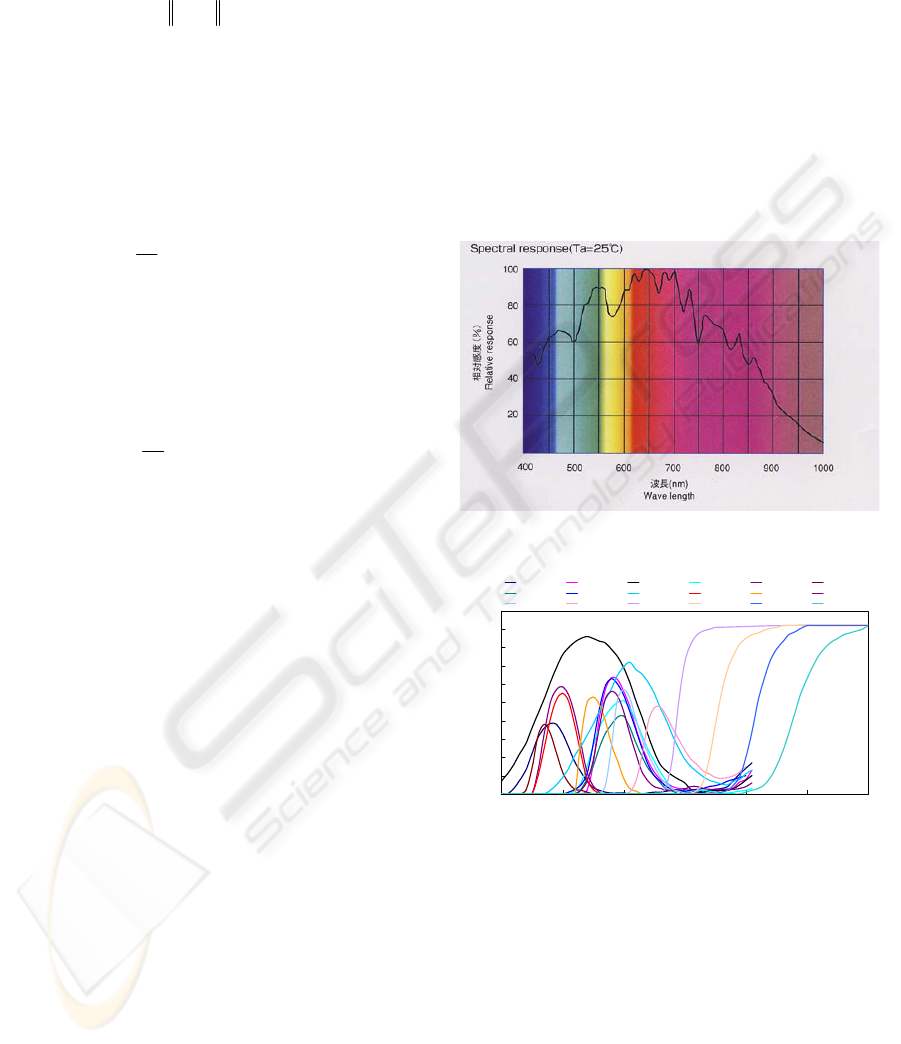
3.1 Image Acquisition
Multispectral images were obtained using a
multispectral imaging scanner developed in Kyoto
University. This scanner was designed especially for
scanning of cultural assets. It consists of a
monochromatic line CMOS camera unit, a flat-bed
frame structure and an illumination unit, which
focuses the illumination at the region of interest
using a cylindrical lens. A mixed light source a
metal halide lamp and a halogen lamp was used as
illumination. The spectral sensitivity of the line
CMOS camera is shown in Figure 1. A total of 18
filters, which determine the spectral characteristics
of each channel, were used to acquire the images.
The transmittance of these filters is shown in Figure
2. All 18 multispectral images were taken at a
resolution of 600dpi (an approximate pixel size of
40 μm).
Figure 1: Spectral sensitivity of line CMOS camera.
0
10
20
30
40
50
60
70
80
90
100
350 450 550 650 750 850 950
Wavelength [nm]
Transmittance [%]
SP1 SP2 SP5 SP7 SP9 BPN42
SP10 SP15 SP18 BPB45 BPB50 BPB53
BPB55 BPB60 SC64 SC70 IR76 IR82
Figure 2: Transmittance of filters.
A learning chart consisting of major pigments
and colorants used in Japanese classic paintings was
developed and employed for experiments (shown in
Figure 3). They are derived from natural mineral
pigments, dyes (organic compounds that are
originated from plants), artificial mineral pigments,
and metal powders. In this paper our interest is
limited in the visible and near infrared (NIR) region;
therefore the spectral reflectance of the pigment
chart was measured from 400 nm to 850 nm.
IMAGAPP 2009 - International Conference on Imaging Theory and Applications
52
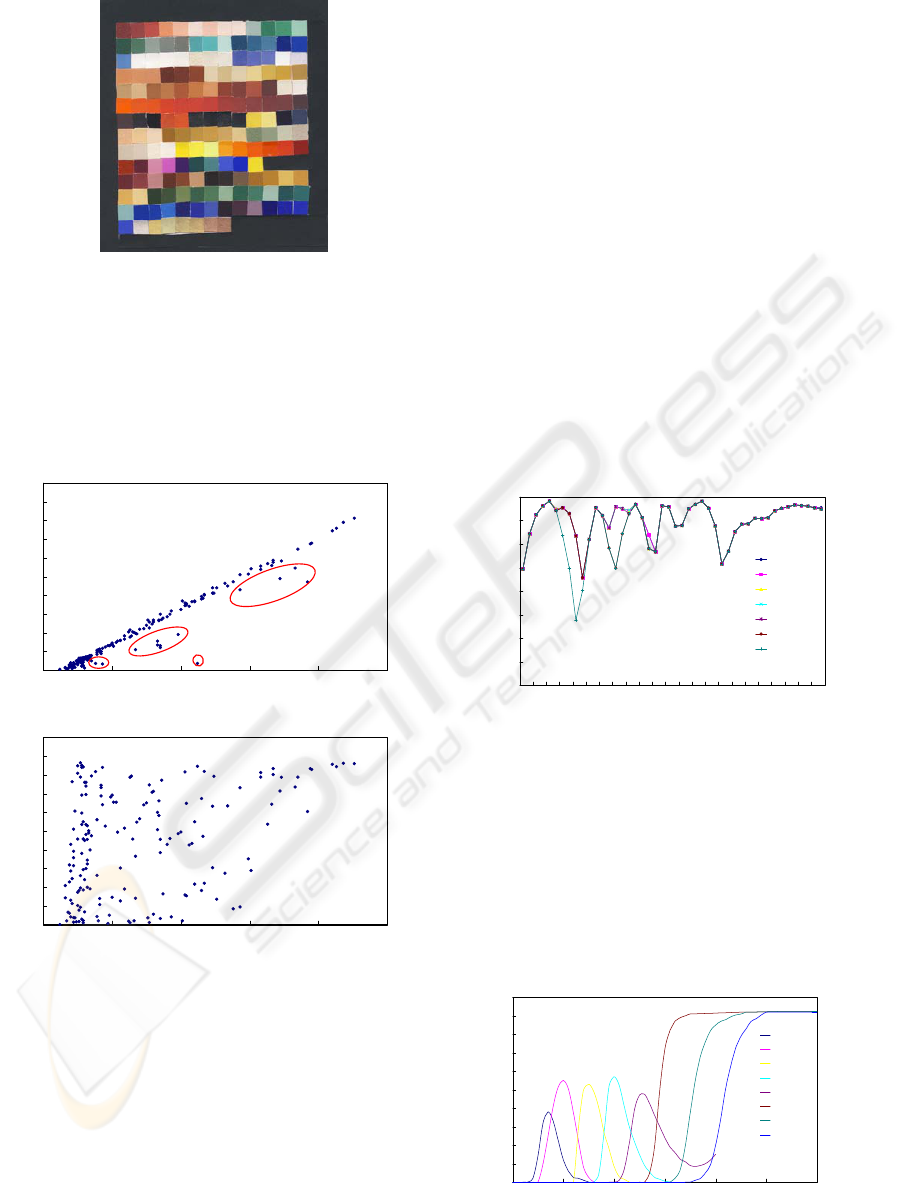
Figure 3: Pigment chart consisting of major Japanese
pigments used in classical art works.
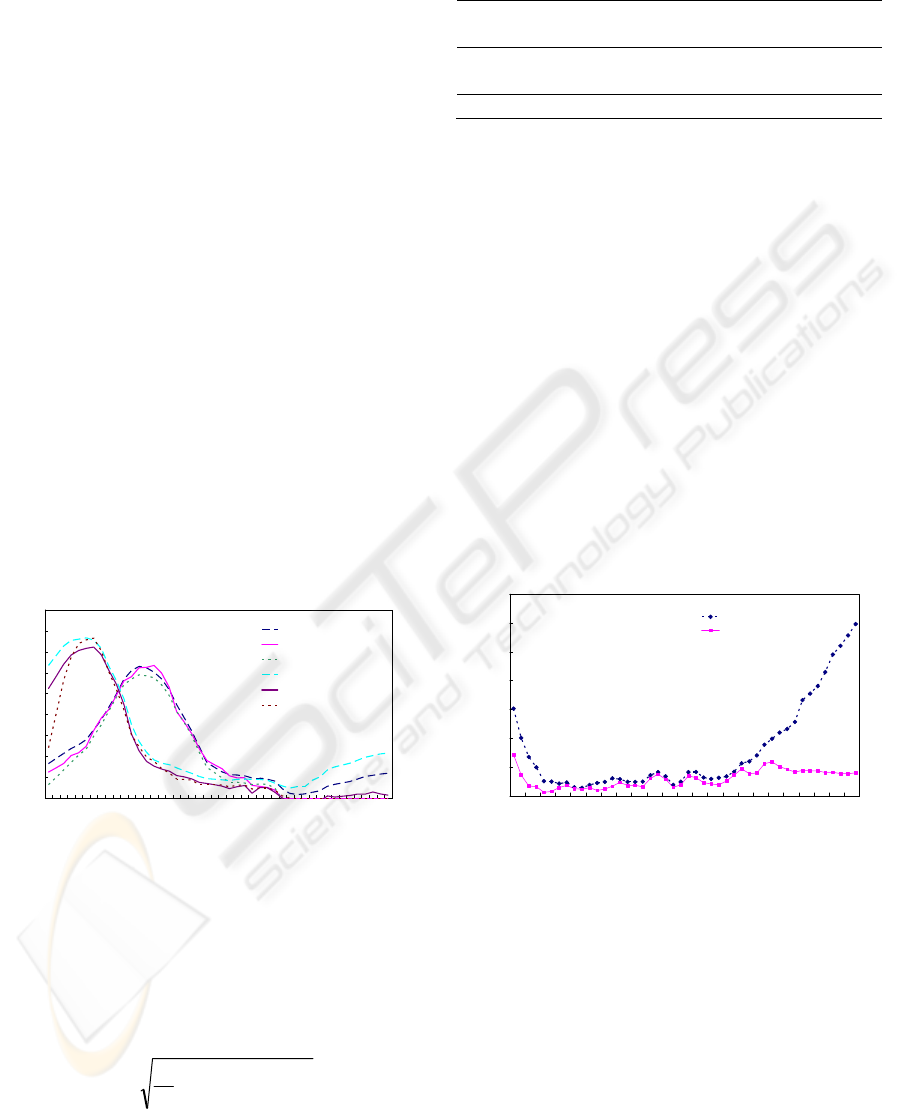
3.2 Test of Linear Regression Model
In order to test the adequacy of the linear regression
model, a scatter chart of sensor response from a
channel and reflectance on the pigment chart was
created. A representative chart is shown in Figure 4.
0
0.1
0.2
0.3
0.4
0.5
0.6
0.7
0.8
0.9
1
0 50 100 150 200 250
Sensor response of the channel used BPN42 [a.u.]
reflectance
0
0.1
0.2
0.3
0.4
0.5
0.6
0.7
0.8
0.9
1
0 50 100 150 200 250
Sensor response of the channel used BPN42 [a.u.]
reflectance
Figure 4: Scatter chart of sensor response of the channel
which used BPN42 filter and reflectance (a) Reflectance at
440 nm. The data points that deviated from linear
correlation are circled. (b) Reflectance at 700 nm.
Figure 4(a) shows the linear correlation between the
sensor response and reflectance in the range when
the channel has enough sensitivity. On the other
hand, Figure 4(b) shows no correlation between
sensor response and reflectance, which is due to the
lack of useful information transmitted to the channel.
In Figure 4(a), there are several data points, which
deviated from the linear correlation. These data
points originated from the glossy pigment, such as
metal powder, and this phenomenon can be
attributed to strong specular reflections. In order to
stabilize the regression model, these data point was
removed from the data for subsequent analysis.
3.3 Channel selection
First, single regression analysis was conducted and
the correlation coefficient between the sensor
response and reflectance was calculated for each
wavelength. In the next step the channel with the
highest correlation coefficient was selected as the
most informative channel for regression model at
that wavelength. At this stage 13 channels were
selected. In order to minimize the number of
channels, the channels with low AIC values were
removed and the changes in the correlation
coefficient were carefully monitored. This process is
shown in Figure 5.
0.84
0.86
0.88
0.9
0.92
0.94
0.96
0.98
1
400 nm 500 nm 600 nm 700 nm 800 nm
Wavelength [nm]
R2
13 filters
12 filters
11 filters
10 filters
9 filters
8 filters
7 filters
Figure 5: Shift of correlation coefficient.
The number of channels was reduced gradually
from a total of 13 channels until there were only
seven channels. However, when there were only 7
channels, the correlation coefficient dropped
drastically especially between 450-500nm.
Therefore 8 channels were selected following the
selection criteria. The transmittance of the filters
used for the selected channel is shown in Figure 6.
0
10
20
30
40
50
60
70
80
90
100
350 450 550 650 750 850 950
Wavelength [nm]
Transmittance
BPN42
BPB45
BPB50
BPB55
BPB60
SC64
SC70
IR76
Figure 6: Transmittance of selected filter.
RECONSTRUCTION OF HYPERSPECTRAL IMAGE BASED ON REGRESSION ANALYSIS - Optimum Regression
Model and Channel Selection
53
3.4 Model Construction
The transfer function was calculated based on both
the AIC-based method and the pseudoinverse
method using the channels selected in the previous
section. However, when employing the AIC-based
method, it is sometimes enough to obtain the
necessary information for reconstruction using fewer
channels (i.e. 4-5 channels on the average). This
condition is dependent on the sensitivity of the
channel as a function of wavelength.
4 RESULTS AND DISCUSSION
In this section, the result of spectral reflectance
reconstruction is discussed in detail.
First, the result of spectral reflectance
reconstruction of malachite and azurite is shown in
Figure 7 as representatives. It shows that the spectral
reflectance of malachite is reconstructed accurately
using both methods. On the other hand,
reconstructed spectral reflectance of azurite has
quite a large error especially when using the
pseudoinverse method. These results indicate that
the reconstruction using PIM is unstable in some
cases.
0
0.05
0.1
0.15
0.2
0.25
0.3
0.35
0.4
0.45
400
4
30
4
60
49
0
520
5
50
580
6
10
6
40
670
7
00
730
7
60
7
90
8
20
850
Wavelength [nm]
Reflectance
Malacite (PIM)
Malacite (AIC)
Malacite (Measured)
Azurite (PIM)
Azurite (AIC)
Azurite (Measured)
Figure 7: Representative result of spectral reflectance
reconstruction.
Next, the root mean square error (RMSE) between
the measured spectral reflectance and reconstructed
spectral reflectance was derived in order to evaluate
the accuracy of the reconstruction. RMSE is
calculated as follows,
()()
t
N
RRRR
ˆˆ
1
RMSE −⋅−=
(9)
where N is the number of data. The result is shown
in Table 1.
Table 1: Comparison between pseudoinverse method and
AIC-based method.
RMSE Maximum
error
Pseudoinverse
method
0.0317 0.1424
AIC-based method 0.0196 0.1155
This result shows that model based on AIC is a
more accurate model for spectral reflectance
reconstruction based on to the calculated error.
A comparison of the residual sum of squares in
the wavelength region is shown in Figure 8. In this
figure, every square error between measured spectral
reflectance and reconstructed spectral reflectance
was summed up. This result shows that the model
based on pseudoinverse method has relatively large
errors in the near infrared region. This phenomenon
might be due to the S/N ratio of sensor response in
NIR region. In NIR region, the sensitivity of the
sensor is quite low so the S/N ratio of the sensor
response was expected to be lower. This resulted to
an upward shift of the residual noise in the NIR
region. This was further aggravated because the
Pseudoinverse does not have a constant term. Given
that this hypothesis is correct, the result implies that
AIC-based method is relatively more stable.
0
0.1
0.2
0.3
0.4
0.5
0.6
0.7
400 450 500 550 600 650 700 750 800 850
Wavelength [nm]
Se
Pseudinverse model
AIC based model
Figure 8: Residual sum of squares in wavelength region.
Finally, the spectral reflectance of glossy
samples removed from the dataset for model
construction was reconstructed. A representative
result is shown in Figure 9. The result shows that
neither the pseudoinverse method nor the AIC
method are able to reconstruct the spectral
reflectance of the glossy sample accurately. The
spectral reflectance of the glossy sample is strongly
dependent on the illuminance and measuring
condition due to specular reflection. In order to solve
this problem, the conditions in measuring the
spectral reflectance and capturing the multispectral
images should be accounted for.
IMAGAPP 2009 - International Conference on Imaging Theory and Applications
54

0
0.1
0.2
0.3
0.4
0.5
0.6
0.7
0.8
0.9
400 450 500 550 600 650 700 750 800 850
Wavelength [nm]
Reflectance
Gold powder (PIM)
Gold powder (AIC)
Gold powder (Measured)
Figure 9: Spectral reflectance reconstruction of glossy
target.
5 SUMMARY AND
CONCLUSIONS
In this study the optimum regression model and
channel selection for hyperspectral image
reconstruction from multispectral image was
investigated. Adopting Akaike’s information
criterion (AIC) as the selection model, the optimum
regression model was explored. In addition, a new
statistical approach for determining the number of
channels and selecting the best combination of
channels was presented.
The optimum regression model was successfully
constructed based on AIC. AIC-based method was
evaluated by comparing it with pseudoinverse
method which is a widely used technique for
spectral reflectance reconstruction from
multispectral images. The results show that the
model based on AIC is more accurate than the model
based on pseudoinverse method and indicate that the
AIC-based method is stable even with noise.
The results also show that it is quite difficult to
reconstruct the spectral reflectance of a target with
strong specular reflection. This is due to the lighting
condition and measuring condition. In order to
obtain the hyperspectral image of glossy samples,
further investigation on the image acquisition system
and the mathematical approach of spectral
reflectance reconstruction is required.
ACKNOWLEDGEMENTS
This work has been done as part of the project “An
Integrated System for Secure and Dynamic Display
of Cultural Heritage” sponsored by Japan Science
and Technology Agency, Regional Resources
Development Program. This collaborative project
was organized by Kyoto University Graduate School
of Engineering, S-tennine Kyoto (Ltd) and Kyushu
National Museum. The Authors would like to
express their thanks to Imazu Setsuo of Kyushu
National Museum and other staff of the museum and
to Oshima Yasushi of S-tennine Kyoto and his group
for supporting this work.
REFERENCES
Hardeberg, J. Y., 2003, Filter Selection for Multispectral
Color Image Acquisition, PICS Conference, VA 2003,
pp.177-181
Ukishima M., Nakaguchi T., Kato K., Fukuchi Y.,
Tsumura N., Matsumoto K., Yanagawa N., Morita H.,
Miyake Y., 2005, An Evaluation of Sharpness in
Different Image of an Internal Organ, The 13
th
Color
Imaging Conference, (CIC13), pp.261-263
Carcagni P., Della Patria A., Fontana R., Greco M.,
Mastroianni M., Materazzi M., Pampaloni E., Pezzati
L., 2006, Multispectral imaging of paintings by optical
scanning, Optics and Lasers in Engineering 45,
pp.360-367
Burns P. D. and Berns R. S., 1996, Analysis of
multispectral image capture, Proceedings of the
Fourth Color Imaging Conference, pp.19-22
Farrell J. E., Cupitt J., Saunders D., and Wandell B. A.,
1999, Estimating spectral reflectances of digital
images of art, International Symposium of
Multispectral Imaging and Color Reproduction for
Digital Archives, pp. 58-64
Shimano N., Terai K., Hironaga M., 2007, Recovery of
spectral reflectances of objects being imaged by
multispectral camera, Optical Society of America, 24,
pp.3211-3219
Cotte P., Dupraz D., 2006, Spectral imaging of Leonardo
Da Vinci’s Mona Lisa: A true color smile without the
influence of aged varnish, CGIV Final Program and
Proceedings
Zhao Y., Taplin L. A., Nezamabadi. M, Bern R. S. , 2005,
Using the matrix R method for spectral image archives,
Proceedings of the 10
th
Congress of the International
Colour Association, pp.469-472
RECONSTRUCTION OF HYPERSPECTRAL IMAGE BASED ON REGRESSION ANALYSIS - Optimum Regression
Model and Channel Selection
55
