
MODELING AND RENDERING THE GROWTH OF
SPELEOTHEMS IN REAL-TIME
Daniel Menin Tortelli and Marcelo Walter
Federal University of Pernambuco, Recife, Brazil
Keywords:
Caves, Stalactite, Stalagmite, Real-time graphics, Modeling of natural scenes and phenomena.
Abstract:
Among the many natural phenomena already studied in computer graphics research, the interior of caves
remains largely unexplored. We present in this paper a plausible approach, based on Geological studies, for
modeling the genesis and growth of speleothems. Speleothems are mineral depositions formed in caves, such
as stalactites, stalagmites and columns. Our approach takes advantage of the new geometry shader, present
in the new generation of GPUs, and can generate in a controlled way, a large variety of cave scenes, with
meaningful geological parameters.
1 INTRODUCTION
In Computer Graphics as a research field, researchers
have always been attracted to reproduce the beauty
of Nature and the intrinsic complexity in many sev-
eral phenomena, such as rain simulation (Rousseau
et al., 2006), illumination models and shading for
clouds (Bouthors et al., 2006), fire simulation (Min
and Metaxas, 2007), among many more phenomena.
Since the initial efforts in this subject (Blinn et al.,
1983), it was obvious that the simulation of natural
phenomena is scientifically a great challenge, because
it potentially deals with a great volume of data and a
high computational demand, if all the mathematical
and physical complexity of the real models are taken
into consideration. Nature is able to create many com-
plex details. One example of this complexity is the
genesis and growth of speleothems such as stalac-
tites and stalagmites, found in the interior of lime-
stone caves. Among the many natural phenomena al-
ready studied in computer graphics research, the inte-
rior of caves remains largely unexplored. We present
in this paper a plausible approach, based on Geolog-
ical studies, for modeling the genesis and growth of
speleothems. Speleothems are mineral depositions
formed in caves, such as stalactites, stalagmites and
columns. Our approach takes advantage of the new
geometry shader, present in the new generation of
GPUs, for growth of speleothems in realtime using
meaningful geological parameters.
2 RELATED WORK
The great variety and beauty of speleothems struc-
tures has been a source of curiosity and a mystery
for hundreds or even thousands of years. Scientific
studies in such different areas as Physics, Chemistry,
Mathematics, and Geology, try to explain the origin
and growth of these speleothems. In (Short et al.,
2005b), Short and colleagues describe the process of
stalactite growth as a free-boundary problem, analyz-
ing the dynamics of the responsible fluids for its for-
mation. In (Short et al., 2005a), the same group pre-
sented the first free-boundary approach to the axisym-
metric growth of stalactites. They derived a law of
motion in which the local growth rate depends on the
radius and inclination of the stalactite’s surface. This
law holds under a set of limiting assumptions valid for
typical stalactite growth conditions. Numerical stud-
ies of this surface dynamics showed the existence of
an attractor in the space of shapes, toward which sta-
lactites will be drawn regardless of initial conditions.
Another work by the same group (Short et al., 2006),
describes the stalactite genesis and growth, with pa-
rameters similar to the ones described in (Short et al.,
2005b), specific for ice stalactites, known as icicles.
In this approach, the shape of the icicles also depends
on the initial parameters and of their future intera-
tions.
In (Szilder and Lozowski, 1995), a discreet three-
dimensional model was developed using a mathemat-
ical model of Random-Walk to simulate the growth
27
Menin Tortelli D. and Walter M. (2009).
MODELING AND RENDERING THE GROWTH OF SPELEOTHEMS IN REAL-TIME.
In Proceedings of the Fourth International Conference on Computer Graphics Theory and Applications, pages 27-35
DOI: 10.5220/0001787200270035
Copyright
c
SciTePress
of icicles. That model is based on a series of parame-
ters supplied in the beginning of the simulation. The
values of those parameters vary with time along the
simulation, and they affect the shape of the stalac-
tite model directly. The water flow along the icicle’s
surface is divided into fluid elements which follow a
stochastic path towards the icicle tip. During its mo-
tion, a fluid element may freeze on the icicle’s lateral
surface or at its tip. The fluid elements may also drip
from the icicle tip.
In a rare example of computer graphics research in
this topic, a pioneering work by Yang and Ouhyoung
used fractal theory to model stalactites and stalag-
mites (Ouhyoung and Yang, 1993; Yang and Ouhy-
oung, 1992). To model the peculiar irregular shape of
speleothems, they used recursive and random subdivi-
sion on an initial simple geometric model. They also
used radiosity techniques (Sillion and Puech, 1994)
for illumination of the scene. They emphasize that
stalagmites are more difficult to model because of
their much higher complexity. Therefore instead of
using fractal subdivision, they simulated these follow-
ing the natural process of erosion and accumulation.
In the results section we compare our results with one
of these papers ((Yang and Ouhyoung, 1992)) since
we did not have access to the other one. Finally, in
a paper about an intuitive painting interface for mak-
ing local deformations to 3D surfaces (Lawrence and
Funkhouser, 2004), the authors illustrate one possi-
ble result with a cave environment with stalactites and
stalagmites.
3 GEOLOGICAL BACKGROUND
According to (Lino, 2001), speleothems are mineral
depositions formed in caves, basically by chemical
processes of dissolution and precipitation. This char-
acteristic gives them a character of great permanence,
and which may even be structural. The most common
speleothems are stalactites, stalagmites and columns.
3.1 How the Speleothems Grow
In order to penetrate into the fractures of the lime-
stone rock, the rainwater, acidulated by atmospheric
and soil carbon-dioxide (CO2), dissolves it and car-
ries off the calcium carbonate until it finally emerges
on the roof of the cave. The drop of water suspended
on the roof of the cave is exposed to environmental
conditions, such as greater ventilation, alterations in
temperature, pH, and CO2 pressure. These environ-
mental conditions create chemical instability through
the liberation of the CO2 into the cave and the conse-
quent precipitation of part of the dissolved carbonate.
The drop of water hangs on the roof until it reaches
the volume and weight necessary to overcome surface
tension and fall. Hanging on the roof of the cave and
exposed to environmental conditions of the interior’s
cave, the surface of the drop develops the first crys-
tals of calcite; these, organizing themselves during
the period in which the drop is still in contact with
the roof, form an initial crystalline ring which will
serve as a base for a future stalactite. Drop by drop, a
hollow tubular stalactite grows in a downward direc-
tion. The drop, when it at last falls, carries with it a
solution of carbonate which slowly forms a sucession
of layers on the floor immediately below, and which
becomes a stalagmite. The opposing growth of stalac-
tites and stalagmites might finally result in the union
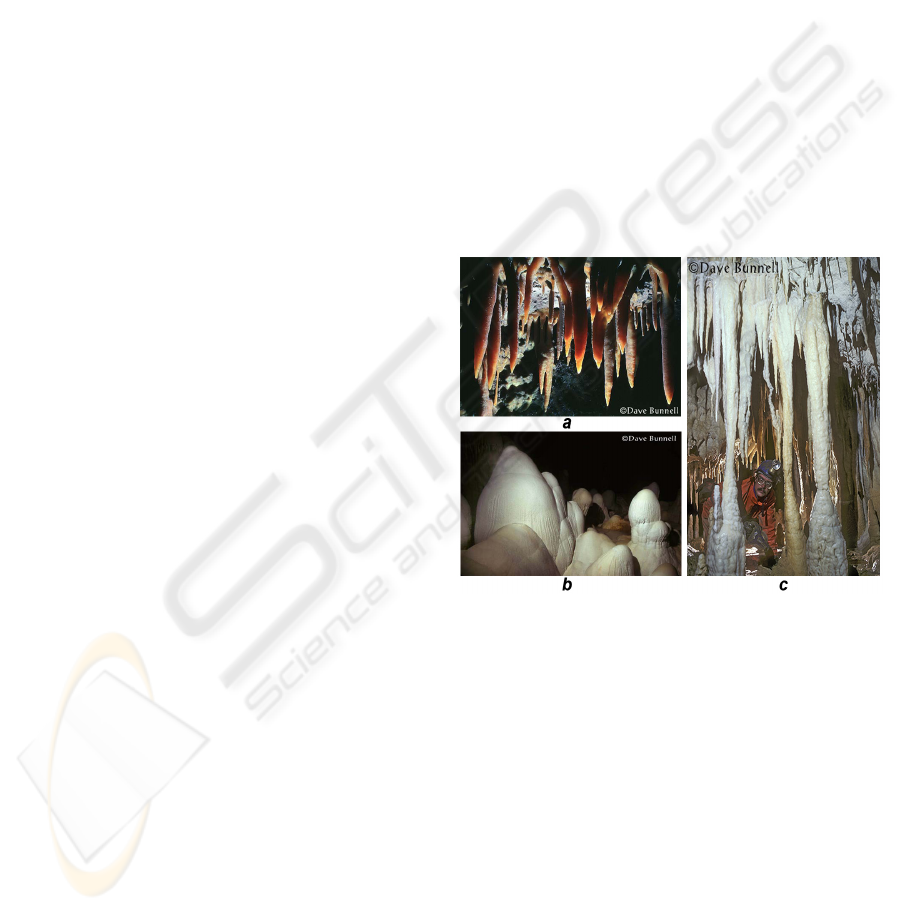
of the two, to form a column. Figure 1(a) and (b) show
examples of stalactites and stalagmites, respectively,
whereas (c) illustrates a column, formed by the union
of a stalactite with a stalagmite.
Figure 1: Real Speleothems: (a) Stalactites - (b) Stalagmites
- (c) Columns.
3.2 Speleothems Growth Stages
Still according to (Lino, 2001), the process of forma-
tion of the speleothems is divided into three different
stages (Figure 2). Each one of these stages have deter-
minant variables that interfere somehow in the shape,
dimensions, coloration and texture of the speleothems
formed through the mechanism of calcite precipita-
tion.
Water Acidulation Stage. In the first stage, we
have to consider the external environment located
above of the interior of the limestone cave. The plu-
viometric index, rain periodicity, soil vegetal cover-
age, average temperature, and the chemistry compo-
GRAPP 2009 - International Conference on Computer Graphics Theory and Applications
28

Figure 2: Speleothems growth stages.
sition of the soil, among other less important factors,
will influence the generated spheleotems. A bigger
volume and regularity of the rain, determines an in-
crease in the flow rate of acidulated water that reachs
the cave roof. The drops remain a short time sus-
pended in the cave roof, just to be quickly replaced by
others. Thus, a little quantity of carbonate will be de-
posited in the cave roof. In other words, considering a
reasonable saturation level, the stalactites in this place
will be small or even not present, and the stalagmites
will have a fast growth and/or voluminous shape. On
the other hand, if the water volume decreases, the ten-
dency is that the stalactites are larger than the stalag-
mites. Also, if there aren’t enough amount and regu-
larity of rain, neither one of the speleothems will be
formed or they will have their growth interrupted until
satisfactory rain values are reached.
Limestone Dissolution Stage. In the second stage,
we consider the thickness of the rocky layer, degree
of purity, crack level, and solubility. This proper-
ties will conditionate the saturation level of the so-
lution, the access channels to the cave, and the kind
of minerals that will be dissolved and blended with
the saturated solution, thus defining the characteristic
of the speleothem that will be formed. The degree of
purity of the rocky layer, for example, can influence
directly the coloring of the speleothems. In general,
speleothems have a white coloration due to their cal-
careous nature. However, the presence of others min-
erals such as iron, copper, manganese and malachite,
when blended with the solution, add a characteristic
pigmentation to the speleothem.
Mineral Deposition Stage. In the third stage, fac-
tors related to the interior of cave will define the typol-
ogy of the speleothems. The first aspect to consider is
the morphology and dimensions of the underground
space - planar or inclined roof, abyss, great saloons,
floor under water, etc. For example, to achieve the
cave, if a drip of saturated solution does not find a
propitious environment for which there is the dripping
(interior space), the process of growing is interrupted.
The second aspect to consider is the interrelation be-
tween the internal cave environment and the exter-
nal cave environment. This interrelation implicates in
larger or smaller water and air circulation. Thus, reg-
ularity and perpendicularity of the speleothems, such
as stalactites, can be modified due to circulation of air
coming from the external environment between the
corridors of the cave. Such circulation causes a de-
formation in the normal growth form of the stalactite,
changing its direction, not only vertically, but also
horizontally.
A better understanding of the concepts of forma-
tion of caves and speleothems in general, can be found
in (Lino, 2001; Kaufmann, 2003; Self and Hill,
2003).
4 OUR MODEL
This section details how our model was developed
and implemented. Since it is a simple model of the
growth of speleothems, we used approximations to
the real physical-chemical processes previously de-
scribed. The goal of this model was to make an
approximation of the geometric shape and appear-
ance of speleothems, using the capabilities of the new
pipeline architecture of the Direct3D 10 (Blythe,
2006; Boyd, 2007). Primarily, a exploration of the
new capabilities of two pipeline stages: Geometry-
Shader (GS) and Stream-Output (SO). The GS stage
processes entire primitives. Its input is a full primitive
(three vertices for a triangle, two vertices for a line, or
a single vertex for a point). In addition, each primitive
can also include the vertex data for any edge-adjacent
primitives. This could include at most an additional
three vertices for a triangle or an additional two ver-
tices for a line. The GS also supports limited geome-
try amplification and de-amplification. Given an input
primitive, the Geometry Shader can discard the prim-
itive, or emit one or more new primitives. The SO
stage is designed for streaming primitive data from
the pipeline to memory on its way to the rasterizer.
Data can be streamed out and/or passed into the ras-
terizer. Data streamed out to memory can be recircu-
lated back into the pipeline as input data or read-back
from the CPU.
MODELING AND RENDERING THE GROWTH OF SPELEOTHEMS IN REAL-TIME
29

4.1 Shape of the Speleothem
When it starts, the application sends to the graphics
pipeline a primitive similar to a thin hollow cylinder
illustrated in Figure 3. Such primitive will be the ba-
sis for the creation of all speleothems in the simula-
tion. This primitive approximates the real initial cal-
cite crystalline ring.
Figure 3: Base Primitive (cylinder).
Besides the basic properties of each vertex, such
as position, normal vector, and texture coordinates,
we included an ID for each vertex of the base prim-
itive. These IDs will be a key element in the defini-
tion of the shapes of the speleothems, and are used
to create the new primitives in the geometry-shader
stage, as we explain below. Once inside the pipeline,
the vertices pass through the vertex-shader stage and
reach the geometry-shader stage. Once there, the ver-
tices of the base will be used as information for cre-
ation of the new primitives. These primitives will
form the body of the speleothem. First, all the IDs of
the vertices of the primitive which are entering in this
stage will be increased by two. Figure 4 shows, re-
spectively, the vertices of the base primitive when en-
tering the geometry-shader stage and, later, with their
incremented IDs.
Figure 4: IDs increment.
After increasing the IDs, a new primitive is cre-
ated based on the base primitive. This new cylinder
is similar to the first one. However, its shape is con-
trolled by two parameters generated by the applica-
tion, radius and height. The radius parameter mod-
els the diameter of the new primitive (cylinder). This
value is always minor or equal to the radius of the ear-
lier primitive (for stalactites), and any value for sta-
lagmites. This radius is randomly generated by the
application, following the variations previously de-
scribed.
The height parameter models the distance between
the base primitive and a new generated primitive. The
new primitive will be translated with respect to the
negative y− axis (stalactites) or to the positive y − axis
(stalagmites) according to the value of this parameter.
The height, similarly to the radius, is randomly gener-
ated by the application and passed to the shader effect
file as a constant buffer variable.
A summary of the possible effects on these vari-
ables (radius and height) and the type of structure gen-
erated is given in Table 1. The equation which defines
the new primitive, based on the radius and height sup-
plied by the application in relation to the earlier prim-
itive is given by v
0
= v +height + r ∗
~
N, where v
0
is the
new vertex position, v is the current vertex position,
~
N is the normal vector, and r represents the radius of
the new ring.
Figure 5: New generated primitive based in the parameters:
Radius and Height.
Figure 5 shows the base primitive and a new gen-
erated primitive inside the geometry-shader stage. For
the new cylinder, new IDs are assigned. The IDs for
the new primitive will be exactly the same IDs of the
base primitive when entering the pipeline for the first
time, before the increment. In other words, highest
vertices of the cylinder receive IDs = 0 (zero) and the
lowest vertices receive IDs = -1. Finally, the last task
in the geometry-shader stage is to connect the vertices
of the first and second cylinders. We use the IDs to
select only the vertices which will be processed for
the creation of the new primitive in the ring sequence.
Only vertices with IDs smaller than or equal to zero
are processed. Figure 6 shows the two previously gen-
erated cylinders and the link of their vertices, mak-
ing a cone-like shape. Also observe the configuration
of the IDs after the first pass through the geometry-
shader stage.
Using an approximation of the real model of
growth of speleothems described in (Kaufmann,
2003), the Radius and Height parameters, that con-
trol the speleothems growth rate and form, are de-
fined as following. The pluviometric index level (PIL)
of the water acidulation stage, described in Section
3.2, is the amount of rain water. To our model, the
pluviometric index is one of three possible levels:
GRAPP 2009 - International Conference on Computer Graphics Theory and Applications
30
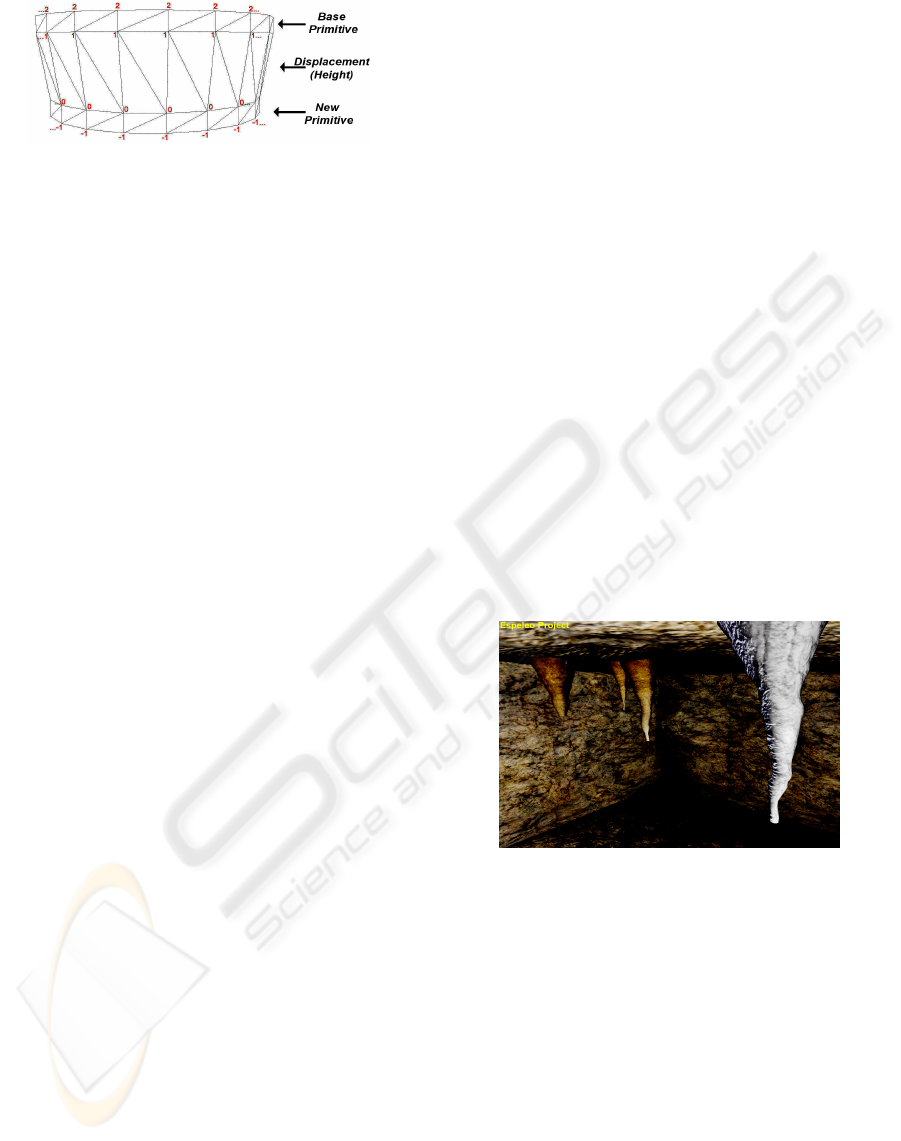
Figure 6: Cone-like shape created inside the geometry-
shader stage.
Level 0: lack of rain, in other words, no growth of
speleothems. Level 1: makes possible the creation
of stalactites, but there is no dripping, in other words,
the drop with saturated solution can solidify just in the
tip or in the surface of the stalactite already formed.
Level 2: Dripping of the saturated solution occurs due
to the high volume of rain water, possible growth of
stalagmites.
The drip interval depends on the pluviometric in-
dex, and the cracks in the limestone rock (fissures
where the rain water flows downward to the cave en-
vironment). The drip interval is inversely propor-
tional to the pluviometric index. If the drip interval
is small (wet weather), the tendency is an increase of
the new ring diameter. If the drip interval is long (dry
weather), the tendency is a decrease of the new ring
diameter. The radius parameter is linked with these
properties, and it is responsible to create some defor-
mities on the surface of the speleothem.
The calcium and carbon-dioxide concentration in
the drop of the satured solution depend on the soil
vegetal coverage, which is a source of carbon-dioxide
(CO2) for rain water. A soil with greater vegetation
cover increases the concentration of CO2 in water
(greater acidulation), making minerals such as cal-
cium and other minerals mixed with water that infil-
trates in the layers of the limestone rock. The wa-
ter is super-saturated of calcium and, on entering the
cave, CO2 is degassed from the drop and the excess
calcium is deposited as calcite (CaCO3) in the cave.
The height parameter is linked with these properties.
Thus, the height of the speleothems is proportional to
the calcium and carbon-dioxide concentration.
Another possibility must be considered: if the cal-
cium and carbon-dioxide concentration are low, the
drops may solidify before reaching the tip of the sta-
lactite or the stalagmite base. Thus, only horizontal
growth takes place, rather than the vertical growth,
exactly at the point of the body of the speleothem
where the drip solidifies. This horizontal displace-
ment is proportional to the value of radius of the
new primitive, where the drip with the saturated so-
lution solidified. This horizontal displacement cre-
ates some deformity on the surface of the speleothem.
The equation of the horizontal displacement is given
by: vd = k f ∗ arr/irr where vd is the vertex displace-
ment factor, k f is a fixed scaling factor to adjust the
size of displacements proportionally to the size of the
speleothem, arr is the actual ring radius and irr is the
initial ring radius. Stalactites growth is linked with
two control variables: pluviometric index and CO2
concentration. Stalagmites growth is linked with both
pluviometric index and CO2 concentration, and also
with the drip interval. Table 1 shows all the properties
and the values that affect the height and radius of the
speleothems.
The presence of air circulation in the interior of
the cave also affects the shape of the speleothem. The
new primitive ring in formation can suffer a position
displacement in the direction of the air flow. The pa-
rameter that models the presence or not of the air flow,
as well as its direction, is supplied by the application
or by the interactive intervention of the user. It is com-
puted as
~
v
0
= wi(~v + ~w) where
~
v
0
is the new position
of vertex ~v, ~w is the unit vector defining the wind di-
rection and wi is a scalar modeling the wind intensity
varying between 0.0 and 1.0. Figure 7 shows the de-
formation in the shape of stalactites given by random
wi values at each ring creation and also random ~w due
to the presence of air circulation in the interior of the
cave.
Figure 7: Effect of wind in the formation of stalactites.
The growth of speleothems is suspended due to
four factors: (i) the pluviometric index is in Level 0;
(ii) the radius of the new created ring is equal to zero;
(iiii) when the speleothem reaches the extremity of
the cave, i.e. roof (stalagmites) or floor (stalactites)
and (iv) when a column speleothem is created. When
any of these conditions is satisfied, the vertical growth
is suspended and only surface deformations and hori-
zontal growth of the speleothems will occur.
This step completes the process of geometry am-
plification using the GS. However, in order for the
simulated speleothem to reach an approximate shape
of a real speleothem, it is necessary several successive
passes in the pipeline so that its full shape is reached.
At each pass, all the primitives created in the last pass
MODELING AND RENDERING THE GROWTH OF SPELEOTHEMS IN REAL-TIME
31
are the new input for the geometry-shader stage. For
that, the new primitive is sent back to the initial stages
of the pipeline, using the stream-output stage. Be-
fore passing the result to the next pipeline stages (ras-
terizer and pixel-shader), the data is stored in a spe-
cial buffer and sent to memory. The application takes
charge of rendering what was created, and also, of
sending back the same result to the initial stages of
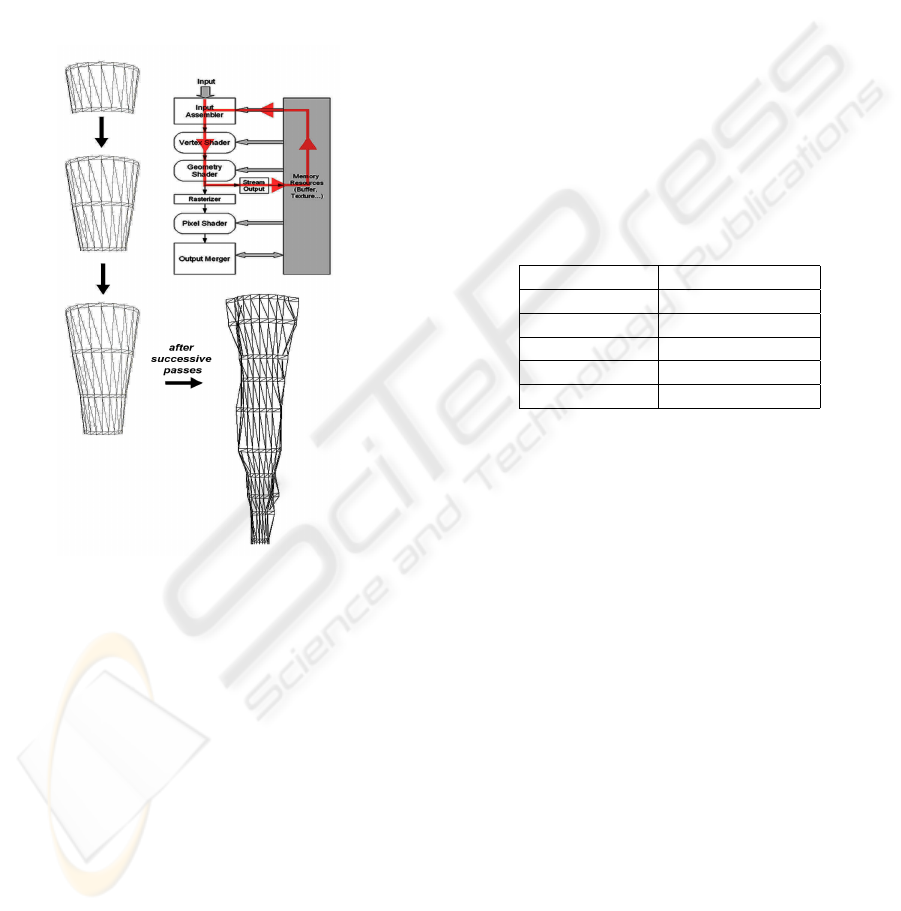
the pipeline. Figure 8 shows the evolution in the con-
struction of the speleothems in the several successive
passes through the pipeline before the final render.
Figure 8: Growth of the speleothem. Successive passes
through the pipeline.
4.2 Appearance of Speleothems
Once we have the shape defined, we have to model
the appearance of the speleothems. According to
(Beynen et al., 2001), when visualized in visible or
transmitted light, the speleothems show variations of
hue and intensity. The standard coloration of the
speleothems is white due to the limestone. How-
ever, other minerals and impurities present in lime-
stone rock, can mix with the solution at the lime-
stone dissolution stage. Depending on the type of
mineral mixed, the speleothem will assume a charac-
teristic color of the same. For instance, the presence
of iron can produce ornamentations of red coloration,
ocher, brown, orange, and yellow. Manganese oxides
produce speleothems of black color, gray-bluish and
deep and brilliant blue. Copper salts produce blue
speleothems. The malachite produces blue-greenish
coloration. In our model the user can choose the min-
eral type that will produce a specific coloration for the
speleothem in formation. It is possible, on the fly, to
change the rate of intensity of the mixture of the min-
eral in the solution, varying the color of speleothem.
Since we do not have a model for color distribution
along the body of the speleothem, we used a linear
variation from base to tip. To calculate this varia-
tion in coloring (final vertex color), we use the equa-
tion: f vc = mc ∗ (arID/rc), where arID is the ac-
tual ring ID, rc is the amount of all the rings that the
speleothem is made off and mc is the mineral color
RGB data. The color will increase linearly according
to the current ring we are building. For our imple-
mentation, since the literature on this subject does not
present RGB data, we had to approximate the values
from pictures of the real speleothems. The RGB data
for each possible mineral is showed in Table 1.
Table 1: Mineral Color (mc).
Mineral Type RGB value
Calcareous (0.8, 0.8, 0.8)
Iron (0.87, 0.62, 0.34)
Manganese (0.32, 0.44, 0.54)
Copper (0.05, 0.7, 0.7)
Malachite (0.67, 0.82, 0.75)
Still in (Beynen et al., 2001), the crystals of
calcite which form the body of the speleothems are
translucent, thus providing great dispersion and re-
flection when exposed to any type of lighting, and
fluorescence in the visible spectrum when exposed
to UV light. Those optics properties are also at-
tributed to the mixed impurities to the solution in the
limestone dissolution stage. To improve the appear-
ance of the speleothems and to simulate the proper-
ties mentioned above, we used standard graphics tech-
niques such as Normal Mapping (Cohen et al., 1998;
Cignoni et al., 1998), Tone Mapping (Ashikhmin,
2002) and Environment Mapping (Blinn and Newell,
1976; Miller and Hoffman, 1976). Normal Mapping
is used to increase the effect of ruggedness on the sur-
face of the speleothems, together with the horizontal
displacement, described in Section 4.1. Tone Map-
ping and Environment Mapping are used for the effect
of brightness and reflection, simulating the properties
of crystals of calcita and moisture caused by aqueous
solution that covers the speleothems.
We need successive passes for the shape of the
speleothem to be completed. The actual number of
passes needed is entirely dependent on the random
values of the variables radius and height set by the ap-
plication. For that reason, for each new execution of
GRAPP 2009 - International Conference on Computer Graphics Theory and Applications
32

the application, we will have different speleothems. It
is also possible to create the speleothems in a manual
mode. The application interface allows to insert val-
ues for the parameters showed in the Table 2 through
interactive controls. These controls can also be used
to drive the creation of certain shapes of speleothems,
instead of creating them in a random way. During the
process of speleothems creation, is possible to do any
manipulation in the application such as changing val-
ues of parameters, camera navigation and also set pa-
rameters values for the Normal Mapping, Tone Map-
ping and Environment Mapping techniques.
Table 2: Parameters for speleothems growth.
PIL Drip Int. CO2 Conc. Type Radius Height
0 - - - - -
1 - low stalactite decrease x2 increase x1
1 - normal stalactite decrease x1 increase x2
1 - high stalactite same increase x3
2 dry low stalagmite decrease x1 increase x1
2 standard low stalagmite same increase x1
2 wet low stalagmite increase x1 increase x1
2 dry normal stalagmite decrease x1 increase x2
2 standard normal stalagmite same increase x2
2 wet normal stalagmite increase x1 increase x2
2 dry high stalagmite decrease x1 increase x3
2 standard high stalagmite same increase x3
2 wet high stalagmite increase x1 increase x3
5 RESULTS
In this section we illustrate a few of our results.
These were obtained on a Pentium D 2.8 GHz, 2GB
RAM, NVIDIA GeForce 8600 GT. The application
was implemented using the DirectX 10 API, HLSL
(St-Laurent, 2005). Figure 9 summarizes our results.
In (a) we show stalactites created by random values
of radius and height in according to the parameters
of Table 1. The values change at every application
time step. In (c) we show a stalactite growth with
LOW CO2 Concentration and all remaining param-
eters fixed. In (b) we show a stalactite growth with
NORMAL CO2 Concentration and figure (d) shows
a stalactite growth with HIGH CO2 Concentration in
the drop of satured solutiuon. Figure 9 (e) shows
stalagmites with Drip Interval (DRY) and NORMAL
CO2 Concentration. The figure (f) shows columns
created by joining stalagmites and stalactites. Fig-
ures (g) and (h) show both stalactites and stalagmites
made with random values generated by the applica-
tion on-the-fly. In the figures (a, b, c, f) the pre-
dominant mineral is calcareous, therefore the color
of speleothems is white. In figures (d, e, g) the pre-
dominant mineral is iron. The color of speleothems
vary between red and yellow. In figure (h) the pre-
dominant mineral is malachite which alters the color
to blue-greenish. The frame rate of our implemen-
tation depends on the amount of speleothems being
created. The amount is set in the beginning of the
simulation. Compared with the work of (Yang and
Ouhyoung, 1992), our model makes use of meaning-
ful geological parameters to control the shape and ap-
pearance of the speleothems. Our approach improves
the visual quality and also creates a simple shape with
a low polygon count, taking advantage of the Geome-
try Shader. Our approach is plausible with the growth
of real speleothems.
6 CONCLUSIONS
This work presented a simple model for growth of
speleothems in real-time, using real geological pa-
rameters of growth of speleothems. We also used
the powerful amplification capability of the geometry-
shader and stream-output stages present in last gen-
eration GPUs. It is clear that the availability of
these two graphical pipeline stages becomes a rich
source for exploration of new forms to create geom-
etry. However, there is a lot to explore on this sub-
ject, not only in the simulation of this specific nat-
ural phenomena that is rich in information, but also
in the application side. We have not touched yet the
full richness of the way speleothems reflect light, and
this is left for future work. We assess that the fi-
nal results were satisfactory compared with the real
forms of speleothems, making it possible to generate
a large variation of speleothems in realtime, suitable
for graphics applications.
ACKNOWLEDGEMENTS
We would like to thank professor Francisco da Cruz
(Chico Bill) from University of Sao Paulo, Brazil
(USP) who helped us with the geological background.
We also would like to thank professors Chuan-Kai
Yang and Ming Ouhyoung from National Taiwan
University of Science and Technology for making
available their results from the paper (Yang and Ouhy-
oung, 1992).
REFERENCES
Ashikhmin, M. (2002). A tone mapping algorithm for
high contrast images. In EGRW ’02: Proceedings of
the 13th Eurographics workshop on Rendering, pages
145–156, Aire-la-Ville, Switzerland, Switzerland. Eu-
rographics Association.
MODELING AND RENDERING THE GROWTH OF SPELEOTHEMS IN REAL-TIME
33

Beynen, P. V., Bourbonniere, R., Ford, D., and Schwarcz,
H. (2001). Causes of colour and fluorescence in
speleothems. Chemical Geology, 175(3-4):319–341.
Blinn, J., Gomez, J., Max, N., and Reeves, W. (1983). The
simulation of natural phenomena (panel session). SIG-
GRAPH Comput. Graph., 17(3):137–139. Chairman-
Charles A. Csuri.
Blinn, J. F. and Newell, M. E. (1976). Texture and reflec-
tion in computer generated images. Commun. ACM,
19(10):542–547.
Blythe, D. (2006). The direct3d 10 system. Proceedings of
ACM SIGGRAPH 2006, 25(3):724–734.
Bouthors, A., Neyret, F., and Lefebvre, S. (2006). Real-
time realistic illumination and shading of stratiform
clouds. In Eurographics Workshop on Natural Phe-
nomena, pages 41–50.
Boyd, C. (2007). The direct3d 10 pipeline. ACM SIG-
GRAPH 2007 courses, pages 52–109.
Cignoni, P., Montani, C., Scopigno, R., and Rocchini, C.
(1998). A general method for preserving attribute val-
ues on simplified meshes. In VIS ’98: Proceedings of
the conference on Visualization ’98, pages 59–66, Los
Alamitos, CA, USA. IEEE Computer Society Press.
Cohen, J., Olano, M., and Manocha, D. (1998).
Appearance-preserving simplification. In SIGGRAPH
’98: Proceedings of the 25th annual conference on
Computer graphics and interactive techniques, pages
115–122, New York, NY, USA. ACM.
Kaufmann, G. (2003). Stalagmite growth and palaeo-
climate: the numerical perspective. Earth and Plane-
tary Science Letters, 214(1-2):251–266.
Lawrence, J. and Funkhouser, T. (2004). A painting in-
terface for interactive surface deformations. Graph.
Models, 66(6):418–438.
Lino, C. F. (2001). Cavernas: O Fascinante Brasil Sub-
terr
ˆ
aneo. Gaia, S
˜
ao Paulo.
Miller, G. S. and Hoffman, C. R. (1976). Illumination and
reflection maps: Simulated objects in simulated and
real environments. SIGGRAPH ’84 Advanced Com-
puter Graphics Animation seminar notes.
Min, K. and Metaxas, D. (2007). A combustion-based tech-
nique for fire animation and visualization. The Visual
Computer, 23(9-11):679–687.
Ouhyoung, M. and Yang, C. (1993). The synthesis of a cav-
ern with eroded stalactites and stalagmites. Proc. of
CAD/Graphics’93, New Advances in Computer Aided
Design and Computer Graphics.
Rousseau, P., Jolivet, V., and Ghazanfarpour, D. (2006). Re-
alistic real-time rain rendering. Computers & Graph-
ics, 30(4):507–518.
Self, C. A. and Hill, C. A. (2003). How speleothems grow:
An introduction to the ontogeny of cave minerals.
Journal of Cave and Karst Studies, 65(2):130–151.
Short, M. B., Baygents, J. C., Beck, J. W., Stone, D. A.,
III, R. S. T., and Goldstein, R. E. (2005a). Stalactite
growth as a free-boundary problem: A geometric law
and its platonic ideal. Phys. Rev. Lett., 94(018510).
Short, M. B., Baygents, J. C., and Goldstein, R. E. (2005b).
Stalactite growth as a free-boundary problem. Physics
of Fluids, 17(8).
Short, M. B., Baygents, J. C., and Goldstein, R. E. (2006).
A free-boundary theory for the shape of the ideal drip-
ping icicle. Physics of Fluids, 18(8).
Sillion, F. and Puech, C. (1994). Radiosity and Global Illu-
mination. Morgan Kaufmann, New York.
St-Laurent, S. (2005). The COMPLETE Effect and HLSL
Guide. Paradoxal Press.
Szilder, K. and Lozowski, E. (1995). Simulation of ici-
cle growth using a three-dimensional random walk
model. Atmospheric Research, 36(3-4):243–249.
Yang, C. and Ouhyoung, M. (1992). A stalactite cave by
stochastic modeling with radiosity illumination. Proc.
of 1992 International Computer Symposium.
GRAPP 2009 - International Conference on Computer Graphics Theory and Applications
34
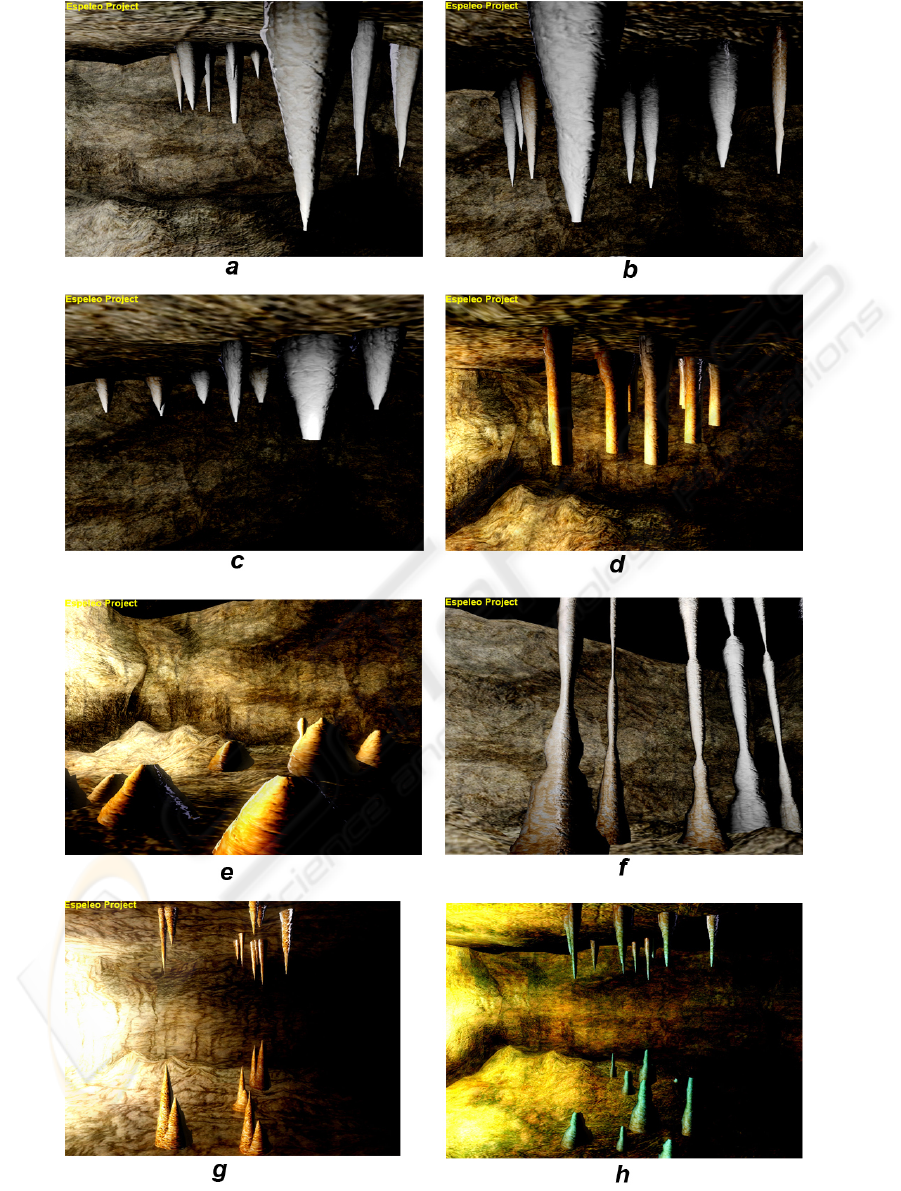
Figure 9: Virtual Speleothems.
MODELING AND RENDERING THE GROWTH OF SPELEOTHEMS IN REAL-TIME
35
