
WEIGHT ESTIMATION AND CLASSIFICATION OF MILLED
RICE USING SUPPORT VECTOR MACHINES
Oliver C. Agustin and Byung-Joo Oh
Department of Electronic Engineering, Hannam University, 133 Ojeong-dong, Daeduk-gu, Daejeon City, Korea
Keywords: Support vector machines, Milled rice analysis.
Abstract: This paper presents a method for weight estimation and classification of milled rice kernels using support
vector machines. Shape descriptors are used as input features for determining the grade factors based on
physical shapes such as headrice, broken kernel, and brewer. Colour histogram is extracted from milled rice
image to obtain 24 colour features in RGB and Cielab colour spaces. We built a support vector regression
(SVR) model for estimating rice kernel weight and support vector classifier (SVC) for rice defectives.
Results showed that in real data, the performance of SVR is better than linear regression (LR) with a mean
square error (MSE), mean absolute error (MAE) and correlation coefficient of 78.35x10
-3
, 0.206 and
0.9943, respectively. In determining grade factors based on colour appearance (rice defectives), SVC
outperforms the generalized regression neural network (GRNN) with an accuracy of 98.86%.
1 INTRODUCTION
Machine vision quality evaluation systems
objectively measure and classify various agricultural
(Zapotocznya, Zielinskaa et al.) and food products
(Timmermans, 1998). Vision-based methods are
objective, non-destructive and can assess the visual
quality characteristics of agricultural grains (Zayas,
Martin et al., 1996; Ni, Paulsen et al., 1997)
especially, milled rice (Yadav and Jindal, 2001) with
high accuracy.
Existing rice quality evaluation systems perform
neural network-based classification techniques in
which grains are classified in bulk (Visen, Paliwal et
al., 2004). This method makes it difficult to
determine the number of rice kernels and provide a
way to estimate the weight of rice kernels.
Difficulties arise when rice quality evaluation
standards require that the grade factors be expressed
as a percentage by weight of defective rice content
that are present in milled rice grain samples.
Continuous improvement of the classification
accuracy in evaluating these quality factors is
important.
The goal of this paper is to present the support
vector machines (SVM) to achieve the purpose of
this paper by: a) building an SVR model for weight
estimation of milled rice kernel, b) SVC model for
classifying milled rice defectives, and c) compare
the performance of the proposed models with
existing methods used in (Agustin and Oh, 2008).
2 RICE QUALITY AND
EVALUATION FRAMEWORK
Rice quality defectives are classified according to
various categories such as discoloured, chalky,
sound, broken, red, and damaged kernels. Headrice
is defined as kernel or piece of kernel with its length
equal to or greater than 75% of the average length
(grain size) of unbroken kernel. Broken kernels are
kernels below 75% of the grain size. Brewers are
small pieces or particles of kernels that pass through
a sieve having round perforations of 1.4 mm in
diameter. More information about rice defectives
and rice grading standards that we adopt are
available in (2002).
Rice image processing in stage 1 Figure 1
acquire images from various image sources.
Background segmentation is performed in stage 1 to
filter the object of interest from the acquired image.
Once unimportant features are removed, colour
image is converted into binary image format to
recover the shape of rice kernels
377
Agustin O. and Oh B. (2009).
WEIGHT ESTIMATION AND CLASSIFICATION OF MILLED RICE USING SUPPORT VECTOR MACHINES.
In Proceedings of the Fourth International Conference on Computer Vision Theory and Applications, pages 377-380
DOI: 10.5220/0001755803770380
Copyright
c
SciTePress
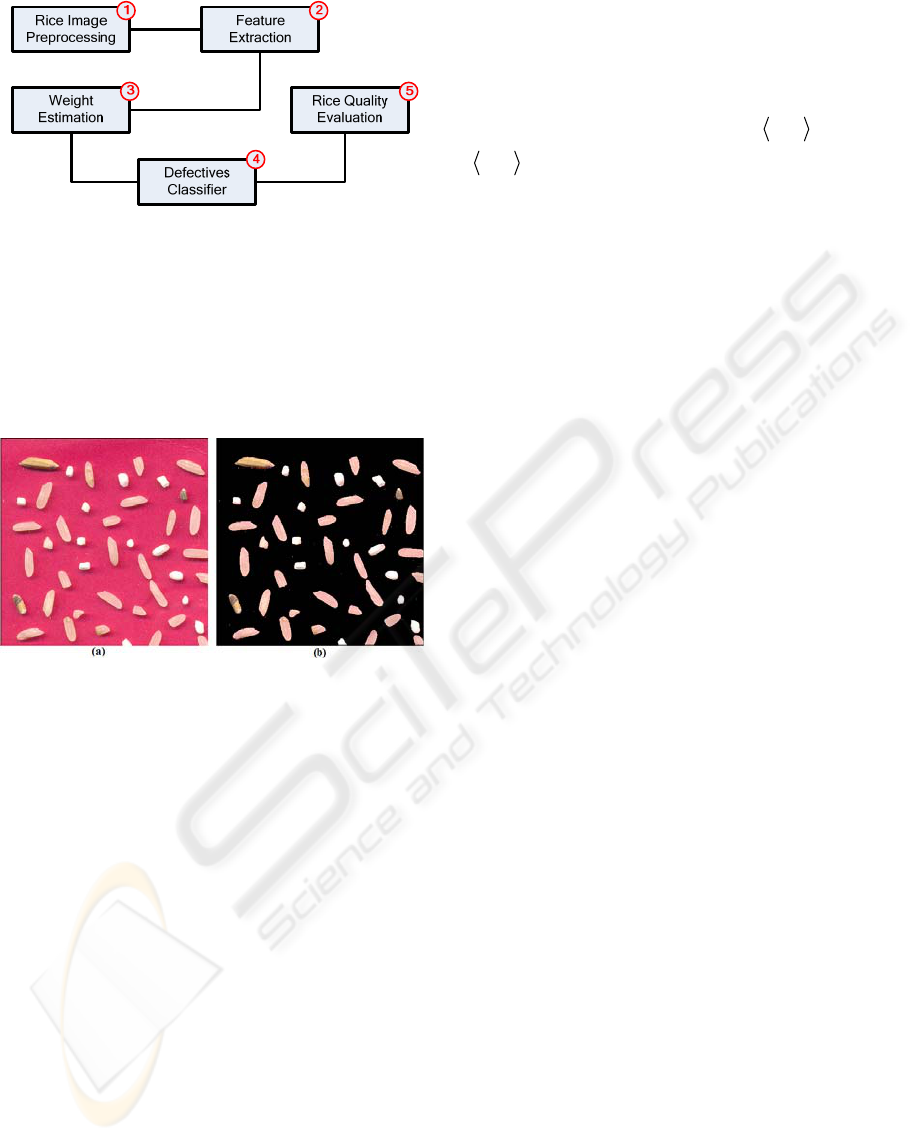
Figure 1: Proposed evaluation framework for milled rice
grains weight estimation and classification using SVM.
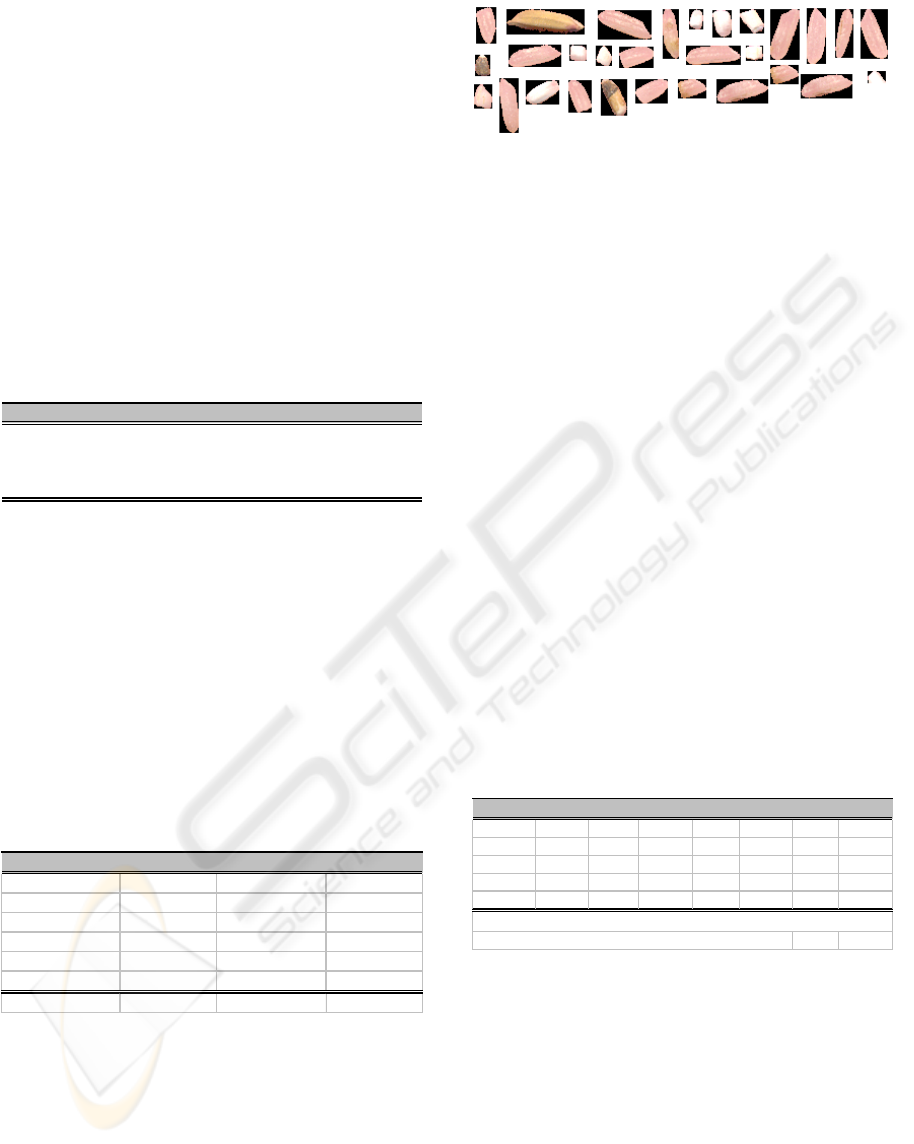
Figure 2a shows the acquired image and in
Figure 2b the rice kernels with the background-
segmented image. Note that non-trivial pink
background colour was used to preserve all features
that would have been removed when black or white
background is used (Agustin and Oh, 2008).
Figure 2: Acquired rice image and background
segmentation.
In stage 2, shape analysis is performed to get the
morphological properties of the rice. Area,
perimeter, major axis, minor axis, feret diameter,
and roundness comprise the geometric features.
Stage 3 performs weight estimation based on the
given area of rice kernel image. In defectives
classifier of stage 4, each segmented rice kernels are
evaluated according to rice defectives categories.
Having estimated the total weight for each class, rice
grade evaluation is performed in stage 5 using the
milled rice grading standards in (NFA, 2002).
3 SUPPORT VECTOR
MACHINES
A regression model was implemented in (Yadav and
Jindal, 2001) to find a relationship between headrice
yield and characteristic dimension. In (Agustin and
Oh, 2008), linear regression was able to estimate
kernel weight using rice blob area and Generalized
Regression Neural Network (GRNN) for
classification of rice defectives. In this paper, we
extend the application of SVM to milled rice grain
quality evaluation.
In its basic formulation, SVM (Vapnik, 2000) are
linear functions of the form
() ,
f
xb=+wxi where
wxi is the inner product between the weight
vector w and the input vector x. SVM is commonly
used for binary classification by setting the class to 1
if
() 0fx> and -1 if () 0fx≤ . The underlying
principle behind SVM is to choose hyperplanes that
separate positive and negative examples while
maximizing the margin between two classes and
choosing a linear separation in feature space.
We adopted the C-Support Vector Classification
(C-SVC) (Scholkopf, Smola et al., 2000) to perform
classification of milled rice defectives. The decision
function of C-SVC is expressed in the equation as::
1
sgn ( , )
s
N
ii i j
i
y
Ks b
α
=
⎛⎞
+
⎜⎟
⎜⎟
⎝⎠
∑
x
(1)
where
(, )
ij
K
sx
is a kernel function,
s
N refers to
the number of support vectors as a result of training,
i
s
are the support vectors, and b is the bias term.
A “one-against-one” approach by training a
binary SVM in (1) for any two classes of data to
obtain the equation in (2). For a k-class problem,
there are k(k-1)/2 decision functions. In the
prediction stage, a voting strategy is used where a
testing data point x, is designated to be in a class
with the maximum number of votes (Hsu and Lin,
2002):
(
)
sgn (w ) (x)+b
ij T ij
φ
. (2)
Equation (2) signifies that if x is in the ith class,
then the vote for the ith class is added by one.
Otherwise, jth is increased by one. After which, x is
predicted in the class with the largest vote.
Finally, we address the milled rice weight
estimation problem using v-Support Vector
Regression (v-SVR) (Smola and Schölkopf, 2004).
The regression estimate takes the form
*
1
() ( ) ( ,)
N
ii i
i
f
xKxxb
αα
=
=
−+
∑
. (3)
The expression in (3) estimates the weight of
milled rice grain by means of shape feature (area of
milled rice blob) as the only input feature.
VISAPP 2009 - International Conference on Computer Vision Theory and Applications
378
4 RESULT AND DISCUSSION
To compare the performance of the SVM classifier
with a neural network classifier, we built a GRNN
classifier (Agustin and Oh, 2007). Optimal
Parameters for SVM and Kernel Function Selection
The best way to find these parameter values is to do
an exhaustive grid search. An survey has been
published in (Chang and Lin, 2001) and
recommending the RBF kernel in SVM. We
evaluated varies kernel functions and the results are
summarized in the Table 1 showing parameters and
kernel function that will give maximum accuracy for
milled rice classification.
Table 1: Optimal parameter for leading to highest
classification accuracy in SVC with different kernels.
Kernel Penalt
y
(C)
g
amma r De
g
ree(d) Accurac
y
(%)
Linear 32 0.00781250 NA NA 93.13
Polynomial NA NA 25 4 93.13
RBF 32768 0.00781250 NA NA 93.38
Sigmoid 32768 0.00195313 0
N
A 92.95
4.1 Data and Features Set
The dataset given in Table 2 is composed of 4,979
training instances and 2,011 test instances. Milled
rice categories contain an equal number of instances.
The features are scaled in the range {-1, 1} to
prevent attributes with larger values to dominate
smaller ones. Similar scaling factor is applied to
testing data. Numeric values were assigned to
different classes.
Table 2: Training and test data used for SVC and GRNN
classifiers.
Categories Samples Training Test
Damaged 1165 826 339
Good 1165 827 338
Paddy(Palay) 1165 814 351
Chalky 1165 850 315
Discolored 1165 831 334
Red Kernel 1165 831 334
Total: 6990 4979 2011
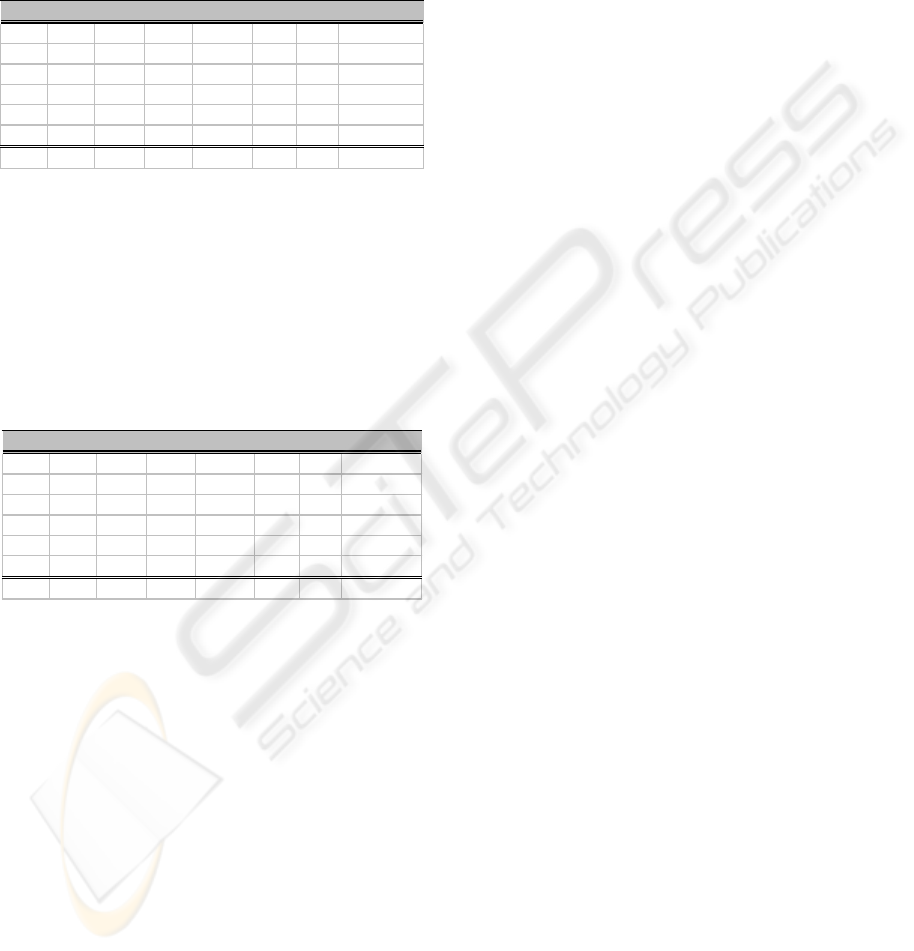
Figure 3 presents images of the extracted milled rice
grains from the image sample as input data to stage
2 (see the rice evaluation framework in Figure 1).
Six geometric features and 24 colour features are
then extracted for each rice kernel images. Shape
descriptors such as area, perimeter, major axis,
minor axis, feret diameter, and roundness define the
geometric features while the mean, median, range,
and standard deviation of each kernel images
Figure 3: Extracted colour rice blobs ready for features
extraction.
in RGB and Cielab colour spaces having a total of
24 colour features.
We used thirty seven rice images (1407×1776
pixels, 24-bit bitmap format) as the source of our
real dataset in evaluating the performance of the
regression and classification models. The images
contain milled rice kernels of different defectives
types whose sample weight varies between 0.5
grams to 10.0 grams. For background segmentation,
we use the optimal color range in scaled Cielab
space {255, 165, 255} to delete background pixels
but we also use other ranges (e.g., {255, 160, 255}
and {255, 170, 255}) to test the or SVM regression
and classification model when the filter ranges
deviated from the optimal threshold.
4.2 Regression
Table 3 shows various results of weight estimation.
For SVR, we obtain an MSE, MAE, and correlation
coefficient of 78.35x10
-3
, 0.206 and 0.9943,
respectively.
Table 3: Weight estimation result between SVR and LR
using different parameters for background segmentation.
Defectives
ACTUAL LR/160 SVR/160 LR/165 SVR/165 LR/170 SVR/170
Chalky 5.23 5.68 5.65 5.79 5.76 5.90 5.87
Good 16.22 16.22 16.08 16.46 16.31 16.68 16.53
Immature 23.54 27.17 26.99 27.64 27.46 28.09 27.90
Red 50.02 49.65 49.23 51.16 50.72 52.12 51.66
yellow 64.08 66.10 65.57 67.28 66.73 68.31 67.74
Threshold values used in background subtraction are 160, 165 and 170
Note: All units are in grams, LR - Linear Regression, SVR - Support Vector Regression
LR, on the other hand, resulted to an MSE,
MAE, and correlation coefficient, of 87.64x10
-3
,
0.220 and 0.9945, respectively. Based on these
results, SVR slightly outperforms LR. There is one
excellent characteristic of SVR which makes it a
desirable approach for milled rice weight estimation.
The deviation of the prediction error is lesser than
LR when the threshold value used in background
segmentation deviates from the optimal value.
WEIGHT ESTIMATION AND CLASSIFICATION OF MILLED RICE USING SUPPORT VECTOR MACHINES
379
4.3 Classification
The confusion matrix for SVC is shown in Table 4
using the test data in Table 2. We achieved an
accuracy of 98.86% (1988/2011).
Table 4: SVC Classification matrix for milled rice kernels
with an accuracy of 98.86%.
Dmgd Good Palay Chalky Disc Red Accuracy(%)
Damgd 333 0 1 2 3 0 98.23
Good 0 338 0 0 0 0 100.00
Paddy 1 0 350 0 0 0 99.72
Chalky 7 2 0 306 0 0 97.14
Disc 3 0 0 0 331 0 99.10
Red
2 2 0 0 0 330 98.80
Similarly, we did a performance evaluation on
GRNN classifier using the same test data. Different
combination of parameter values were tried
including the use of genetic algorithm to find the
optimal smoothing factors. The performance of the
GRNN model for each rice defectives classification
is presented in Table 5 having an overall accuracy of
91.84% (1847/2011).
Table 5: GRNN classification matrix for milled rice
kernels with an overall accuracy of 91.84%.
Dmgd Good Palay Chalky Disc Red Accuracy(%)
Damgd 276 24 13 13 12 1 81.42
Good 0 327 9 1 0 1 96.75
Paddy 3 5 339 2 2 0 96.58
Chalky 10 2 6 297 0 0 94.29
Disc 3 4 8 12 303 4 90.72
Red
6 3 5 5 10 305 91.32
5 CONCLUSIONS
Judging from the weight estimation capability of
SVR and LR, the performance of proposed model
has been found to perform better especially when
segmentation threshold drifts away from the optimal
value. SVR always has an estimate closer to the
measured value than the LR model. The proposed
SVC model for classifying milled rice defectives far
exceeds the performance of the neural network
counterpart with an accuracy of 98.86% against
88.76% of GRNN using data that was never used for
training.
ACKNOWLEDGEMENTS
This work is supported by a grant from Security
Engineering Research Center of Ministry of
Knowledge Economy and Hannam University.
REFERENCES
Agustin, O. C. and B. J. Oh (2007). "Applications of Ward
Network and GRNN for Corn Quality Classification."
Journal of Korean Institute of Information Technology
5(4): 218-225.
Agustin, O. C. and B. J. Oh (2008). Automatic Milled
Rice Quality Analysis. The 2nd International
Workshop on Network Assurance (NA 2008), Hainan
Island, China, IEEE CS Proceedings.
Chang, C. C. and C. J. Lin (2001). "LIBSVM: A library
for support vector machines."
Hsu, C.-W. and C.-J. Lin (2002). "A comparison of
methods for multiclass support vector machines."
IEEE Transactions on Neural Networks 13(2): 415-
425.
NFA (2002). Philippine Grains Standardization Program,
National Food Authority.
Ni, B., M. R. Paulsen, et al. (1997). "Design of an
automated corn kernel inspection system for machine
vision." Transactions of the ASAE 40(2): 491–497.
Scholkopf, B., A. J. Smola, et al. (2000). New Support
Vector Algorithms, MIT Press. 12: 1207-1245.
Smola, A. J. and B. Schölkopf (2004). "A tutorial on
support vector regression." Statistics and Computing
14(3): 199-222.
Timmermans, A. J. M. (1998). "Computer vision system
for online sorting of pot plants based on learning
techniques." Acta Horticulturae 421: 91-98.
Vapnik, V. N. (2000). The Nature of Statistical Learning
Theory, Springer.
Visen, N. S., J. Paliwal, et al. (2004). "Image analysis of
bulk grain samples using neural networks." Canadian
Biosystems Engineering 46: 7.11-7.15.
Yadav, B. K. and V. K. Jindal (2001). "Monitoring
Milling Quality of Rice by Image Analysis."
Computers and Electronics in Agriculture 33(1): 19-
33.
Zapotocznya, P., M. Zielinskaa, et al. (2008). "Application
of image analysis for the Varietal Classification of
Barley: Morphological features." Journal of Cereal
Science 48(1): 4-9.
Zayas, I. Y., C. R. Martin, et al. (1996). "Wheat
classification using image analysis and crush force
parameters." Transactions of the ASAE 6(39 ): 2199-
2004.
VISAPP 2009 - International Conference on Computer Vision Theory and Applications
380
