
HOW DO EMOTIONAL STIMULI INFLUENCE THE
LEARNER’S BRAIN ACTIVITY?
Tracking the Brainwave Frequency Bands Amplitudes
Alicia Heraz and Claude Frasson
HERON Lab, University of Montréal, CP 6128 succ., Centre Ville, Montréal QC, Canada
Keywords: Electrical Brain Activity, Machine Learning Techniques, Learner Brainwaves Model.
Abstract: In this paper we discuss how learner’s electrical brain activity can be influenced by emotional stimuli. We
conducted an experimentation in which we exposed a group of 17 learners to a series of pictures from the
International Affective Picture System (IAPS) while their electrical brain activity was recorded. We got
33.106 recordings. In an exploratory study we examined the influence of 24 picture categories from the
IAPS on the amplitude variations of the 4 brainwaves frequency bands: δ, ϕ, α and β. We used machine
learning techniques to track the amplitudes in order to predict the dominant frequency band which inform
about the learner mental and emotional states. Correlation and regression analyses show a significant impact
of the emotional stimuli on the amplitudes of the brainwave frequency bands. Standard classification
techniques were used to assess the reliability of the automatic prediction of the dominant frequency band.
The reached accuracy was 90%. We discuss the prospects of extending our actual Brainwave-Sensing Multi
Agent System to be integrated to an intelligent tutoring system (ITS) in the future.
1 INTRODUCTION
Innovative Research is rapidly expanding the level
of control that is achievable in Human-Machine
Interactions. Scientists have been experimenting
with non-invasive brain-computer interfaces that
read brain signals with an electroencephalogram
(EEG). EEG-based brain-computer interfaces use
sensors placed on the head to detect brainwaves and
feed them into a computer as input (Palke, 2004). To
close the performance gap between the user and the
computer, many research focused on the user
modelling (Conati, 2002); (Kort & al., 2001).
Most of the work in this field has focused on
identifying the user’s emotions as they interact with
computer systems such as tutoring systems (Fan &
al., 2003) or educational games (Conati, 2002;
2004). The importance of the systematic study of
emotions has become more present in several
disciplines (Ekman, 1992); (Mandler, 1999);
(Panksepp, 1998); (Picard, 1997) since it was largely
ignored until the late 20th century.
Kort, Reilly and Picard (2001) proposed a
comprehensive four-quadrant model that explicitly
links learning and affective states; this model has not
yet been supported by empirical data from human
learners. Conati (2002) has developed a probabilistic
system that can reliably track multiple emotions of
the learner during interactions with an educational
game. Their system relies on dynamic decision
networks to assess the affective states of joy,
distress, admiration, and reproach. The performance
of their system has been measured on the basis of
learner self reports (Conati, 2004) and inaccuracies
that were identified have been corrected by updating
their model (Conati, 2005). D’Mello (2005) study
reports data to integrate affect-sensing capabilities
into an intelligent tutoring system with tutorial
dialogue, namely AutoTutor. They identified
affective states that occur frequently during learning.
They applied various classification algorithms
towards the automatic detection of the learners affect
from the dialogue patterns manifested in
AutoTutor’s log files.
Unfortunately, many of these of systems lack
precision because they are based on learner self
reports, or use tools to analyze the learner external
behaviour like facial expression (Fan et al., 2003),
vocal tones (D’Mello et al., 2005) or gesture
14
Heraz A. and Frasson C. (2009).
HOW DO EMOTIONAL STIMULI INFLUENCE THE LEARNER’S BRAIN ACTIVITY? - Tracking the Brainwave Frequency Bands Amplitudes .
In Proceedings of the International Conference on Agents and Artificial Intelligence, pages 14-20
DOI: 10.5220/0001558100140020
Copyright
c
SciTePress
recognition (Kort & al., 2001). In addition, one
affective state is not sufficient to encompass the
whole gamut of learning (Conati, 2002).
Our previous work (Heraz & al., 2008); (Heraz
& al., 2007) indicated that an EEG is an efficient
info source to detect emotions. Results show that the
student’s affect (Anger, Boredom, Confusion,
Contempt, Curious, Disgust, Eureka, and
Frustration) can be accurately detected (82%) from
brainwaves (Heraz & al., 2007). We have also
conducted an experimentation in which we explored
the link between brainwaves and emotional
assessment on the SAM scale (pleasure, arousal and
domination). Results were promising, with 73.55%,
74.86% and 75.16% for pleasure, arousal and
dominance respectively (Heraz & al., 2007). Those
results support the claim that all rating classes for
the three emotional dimensions (pleasure, arousal
and domination) can be automatically predicted with
good accuracy through the nearest neighbour
algorithm.
As a contrast to the learner self reports and use
tools to analyze the learner external behaviour; our
previous work is directed towards measuring
emotions from the learner brainwave activity to
track the learner’s emotional states transitions. But
what is the influence of feeling emotions on
Brainwaves? What impact has emotional stimuli on
the amplitudes of the brainwaves frequency bands?
In this paper, we focus on 4 different frequency
bands: delta, theta, alpha and beta. We measure their
amplitudes to identify the predominant learner
mental state corresponding to the highest amplitude.
We use the International Affective Picture System to
induce emotions and we aim to how these effects the
brainwaves amplitudes.
2 BRAINWAVES AND EEG
In the human brain, each individual neuron
communicates with the other by sending tiny
electrochemical signals. When millions of neurons
are activated, each contributing its small electrical
current, they generate a signal that is strong enough
to be detected by an electroencephalogram (EEG)
device (Bear et al., 2001); (Cantor, 1999).
The EEG used in this experimentation is Pendant
EEG. Commonly, Brainwaves are categorized into 4
different frequency bands, or types, known as delta,
theta, alpha, and beta waves. Each of these wave
types often correlates with different mental states.
Table 1 lists the different frequency bands and their
associated mental states.
Table 1: Brainwaves Categories.
Brainwave Frequency Mental State
Delta (δ) 0-4 Hz Deep sleep
Theta (θ) 4-8 Hz
Creativity, dream sleep,
drifting thoughts
Alpha (α) 8-12 Hz
Relaxation, calmness,
abstract thinking
Beta (β) +12 Hz
Relaxed focus, high
alertness, agitation
Delta frequency band is associated with deep
sleep. Theta is dominant during dream sleep,
meditation, and creative inspiration. Alpha
brainwave is associated with tranquillity and
relaxation. By closing one's eyes can generate
increased alpha brainwaves. Beta frequency band is
associated with an alert state of mind, concentration,
and mental activity (Palke, 2004).
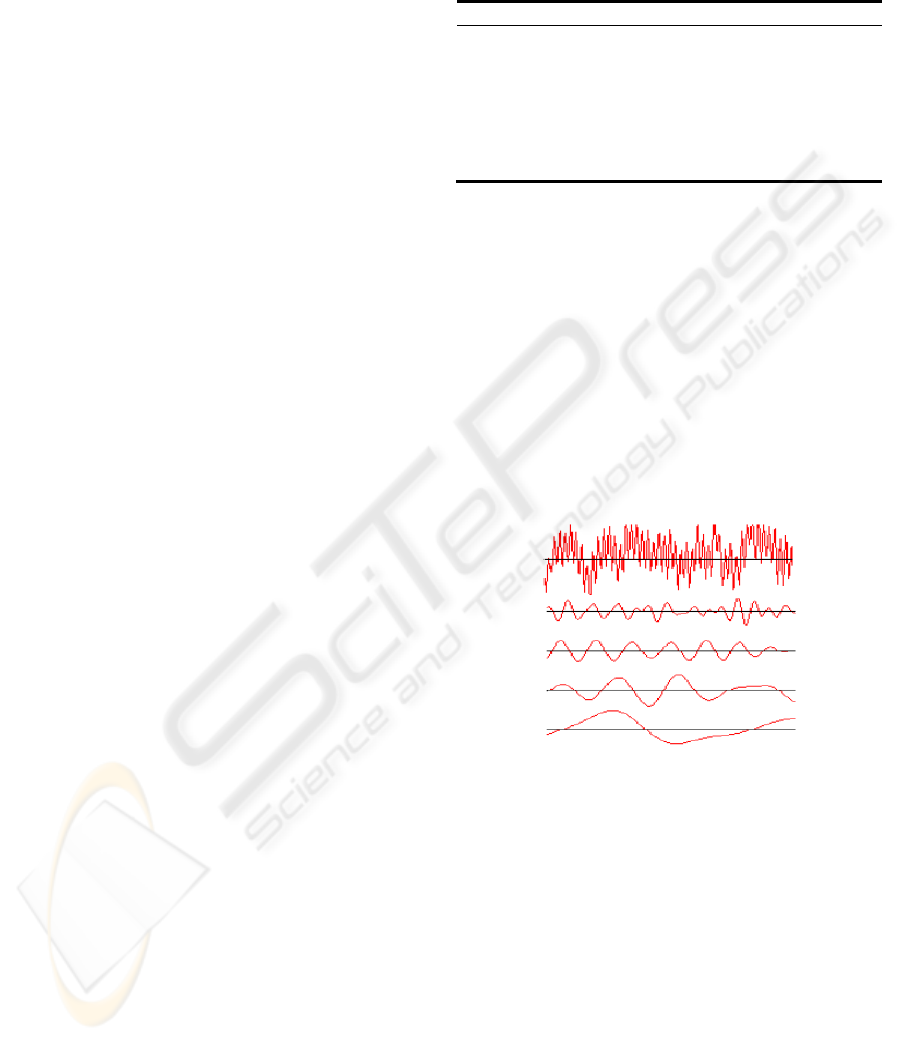
The electrical signal recorded by the EEG is
sampled, digitized and filter to divide it into 4
different frequency bands: Beta, Alpha, Theta and
Delta (Figure 1).
Figure 1: A raw EEG sample and its filtered component
frequencies. Respectively (from the top): Beta, Alpha,
Theta and Delta Brainwaves (Palke, 2004).
3 CATEGORIES IN THE IAPS
The International Affective Picture System (IAPS) is
a large colored bank of pictures. It provides the
ratings of emotions. It includes contents across a
wide range of semantic categories. IAPS is
developed and distributed by the NIMH Center for
Emotion and Attention (CSEA) at the University of
Florida in order to provide standardized database
that are available to researchers in the study of
emotion and attention. IAPS has been characterized
HOW DO EMOTIONAL STIMULI INFLUENCE THE LEARNER’S BRAIN ACTIVITY? - Tracking the Brainwave
Frequency Bands Amplitudes
15
primarily along the dimensions of valence, arousal,
and dominance. Even though research has shown
that the IAPS is useful in the study of discrete
emotions, the categorical structure of the IAPS has
not been characterized thoroughly. Mickels (2005)
experimentation consisted of collecting descriptive
emotional category data on subsets of the IAPS in an
effort to identify pictures that elicit one discrete
emotion more than others. Results revealed multiple
emotional categories for the pictures and indicated
that this picture set has great potential in the
investigation of discrete emotions (Mikels & al.,
2005).
This study provided categorical data that allows
the IAPS to be used more generally in the study of
emotion from a discrete categorical perspective. In
accord with previous reports (Bradley & al., 2001),
gender differences in the emotional categorization of
the IAPS images were minimal. These data show
that there are numerous images that elicit single
discrete emotions and, furthermore, that overall, a
majority of the images elicit either single discrete
emotions or emotions that represent a blend of
discrete emotions, also in accord with previous
reports.
Table 3 shows the categories identified by
Mikel’s study
Table 2: Mikel’s categories for the IAPS.
Category Description
A Anger
D Disgust
F Fear
U Undifferentiated
S Sadness
Am Amusement
Aw Awe
C Contentment
U Undifferentiated
g Pictures that are outside two standard
deviations from the overall mean and may
thus be blends of positive and negative
emotions.
4 EXPERIMENTATION
In our experimentation we use Pendant EEG
(McMilan, 2006), a portable wireless
electroencephalograph. Electrode placement was
determined according to the \10-20 International
System of Electrode Placement." This system is
based on the location of the cerebral cortical regions
Electrodes were placed on PCz, A1 and A2 (Palke,
2004). Pendant EEG sends the electrical signals to
the machine via an infrared connection. Light and
easy to carry, it is not cumbersome and can easily be
forgotten within a few minutes. The learner wearing
Pendant EEG is completely free of his movements:
no cable connects them to the machine. The
experiment included 17 learners selected from the
Computer Science Department of University of
Montreal. In order to induce the emotions which
occur during learning, we use IAPS.
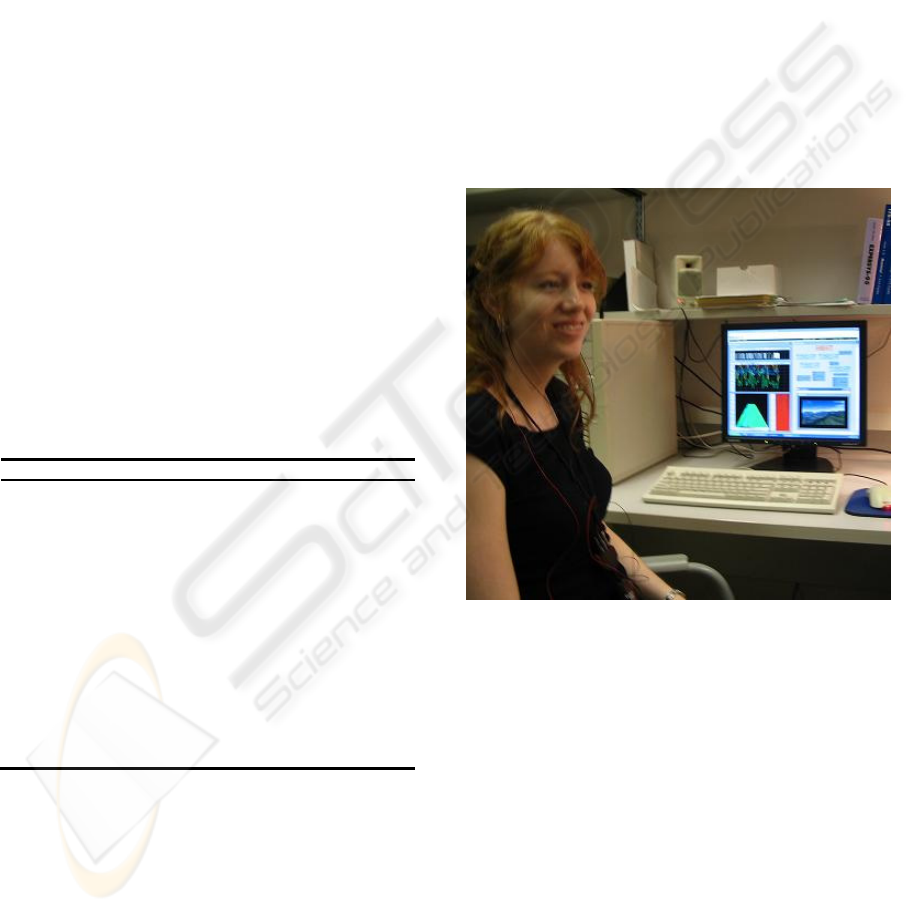
The participant is connected to Pendant EEG.
The duration of the experimentation for each
participant varies between 15 and 20 minutes. This
one is free to stop when he wishes. He's invited to
indicate his emotions any time, whenever it changes
(figure 2).
Figure 2: A learner wearing Pendant EEG.
The purpose of the experimentation is to record
the emotions at each change of brainwave
amplitude. The recording set size is 33106.
5 DATA TREATMENT
Before using the database as an input to several
learning algorithms, preliminary treatments of
formatting, cleaning and selection had to be applied
to it. The initial database was composed of 33106
tuples that contained the user id and the picture
category from IAPS. The first treatment that was
applied to the database was to extract a dataset of
tuples that contain the picture category and the
ICAART 2009 - International Conference on Agents and Artificial Intelligence
16
transition from two vectors
()
1111
,,,
β
α
θ
δ
t
Amp
and
(
)
2222
,,,
β
α
θ
δ
tt
Amp
Δ+
, where
(
)
t
Amp
is the
amplitudes recorded at instant
t
and
(
)
tt
Amp
Δ+
is
the amplitude at
tt Δ+
.
tΔ
(in sec) is the time
between each modification in one of the 4
brainwaves amplitudes.
We also applied some few data cleaning with
respect to picture categories frequencies by
removing every picture categories that had a
frequency inferior to 6. The most represented image
category in the dataset is U (Undifferentiated) which
is more than 4 times more frequent than S (Sadness),
which is the next most frequent one, but since
undifferentiated images appear in the case of
transitions from emotion 5 (disgust) to another, we
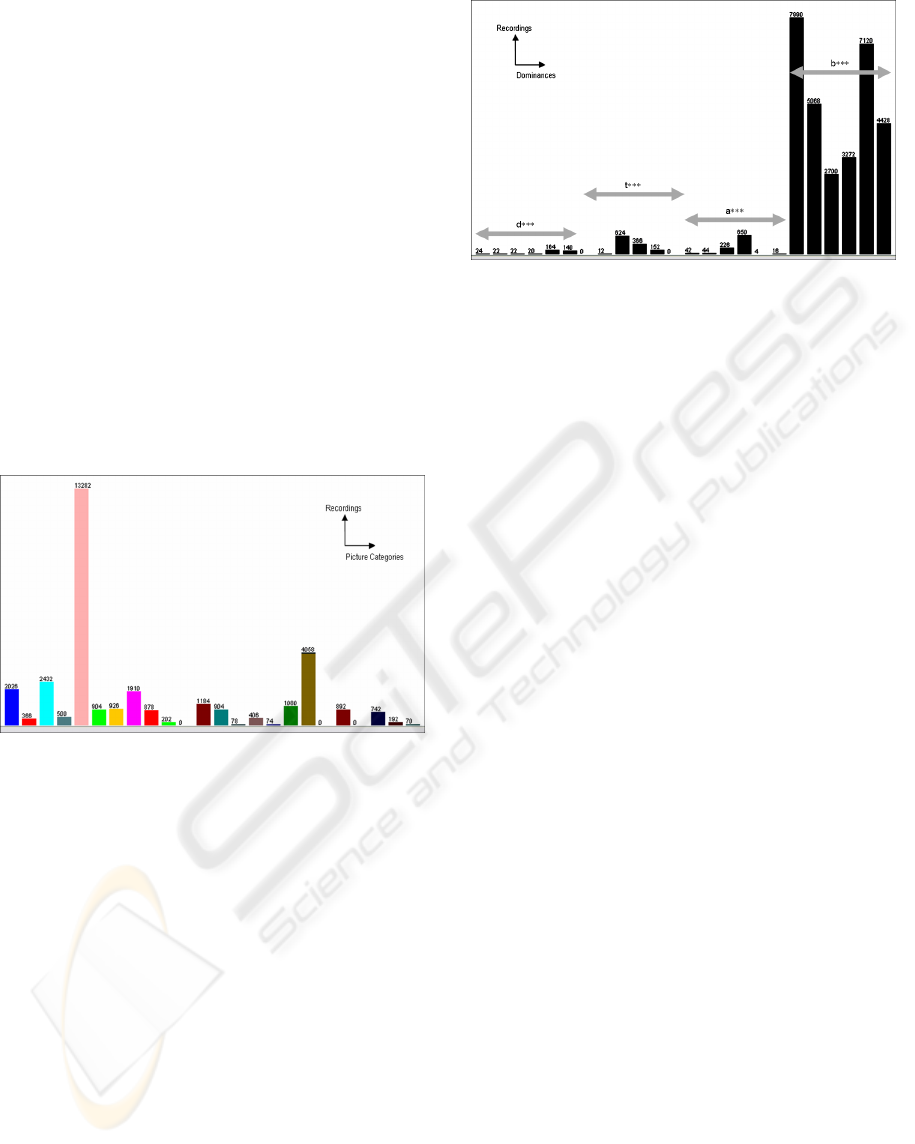
decided to keep that category in the dataset. Figure 3
shows the repartition of pictures categories in the
dataset.
Figure 3: Repartition of picture categories in the dataset;
three empty categories were removed.
The empty categories were: AwAwC, ADF and
AS. They were removed. Most of pictures that the
learners saw were in the categories: U (13282), S
(4058), D (2432), DF (2026) and AwE (1910).
In addition, we created the class
ancedo min
. It
gives the order of the brainwaves amplitudes. Since
we have 4 types of brainwaves frequency bands,
ancedo min
takes 4! =24 different values from the
set
{
}
btaddtbadtab ,...,,
. The value
btda
means
that the first highest amplitude recorded is for beta
brainwave, the second is for theta, the third is for
delta and the fourth one is for alpha. This means that
the predominant mental state is the one associated to
beta. Most of time,
***b
values are predominant,
figure 4 shows that fact.
Figure 4: Dominance Values Repartition.
The percentage of predominance of Delta, Theta,
Alpha and Beta on the 33106 recordings were
respectively: 1,2%, 3,5%, 3% and 92,2%.
6 PREDICTION RESULTS
Determining the impact of emotional stimuli on the
brainwaves is a multi-class classification problem.
The mapping function is:
(
)
ancedopictureCatf min,,,,: →
β
α
θ
δ
For classification we used Weka a collection of
machine learning algorithms for solving data mining
problems implemented in Java and open sourced
under the GPL (Witten & al., 2005).
Many classification algorithms were tested. Best
results were given by Naïve Bayes, K-Nearest
Neighbor and Decision trees (Quinlan, 1993). Table
4 shows the overall classification results using k-fold
cross-validation5 (k = 10). In k-fold cross-validation
the data set (N) is divided into k subsets of
approximately equal size (N/k). The classifier is
trained on (k-1) of the subsets and evaluated on the
remaining subset. Accuracy statistics are measured.
The process is repeated k times. The overall
accuracy is the average of the k training iterations.
The various classification algorithms were
successful in detecting the new dominant value from
the four brainwaves amplitudes and the picture
category. Classification accuracy varies from
78.02% to 93.82%. Kappa statistic measures the
proportion of agreement between two rates with
correction for chance. Kappa scores ranging from
0.4 – 0.6 are considered to be fair, 0.6 – 0.75 are
good, and scores greater than 0.75 are excellent
(Robson, 1993). In the case of the algorithms we
tested Kappa scores vary from 0.73 to 0.92 (good to
excellent). Results are shown on table 4.
HOW DO EMOTIONAL STIMULI INFLUENCE THE LEARNER’S BRAIN ACTIVITY? - Tracking the Brainwave
Frequency Bands Amplitudes
17
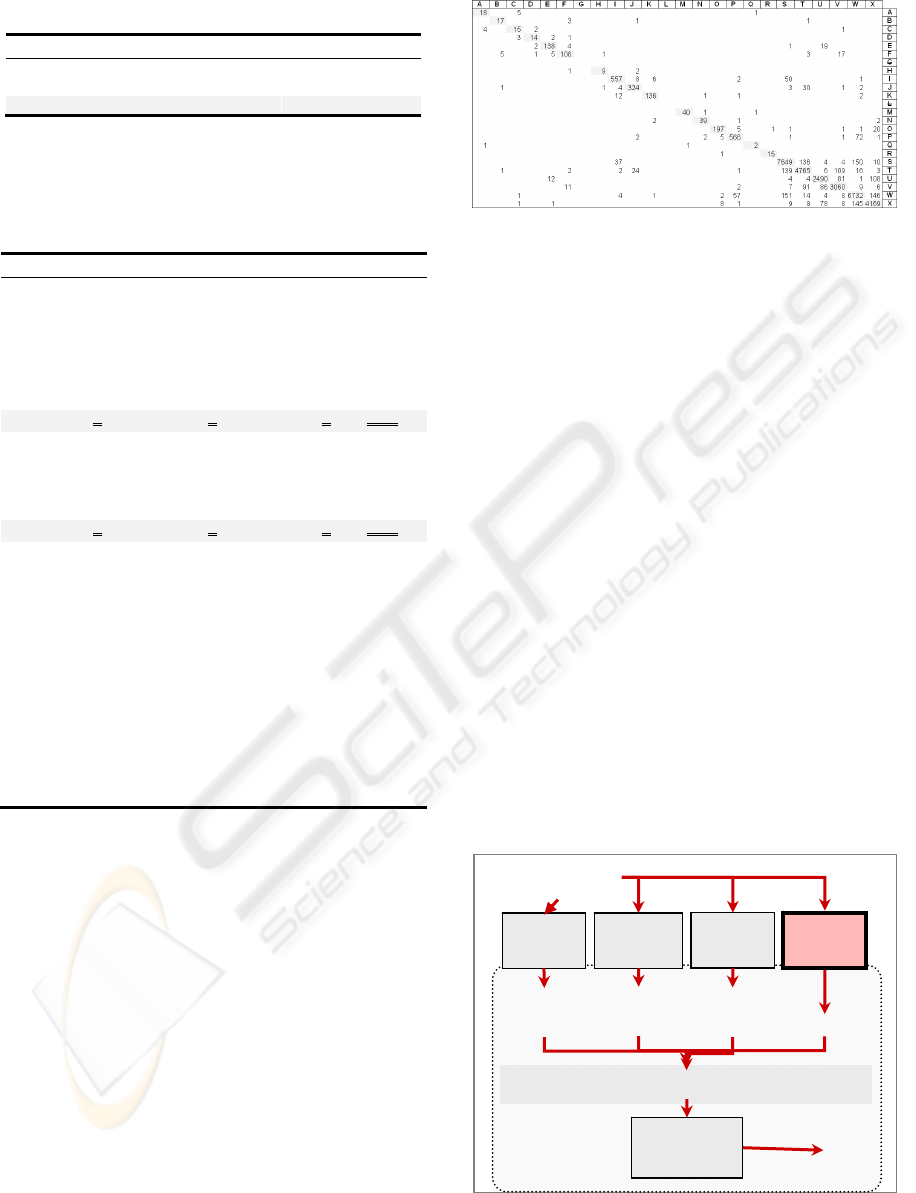
Table 3: the Best Results.
Algorithm
Accuracy Kappa
Naïve Bayes 78.02% 0.73
k-NN (k=1) 92.52% 0.91
Decision Tree 93.82% 0.93
For the decision tree Algorithm, table 4 shows
the details of classification accuracy among the 24
values of the class Dominance.
Table 4: Detailed Accuracy by Class.
Precision Recall F-Measure Class
0.783 0.75 0.766 dtab
0.708 0.773 0.739 dtba
0.6 0.682 0.638 datb
0.737 0.7 0.718 dabt
0.873 0.841 0.857 dbat
0.831 0.771 0.8 dbta
0 0 0 tdab
0.818 0.75 0.783 tdba
0.904 0.893 0.898 tbad
0.898 0.885 0.891 tbda
0.938 0.895 0.916 tabd
0 0 0 tadb
0.976 0.952 0.952 atdb
0.907 0.886 0.897 atbd
0.925 0.872 0.897 abdt
0.89 0.871 0.88 abtd
0.5 0.5 0.5 adtb
0.938 0.938 0.938 adbt
0.954 0.957 0.956 btad
0.943 0.94 0.942 btda
0.927 0.922 0.924 bdat
0.93 0.935 0.933 bdta
0.944 0.946 0.945 batd
0.934 0.942 0.938 badt
For the decision tree algorithm and according to
table 4, we calculated the Youden’s J-index to
increase the weight to the rating classes with
minority instances (Youden, 1961) as the following
formula:
∑
∈
−
=
RCe
e
ecisionRCCardJIndex Pr)(
1
With
)(RCCard
is the cardinality of rating
classes list and is 22 (24-2; we removed the 2 classes
tdab
and
tadb
since they are empty). The JIndex
value is 73.32% which is less (but still good) than
the classification prediction shown in table 4
(93.82%). This result supports the claim that all
rating classes for the 22 classes can be automatically
detected with good accuracy (73.32%) through the
decision tree algorithm.
Figure 5 shows the Confusion Matrix.
Figure 5: The confusion Matrix.
The highest classification rates appear on the
Matrix Diagonal. Two classes were removed:
G=
tdab
and L=
tadb
. They are empty.
7 FUTURE INTEGRATION
In our previous works, we conceived the
Architecture of a multi agent System (MAS) for 3
agents that assess emotional parameters from
brainwaves. Via the JADE (Java Agent
Development Framework) platform (Bellifemine,
1999) and according to the communication language
FIPA-ACL, these agents communicate with the
planner located in the tutoring module of an ITS.
They send to the latter the predicted emotional state.
To complete this work, we aim by doing this
experimentation to extend our MAS in the future
and add the Brainwave Dominance Predictor (BDP)
Agent. BDP Agent will induce emotional stimuli to
regulate the Brainwave Activity. New pedagogical
strategies will be implemented and suggested to an
ITS to improve the learning conditions. Figure 6
shows the overall architecture.
Figure 6: Extended Architecture of the Multi-Agent Brain-
Sensitive System.
PAD-Mental
A
g
ent
Emomental
A
g
ent
Electrical signal
from EEG
Jade Platform
Emotion’s
State
Emotion’s
Assessment
Message Transport Protocol
ITS
BDP
Agent
Planner within
an ITS
Dominance
Qel-Mental
A
g
ent
AMIBEL
Params
ICAART 2009 - International Conference on Agents and Artificial Intelligence
18

The BDP Agent will be implemented within the
MAS in the future.
8 CONCLUSIONS
This study has presented machine learning
techniques to follow and track the learner’s
brainwaves frequency bands amplitudes. It
completes many previous works that assess
emotional parameters from brainwaves by using an
EEG. This can be useful for some particular learners
as taciturn, impassive and disabled learners. We do
not consider the whole cases of disabled learners.
We will consider only disabled learner who cannot
express facial emotions or body gestures due to an
accident or a surgery and also those who lost their
voice or cannot talk. Here we are talking about
physical disability and not mental disability. This
procedure allowed us to record the brainwaves
amplitudes of the learners exposed to emotional
stimuli from the International Picture System. These
data were used to predict the future dominant
amplitude knowing the picture category and the
actual brainwaves frequency band amplitudes.
We acknowledge that the use of EEG has some
potential limitations. In fact, any movement can
cause noise that is detected by the electrodes and
interpreted as brain activity by Pendant EEG.
Nevertheless, we gave a very strict instructions to
our participants. They were asked to remain silent,
immobile and calm. We believe that the instructions
given to our participants, their number (17) and the
database size (33106 records) can considerably
reduce this eventual noise. Results are encouraging,
a potential significant impact of emotional stimuli
and the brainwave amplitudes. The decision tree
analyses resulted in accurate predictions 93.82% and
the Yuden’s J-Index is 73.22%. If the method
described above proves to be effective in tracking
the learner’s brainwaves amplitudes, we can direct
our focus to a second stage. An ITS would select an
adequate pedagogical strategy that adapt to certain
learner’s mental states correlated to the brainwaves
frequency bands in addition to cognitive and
emotional states. This adaptation would increase the
bandwidth of communication and allow an ITS to
respond at a better level. If this hypothesis holds in
future replication, then it would give indications on
how to help those learners to induce positive mental
states during learning.
ACKNOWLEDGEMENTS
We acknowledge the support of the FQRSC (Fonds
Québécois de la Recherche sur la Société et la
Culture) and NSERC (National Science and
Engineering Research Council) for this work.
REFERENCES
Bear, M.F., Connors, B.W., Paradiso, M. A, 2001.
Neuroscience: Exploring the Brain, second ed.
Lippincott Williams & Williams, Baltimore, MD.
Bellifemine, F., Poggi, A., Rimassa, G., 1999. JADE - A
FIPA-compliant Agent Framework, In PAAM'99,
London, UK.
Bradley, M.M., Codispoti, M., Cuthbert, B.N., Lang, P.J.,
2001. Emotion and motivation: Defensive and
appetitive reactions in picture processing. Emotion, 1.
Cantor, D.S., 1999. An overview of quantitative EEG and
its applications to neurofeedback. In Introduction to
Quantitative EEG and Neurofeedback. J. R. Evans and
A. Abarbanel, Eds. Academic Press.
Conati, C., 2002. Probabilistic assessment of user's
emotions in educational games. Journal of Applied
Artificial Intelligence.
Conati, C., 2004, How to evaluate models of user affect?
In Proceedings of ADS 04, Tutorial and Research
Workshop on Affective Dialogue Systems. Kloster
Irsee, Germany.
Conati, C., Mclaren H., 2005. Data-driven Refinement of a
Probabilistic Model of User Affect. In Proceedings of
UM2005 User Modeling: Proceedings of the Tenth
International Conference, Lecture Notes in Computer
Science, Springer Berlin / Heidelberg..
D'Mello, S.K., Craig, S.D., Gholson, B., Franklin, S.,
Picard, R.W., Graesser, A.C., 2005. Integrating Affect
Sensors in an Intelligent Tutoring System. In Affective
Interactions: The Computer in the Affective Loop
Workshop at 2005 International conference on
Intelligent User Interfaces. AMC Press, New York.
Ekman, P., 1992. Are there basic emotions? Psychological
Review.
Fan, C., Sarrafzadeh, A., Overmyer, S., Hosseini, H. G.,
Biglari-Abhari, M., Bigdeli, A., 2003. A fuzzy
approach to facial expression analysis in intelligent
tutoring systems. In Antonio Méndez-Vilas and
J.A.Mesa González Eds.
Heraz, A., Frasson, C., 2008. Predicting the three major
dimensions of the learner’s emotions from brainwaves.
International Journal of Computer Science.
Heraz, A., Razaki, R. Frasson, C., 2007. Using machine
learning to predict learner emotional state from
brainwaves. 7th IEEE conference on Advanced
Learning Technologies: ICALT2007, Niigata, Japan.
Kort, B., Reilly, R., Picard, R., 2001. An affective model
of interplay between emotions and learning:
Reengineering educational pedagogy—building a
learning companion. In T. Okamoto, R. Hartley,
HOW DO EMOTIONAL STIMULI INFLUENCE THE LEARNER’S BRAIN ACTIVITY? - Tracking the Brainwave
Frequency Bands Amplitudes
19

Kinshuk, & J. P. Klus (Eds.), Proceedings IEEE
International Conference on Advanced Learning
Technology.
Mandler, G., 1999. Emotion. In B. M. Bly & D. E.
Rumelhart (Eds.), Cognitive science. Handbook of
perception and cognition 2nd ed. San Diego, CA:
Academic Press.
McMilan, B., 2006. www.pocket-neurobics.com.
Mikels J.A., Fredrickson, B. L., Larkin, G.R., Lindberg,
C.M., Maglio, S.J., Reuter-Lorenz, P.A., 2005.
Emotional category data on images from the
International Affective Picture System, Behav Res
Methods 37.
Palke, A., 2004. Brainathlon: Enhancing Brainwave
Control Through Brain-Controlled Game Play. Master
thesis, Mills College, Oakland, California, USA.
Panksepp, J., 1998. Affective neuroscience: The
foundations of human and animal emotion. New York:
Oxford University Press.
Picard, R. W., 1997. Affective computing. Cambridge,
Mass: MIT Press.
Quinlan, R., 1993. C4.5: Programs for Machine Learning.
San Mateo, CA: Morgan Kaufmann Publishers.
Robson C., 1993. Real word research: A resource for
social scientist and practitioner researchers. Oxford:
Blackwell.
Witten, I.H., Frank, E., 2005. Data Mining: Practical
Machine Learning Tools and Techniques with Java
Implementations. Morgan Kaufmann, San Francisco.
Youden, W.J., 1961. How to evaluate accuracy. Materials
Research and Standards, ASTM.
ICAART 2009 - International Conference on Agents and Artificial Intelligence
20
