
DRUG ADDICTION: A COMPUTATIONAL MULTISCALE
MODEL COMBINING NEUROPSYCHOLOGY,
COGNITION AND BEHAVIOR
Yariv Z. Levy
1,∗
, Dino Levy
2,∗
, Jerrold S. Meyer
3
and Hava T. Siegelmann
1
1
Laboratory of Biologically Inspired Neural and Dynamical Systems (BINDS), University of Massachusetts Amherst, U.S.A.
2
Department of Neurobiology, The Weizmann Institute of Science, Rehovot, Israel
3
Laboratory of Developmental Neuropharmacology, University of Massachusetts Amherst, U.S.A.
Keywords:
Addiction, Multiscale Modeling, Bio-signal Modeling, Behavioral Processes, Cognitive Processes, Neuro-
physiological Processes.
Abstract:
According to the United Nations, approximately 24.7 million people used amphetamines, 16 million used
cocaine, and 12 million used heroin in 2006/07 (Costa, 2008). Full recovery from drug addiction by chemical
treatment and/or social and psychological support is uncertain. The present investigation was undertaken to
expand our understanding of the factors that drive the dynamics of addiction. A new multiscale computational
model is presented which integrates current theories of addiction, unlike previous models, considers addiction
as a reversible process (Siegelmann, 2008). Explicit time dependency is added to the inhibition and the
compulsion processes. Preliminary computational predictions of drug-seeking behavior are presented and
potential correlation with experimental data is discussed. Validation of the model appears promising, however
additional investigation is required.
1 INTRODUCTION
Drug addiction is a global problem. Historically, ad-
dicted people have been simply considered to be lack-
ing the willpower to quit. But the prevailing view has
changed in response to scientific studies which show
that addiction correlates with social, psychological,
and physiological factors. Addiction is now classi-
fied as a disease, a “bio-psycho-social-spiritual disor-
der” (Interlandi, 2008), but the underling causes and
prospects for full recovery remain uncertain. Compu-
tational models for addictive behavior could assist in
this quest for understanding.
Many computational models of addiction have
been proposed and applied in order to provide a bet-
ter understanding of factors which affect the nature
of the addictive process. The relevant literature in-
cludes two types of models: one deals with either be-
havior acquisition or behavior maintenance of drug
self-administration, and the other integrates both ac-
quisition and maintenance based on machine learning
or neuronal network dynamical approaches (Ahmed
et al., 2007). Both model types share the common
∗
Authors with equal contributions.
assumption that addiction is a non-reversible process,
and hence can not describe experimental observations
which support possible recovery (Winick, 1962; So-
bell et al., 2000). A new model of addiction, the
“dynamical addict”, takes into account both relapse
and rehabilitation processes (Siegelmann, 2008). This
approach considers addiction as a dynamical system
where actual addiction behavior and processes of in-
hibition and compulsion are separated. Unlike other
computational and mathematical models, it does not
condemn the addict to a monotonic worsening of the
addictive condition. Moreover, temporal parameters
are introduced to quantify the virtual subject’s level
of cognitive rationality and levels of feedback param-
eters that make addiction so difficult to defeat.
The present investigation was undertaken to de-
scribe this new model in terms of neuropsychological,
cognitive, and behavioral observations, to incorporate
the temporal dimension within the processes of inhi-
bition and compulsion, and to present a preliminary
correlation between synthetic data presented in this
work and empirical data found in the literature.
87
Levy Y., Levy D., Meyer J. and T. Siegelmann H. (2009).
DRUG ADDICTION: A COMPUTATIONAL MULTISCALE MODEL COMBINING NEUROPSYCHOLOGY, COGNITION AND BEHAVIOR.
In Proceedings of the International Conference on Bio-inspired Systems and Signal Processing, pages 87-94
DOI: 10.5220/0001539100870094
Copyright
c
SciTePress
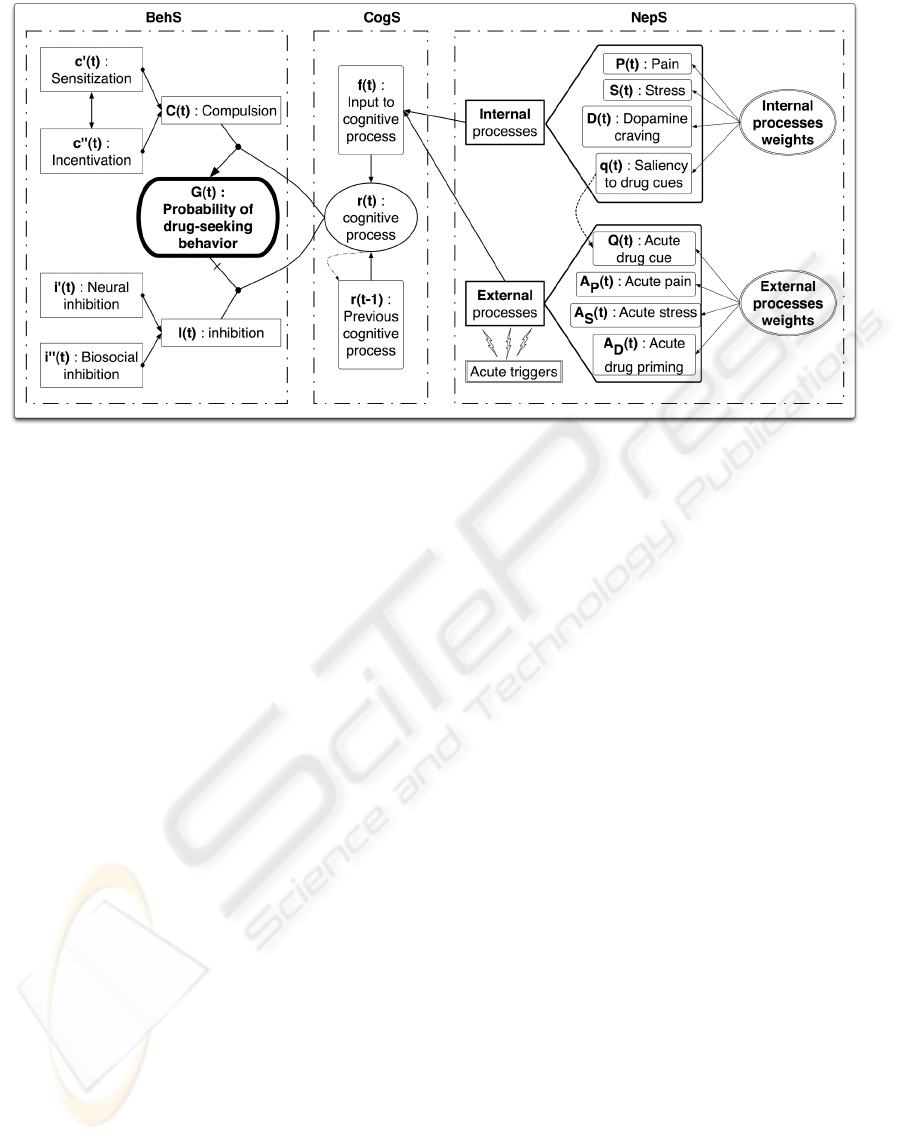
Figure 1: Addiction model combining neuropsychological (NepS), cognitive (CogS), and behavioral (BehS) scales. The
output G(t) is the likelihood of drug-seeking behavior.
2 DESCRIPTION OF THE MODEL
This section describes the multiscale framework for
formulating this new addiction model (Siegelmann,
2008). The model can be considered to comprise
three resolution scales: neuropsychological (NepS),
cognitive (CogS), and behavioral (BehS) scales as
shown in Figure 1. The original formulation of the
model’s output is the likelihood of drug-seeking
behavior G(t):
G(t) = (1 − r(t)) · (−C) + r(t) · I (1)
where r(t) is a cognitive parameter defined below in
Section 2.2, and C and I are behavioral processes with
longer time scales than r which are approximated by
constants.
The output of the model, G(t), is generated at the
BehS. The BehS is composed of inhibition I and com-
pulsion C signals that respectively prevent and en-
courage drug-seeking behavior. The balance between
I and C is modulated by the CogS, which is mainly
intended to integrate the information coming from the
NepS where internal and external processes are com-
puted and weighted.
The remainder of this section presents further details
of the model parameters. The following two sub-
sections 2.1 and 2.2 present a brief review of the
original model from a multi-scale viewpoint. This is
followed by a sub-section 2.3 which introduces inhi-
bition and compulsion as dynamical time-dependent
processes.
2.1 Neuropsychological Scale (NepS)
The NepS consists of effects which are dependent on
the internal state of the virtual subject as well as acute
external effects. How these internal and external pro-
cesses behave is summarized in Table 1 with corre-
sponding mathematical details in the Appendix.
Internal processes are considered to include P(t),
S(t), D(t) and q(t). P(t) denotes the level of pain
or negative consequences, in areas such as health or
social relations; which are increased by drug intake
(De Alba et al., 2004). S(t) denotes the level of stress
or the negative emotional state of the virtual subject.
S(t) increases during withdrawal periods (Hodgins
et al., 1995; Koob and Le Moal, 2001; Aston-Jones
and Harris, 2004) and may trigger craving (Stewart,
2000). D(t) denotes the level of current craving which
depends on dopamine transmission in the nucleus ac-
cumbens (NAc). Finally, q(t) denotes the saliency
of drug-associated cues that increase with repeated
drug consumption. When considering drug addic-
tion as a disease of the learning and memory mech-
anism (Hyman, 2005), repeated learning results in a
stronger association between the stimuli and the re-
wards, causing a sensitized saliency for drug associ-
ated cues (Robinson and Berridge, 2003). The sig-
nal q(t) defines the initial value of the drug-associated
cue Q(t) when it is encountered, as described below.
BIOSIGNALS 2009 - International Conference on Bio-inspired Systems and Signal Processing
88

Table 1: Effects of G(t), the likelihood of drug-seeking behavior, on internal and external processes for NepS.
Processes behavior when G(t) > 0 behavior when G(t) < 0
Internals
S(t) exponentially increases exponentially decreases
P(t) exponentially decreases exponentially increases
D(t)
starting from the change in the sign of G(t),
exponentially increases
from negative to positive,
D(t) exponentially increases for a fixed
number of time steps, then exponentially decreases
q(t)
starting from the change in the sign of G(t),
exponentially increases
from negative to positive,
q(t) stays constant for a fixed
number of time steps, then exponentially decreases
Externals
A
S
(t) can be triggered can NOT be triggered
A
P
(t) can NOT be triggered can be triggered
A
D
(t) can be triggered can NOT be triggered
Q(t) can be triggered - its initial value depends on q(t)
External processes are considered to include
A
P
(t), A
S
(t), A
D
(t) and Q(t). A
P
(t) denotes a
painful trauma that may cause an addict to stop tak-
ing drugs immediately (Bradby and Williams, 2006;
Barth et al., 2006); A
S
(t) denotes a stressful episode
that leads to immediate drug use (Erb et al., 1996;
Sinha et al., 2000); A
D
(t) denotes drug priming that
could reinstate drug use again (de Wit and Stewart,
1983; Spealman et al., 1999); and Q(t) denotes a
drug-associated cue that may be triggered, for ex-
ample, by visiting a particular friend who uses that
drug (See, 2002). If an event Q(t) is encountered, the
saliency of this signal is defined by the value of q(t).
When any of these external processes is triggered, its
value jumps to a fixed value, stays constant for a num-
ber of time steps, and then decreases exponentially. If
this external process is triggered again before its pre-
vious effect disappears, it reverts to its initial value,
stays constant for a number of time steps and then de-
creases exponentially.
2.2 Cognitive Scale (CogS)
The CogS mediates between low and high level con-
trols of behavior. As such, it computes the cognitive
rationality factor r(t) and the input to the cognitive
rationality f (t) (Siegelmann, 2008). The parameter
r(t) characterizes the activity of the addiction-related
neuronal patterns: low levels cause compulsion to
dominate and the value of G(t) to decrease, and
high levels cause inhibition to dominate and G(t)
to increase. The value of r(t) at any instant is a
combination of the previous value of the cognitive
process r(t −1) and the input to the cognitive process
f (t):
r(t) =
1
2
tanh
α · r(t − 1) + β · f (t) + γ
+
1
2
(2)
where r ∈ [0, 1], and α, β, and γ are constants.
The input to the cognitive process f (t) can be ex-
pressed as a weighted sum of the internal processes,
that make addiction so difficult to overcome, and the
external processes that have a strong but temporary
effect:
f (t) =
h
ω
P
P(t) − ω
S
S(t) − ω
D
D(t)
i
+ (3)
h
ω
A
A
P
(t) − A
S
(t) − A
D
(t)
− ω
Q
Q(t)
i
where ω
S
, ω
P
, and ω
D
are the constants weighting
factors for S(t), P(t), and D(t), respectively; ω
A
is the
constant weighting factor for A
P
(t), A
S
(t), and A
D
(t);
and ω
Q
is the constants weighting factor for Q(t).
2.3 Behavioral Scale (BehS)
The global output from the model G(t) computed in
the BehS is the likelihood of drug-seeking behavior.
G(t) indicates whether the virtual subject is more
or less likely to manifest behavior inducing drug
intake at time t according to Equation 1, which can
be readily modified to include time dependence:
G(t) = (1 − r(t)) · (−C(t)) + r(t) · I(t) (4)
Here G(t) ∈ [−1, 1], I(t) represents the time-
dependant inhibition, and C(t) the time-dependant
DRUG ADDICTION: A COMPUTATIONAL MULTISCALE MODEL COMBINING NEUROPSYCHOLOGY,
COGNITION AND BEHAVIOR
89

compulsion as defined below. For G(t) > 0 the
virtual subject is less likely to have an episode of
drug-seeking behavior (healthy behavior), whereas
for G(t) < 0 the virtual subject is more likely to ex-
hibit drug-seeking behavior (maladaptive behavior).
The overall inhibition I(t) is the arithmetical
mean of inhibitions i
0
(t) and i
00
(t). Inhibition i
0
(t) is
related to the virtual subject’s neural development
of the frontal lobes of the cortex (Durston et al.,
2002; Leon-Carrion et al., 2004; Blakemore and
Choudhury, 2006), given by:
i
0
(t) =
1 − e
β
1
d
· i
0
max,s
1
if t < s
1
i
0
(t − 1) + (2d − 1)δ
s
2
if t < s
2
i
0
max
− (i
0
max
− i
0
0
)e
−β
2
d
if t < s
3
i
0
(t − 1) else
(5)
where s
1
, s
2
and s
3
correspond to developmental
changes age from birth to childhood (s
1
), to puberty
(s
2
), to adulthood (s
3
); β
1
and β
2
are constants; i
0
max,s
1
is the maximum value of i
0
(t) for age stage s
1
; i
0
max
is the maximal value of i
0
(t); δ
s
2
is the maximal
increase of i
0
(t) during age stage s
2
; d is the number
of time steps after a change in the age stage s
1
, s
2
and
s
3
; and i
0
0
is the value i
0
(d).
The inhibition i
00
(t) is ascribable to social rules
governing the society in which the virtual subject is
living. We assume i
0
(t) a sinusoidal function bounded
by two exponential functions:
i
00
(t) =
1 − e
−χ
e
t
2
[(χ
h
− χ
l
)sin(χ
s
t) + χ
h
+ χ
l
] (6)
where χ
e
is a constant, χ
h
is the asymptote of the
higher exponential function that bounds i
00
(t), χ
l
is
the asymptote of the lower exponential function that
bounds i
00
(t) and χ
s
is the angular frequency whose
value is changed randomly. Random noise is added to
i
0
(t) and i
00
(t).
The compulsion C(t) is the arithmetical mean
of c
0
(t) and c
00
(t) which are computed according
to the “incentive-sensitization theory of addiction”
(Robinson and Berridge, 1993). This theory assumes
that the neural substrate of the subject using drugs for
the first few times becomes more sensitive to the drug
by assigning high saliency to drug-related inputs,
and this saliency alteration is then the instigator to
the compulsive behavior to repetitive drug intakes.
According to this theory, the first step is the pleasure
phase, during which the subject increasingly enjoys
drug effects. The second step is the wanting phase
during which the subject changes behavior in order
to obtain more and more of the drug. The parameter
c
0
(t) describes the sensitization (liking) process and
the parameter c
00
(t) describes the incentive (wanting)
process:
c
0
(t) =
c
0
h
− (c
0
h
− c
0
0
)e
−γd
if G(t) < 0
and τ
G
= 0
c
0
l1
+
c
0
l1
− c
0
0
e
−β
1
d
if G(t) < 0
and τ
G
= 1
c
0
l2
+
c
0
l2
− c
0
0
e
−β
2
d
if G(t) > 0
and τ
G
= 1
c
0
(t − 1) else
(7)
and
c
00
(t) =
c
00
h1
− (c
00
h1
− c
00
0
)e
−γ
1
d
if G(t) < 0
and τ
G
= 0
c
00
h2
− (c
00
h2
− c
00
0
)e
−γ
2
d
if G(t) < 0
and τ
G
= 1
c
00
l
+ |c
00
l
− c
00
0
|e
−βd
if G(t) > 0
and τ
G
= 1
c
00
(t − 1) else
(8)
where c
0
h
, c
0
l1
, c
0
l2
, c
00
h1
, c
00
h2
and c
00
l
are maximal and
minimal values of respectively c
0
(t) and c
00
(t); γ, γ
1
,
γ
2
, β, β
1
and β
2
are constants; τ
G
is a binary value set
to 1 when G(t) < 0 for a number of time steps; d is
the number of time steps after a change in the sign of
G(t) or the value of τ
G
; c
0
0
= c
0
(d) and c
00
0
= c
00
(d).
Random noise is added to both signals.
3 EXPERIMENTAL EVALUATION
Drinking, smoking, and drug use are serious prob-
lems among college students and can cause addiction.
A preliminary experimental evaluation of our model
has been performed in order to characterize such be-
havior. We begin by describing the onset and main-
tenance of addictive behavior in G.D., a college-age
virtual male subject who had a healthy physical and
mental development.
The evolution of G.D.’s inhibition I(t) up to age
25 is shown in Figure 2. Here i
0
(t) is the inhibi-
tion related to his neural development, and i
00
(t) is
the inhibition related to the social rules present in his
BIOSIGNALS 2009 - International Conference on Bio-inspired Systems and Signal Processing
90
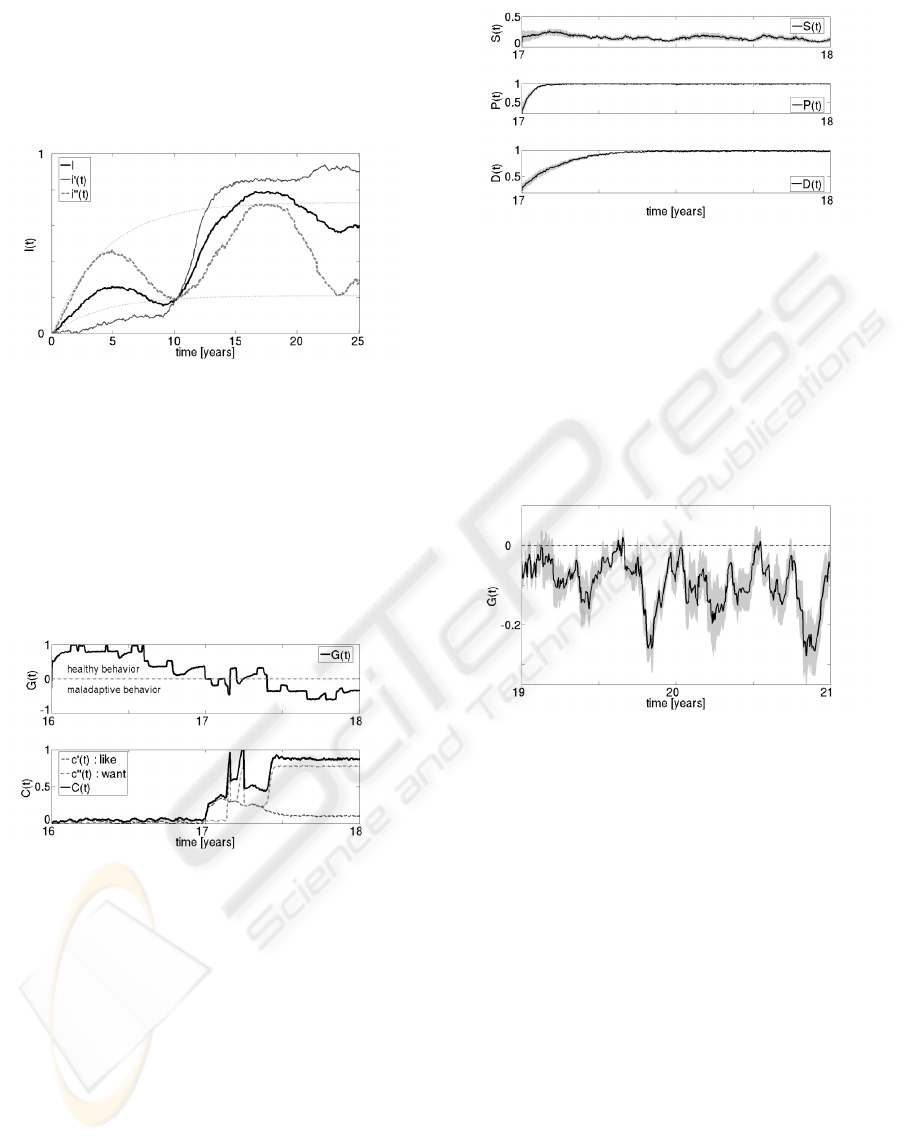
environment. Note that the neural related inhibition
i
0
(t) undergoes an abrupt transformation after age 10,
whereas the inhibition i
00
(t) fluctuates between two
exponential curves that represent the minimum and
maximum inhibitions in G.D.’s social environment.
Figure 2: Evolution of G.D.’s inhibition I(t) from birth to
age 25: i
0
(t) is the inhibition related to neural development,
and i
00
(t) is the inhibition related to the social environment.
G.D. had his first encounter with drugs at age 17.
The evolution of his drug-seeking behavior G(t) and
his compulsion C(t), between the ages of 16 and 18,
are shown in Figure 3. Note that the sign of G(t)
changes form positive to negative at age 17, and how
the incentive and sensitization processes c
0
(t) and
c
00
(t) change their trajectories.
Figure 3: G(t) (upper curve) and C(t) (lower curve) for
G.D. from age 16 to 18. Also included are incentive
c
0
(t) and the sensitization c
00
(t) processes (Robinson and
Berridge, 1993).
As a further check of the model, we used the same
I(t) and C(t) signals and performed 10 different sim-
ulations to compute G(t) and also the other signals.
Figures 4 to 6 show the means of these signals as well
as the standard errors of the mean (SEM). The evolu-
tion of G.D.’s internal processes S(t), P(t) and D(t)
at the age of 17 when he begins to take drugs and be-
comes addicted is shown in Figure 4. The level of
negative consequences in areas such as health or so-
cial relations P(t) and the dopamine-related craving
D(t) have low values at the beginning of the addictive
experience, and then progressively increase to steady
values.
Figure 4: Means and SEMs of the internal processes S(t),
P(t), and D(t) for G.D. from age 17 to 18 (10 simulations).
In the years following his encounter with addic-
tion, G.D. exemplifies the drug-seeking behavior of
someone who is unsuccessfully trying to quit using
drugs. This relapse pattern, which is a fundamental
characteristic of addiction, is apparent in Figure 5,
which shows the mean values of G(t) over 10 sim-
ulations and the corresponding SEM, from age 19 to
21.
Figure 5: G(t) mean and SEM for 10 simulations. Between
ages 19 to 21, G.D. shows a continuous relapse pattern of
a person unsuccessfully trying to escape from drug-seeking
behavior.
G.D.’s internal processes for this same period are
shown in Figure 6. Acute traumas A
P
(t) bring him
towards a healthy behavior, but he is unable to over-
come addiction because of the drug-associated cues
Q(t). As G(t) < 0 the value of q(t) increases, and
A
S
(t) and A
D
(t) can not occur.
This particular case exemplifies a college-age stu-
dent who has his first encounter with drugs at the age
of 17. Initially G.D. enjoyed the drug, but his enjoy-
ment progressively decreased as his desire increased.
This dynamic behavior is due to the negative effect of
Q(t) being stronger than the positive effect of A
P
(t).
Our model is not limited to monotonic non-
reversible processes. Another example with a health-
ier dynamic is shown in Figure 7. In this case, the
virtual male subject, we call V.R. has job-related dif-
ficulties following his 36th birthday. The acute stress
episodes he experiences at his workplace makes V.R.
more vulnerable to addiction. Over a period of several
DRUG ADDICTION: A COMPUTATIONAL MULTISCALE MODEL COMBINING NEUROPSYCHOLOGY,
COGNITION AND BEHAVIOR
91
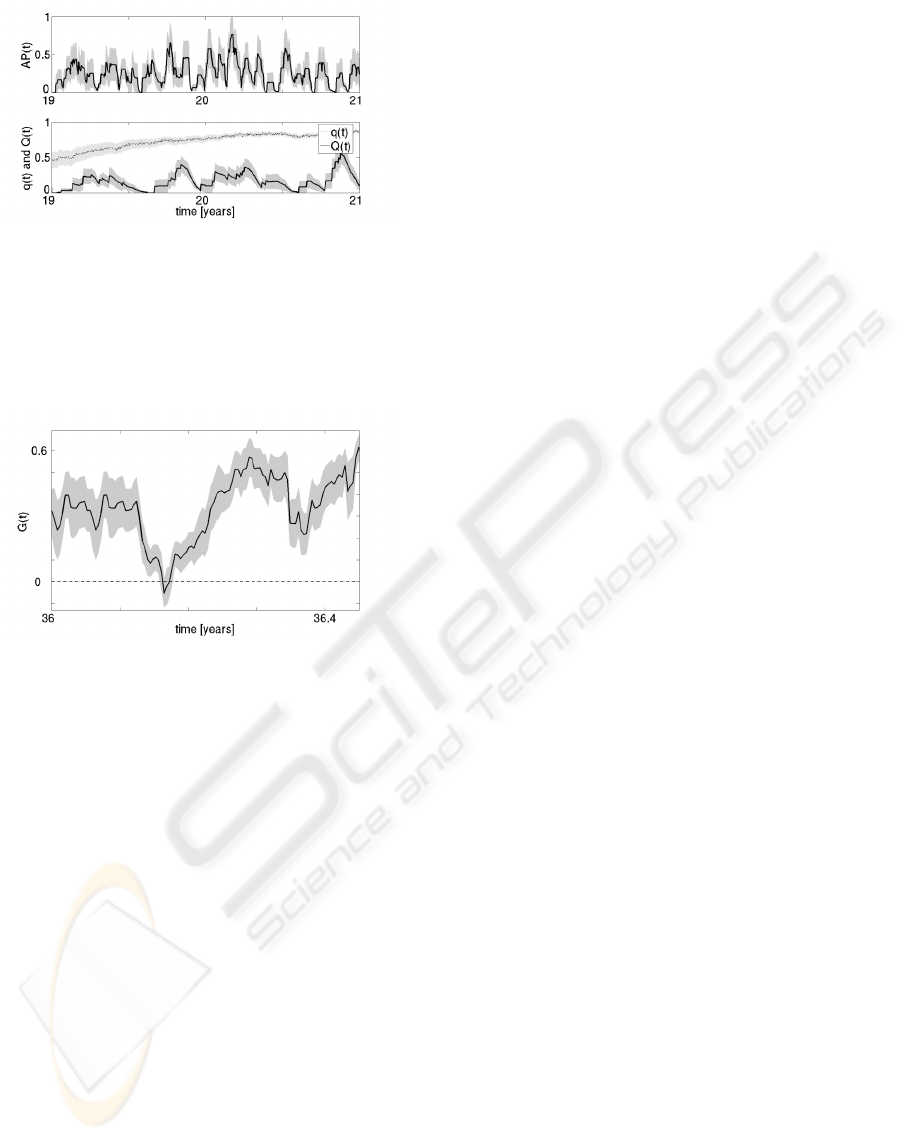
Figure 6: Acute pain A
P
(t) (upper curve), and drug-
associated cues Q(t) and their saliency value q(t) (lower
curves) mean and SEM over 10 simulations for G.D. be-
tween ages 19 to 21.
days, his G(t) value decreases and becomes negative,
but acute episodes of pain make his G(t) value posi-
tive again and his behavior is healthy again.
Figure 7: G(t) mean and SEM over 10 simulations for V.R.
for 5 months following his 36th birthday. His drug-seeking
behavior changes from healthy to maladaptive and back to
healthy.
4 DISCUSSION
The present paper introduces a multi-scale approach
to the modeling of addiction while also incorporat-
ing time dependence to the inhibition and the com-
pulsion processes. A fundamental issue is evaluating
the model’s ability to mimic experimental data. The
first step in this endeavor is to assess whether the cal-
culated likelihood of drug-seeking behavior G(t) is
suitable for describing actual addictive behavior.
Computed values for the likelihood of drug-
seeking G(t) give rise to specific patterns or trajecto-
ries of behavior. For example, it was shown that over
4 years, a group of college-age occasional smokers
is likely to evolve into three categories: 45% of the
subjects are likely to become nonsmokers, 35% oc-
casional smokers, and 20% daily smokers (Kenford
et al., 2005). Another investigation classifies drink-
ing trajectories of first year college students into five
groups: light drinkers the whole year (light-stable),
light drinkers the whole year but with a considerable
increase during holidays (light-stable plus high hol-
iday), initial moderate drinkers who increased their
consumption during the year (medium-increasing),
initial heavy drinkers who decreased their consump-
tion during the year (high-decreasing), and finally
heavy drinkers during the whole year (heavy-stable)
(Greenbaum et al., 2005).
The drug-seeking behavior profile of virtual sub-
ject G.D. presented in Figure 5 suggests a person in
the “light-stable plus high holiday” group cited above.
This parallelism can be made under the assumption
that G.D.’s birthday is in September. Within this con-
text, associations between local minima of G(t) and
holiday periods seem reasonable with respect to time
and the absolute values of G(t). The two local minima
prior to G.D.’s 20
th
and 21
th
birthdays may be consid-
ered to occur in the summer, and the two local minima
around ages 19.5 and 20.5 during winter breaks. Also
associations between local maxima of G(t) and par-
ticularly intense periods of the school year seem rea-
sonable. Local maxima prior to G.D.’s 20
th
and 21
th
birthdays may be considered to occur during exam-
ination periods. It is reasonable to associate G.D.’s
profile with the profile of a student which tends to
decrease his drinking consumption during periods re-
quiring more responsibility, and to increase consump-
tion during more serene periods.
Preliminary results presented in this paper suggest
that the “dynamical addict” model could provide a
complementary view to existing computational mod-
els toward a better understanding of addiction and its
dynamical properties. Future work will concentrate
on more extensive comparisons with real data as well
as the integration of an additional neurophysiological
scale.
ACKNOWLEDGEMENTS
We thank Jung Yi, Kun Tu, and Gal Niv for their
valuable assistance, and also the paper reviewers for
their constructive comments. Scientific suggestions
by Pascal Steiner and Lisa Scott were incorporated in
this paper, and we are thankful for their advice. This
research was sponsored in part by Office of Naval Re-
search Grant #N00014-07-1-0009.
REFERENCES
Ahmed, S. H., Bobashev, G., and Gutkin, B. S. (2007). The
simulation of addiction: Pharmacological and neu-
rocomputational models of drug self-administration.
Drug Alcohol Depen, 90(2-3):304–311.
BIOSIGNALS 2009 - International Conference on Bio-inspired Systems and Signal Processing
92

Aston-Jones, G. and Harris, G. C. (2004). Brain substrates
for increased drug seeking during protracted with-
drawal. Neuropharmacology, 47 Suppl 1:167–79.
Barth, J., Critchley, J., and Bengel, J. (2006). Efficacy of
psychosocial interventions for smoking cessation in
patients with coronary heart disease: a systematic re-
view and meta-analysis. Ann Behav Med, 32(1):10–
20.
Blakemore, S.-J. and Choudhury, S. (2006). Development
of the adolescent brain: implications for executive
function and social cognition. J Child Psychol Psy-
chiatry, 47(17):296–312.
Bradby, H. and Williams, R. (2006). Is religion or culture
the key feature in changes in substance use after leav-
ing school? young punjabis and a comparison group
in glasgow. Ethn Health, 11(3):307–24.
Costa, A. M. (2008). Executive summary. In Office on
Drugs and Crime World Drug Report 2008. United
Nations.
De Alba, I., Samet, J. H., and Saitz, R. (2004). Burden
of medical illness in drug- and alcohol-dependent per-
sons without primary care. Am J Addict, 13(1):33–45.
de Wit, H. and Stewart, J. (1983). Drug reinstatement of
heroin-reinforced responding in the rat. Psychophar-
macology (Berl), 79(1):29–31.
Durston, S., Thomas, K. M., Yang, Y., Ulug, A. M., Zim-
merman, R. D., and Casey, B. J. (2002). A neural
basis for the development of inhibitory control. Dev
Sci, 5(4):F9–F16.
Erb, S., Shaham, Y., and Stewart, J. (1996). Stress reinstates
cocaine-seeking behavior after prolonged extinction
and a drug-free period. Psychopharmacology (Berl),
128(4):408–12.
Greenbaum, P. E., Boca, F. K. D., Darkes, J., and Goldman,
C.-P. W. M. S. (2005). Variation in the drinking tra-
jectories of freshmen college students. J Consult Clin
Psychol, 73(2):229–238.
Hodgins, D. C., el Guebaly, N., and Armstrong, S. (1995).
Prospective and retrospective reports of mood states
before relapse to substance use. J Consult Clin Psy-
chol, 63(3):400–7.
Hyman, S. E. (2005). Addiction: a disease of learning and
memory. Am J Psychiatry, 162(8):1414–22.
Interlandi, J. (2008). What addicts need. Newsweek, March
3:36–42.
Kenford, S. L., Wetter, D. W., Welsch, S. K., Smith, S. S.,
Fiore, M. C., and Baker, T. B. (2005). Progression of
college-age cigarette samplers: What influences out-
come. Addict Behav, 30(2):285–294.
Koob, G. F. and Le Moal, M. (2001). Drug addiction,
dysregulation of reward, and allostasis. Neuropsy-
chopharmacology, 24(2):97–129.
Leon-Carrion, J., Garcia-Orza, J., and Perez-Santamaria,
F. J. (2004). Development of the inhibitory component
of the executive functions in children and adolescents.
Int J Neurosci, 114(10):1291–311.
Robinson, T. E. and Berridge, K. C. (1993). The neural ba-
sis of drug craving: an incentive-sensitization theory
of addiction. Brain Res Rev, 18(3):247–91.
Robinson, T. E. and Berridge, K. C. (2003). Addiction.
Annu Rev Psychol, 54:25–53.
See, R. E. (2002). Neural substrates of conditioned-cued
relapse to drug-seeking behavior. Pharmacol Biochem
Behav, 71(3):517–29.
Siegelmann, H. T. (2008). Dynamical addict: cessation,
relapse, and possible recovery. Submitted.
Sinha, R., Fuse, T., Aubin, L. R., and O’Malley, S. S.
(2000). Psychological stress, drug-related cues
and cocaine craving. Psychopharmacology (Berl),
152(2):140–8.
Sobell, L. C., Ellingstad, T. P., and Sobell, M. B. (2000).
Natural recovery from alcohol and drug problems:
methodological review of the research with sugges-
tions for future directions. Addiction, 95(5):749–764.
Spealman, R. D., Barrett-Larimore, R. L., Rowlett, J. K.,
Platt, D. M., and Khroyan, T. V. (1999). Pharma-
cological and environmental determinants of relapse
to cocaine-seeking behavior. Pharmacol Biochem Be-
hav, 64(2):327–36.
Stewart, J. (2000). Pathways to relapse: the neurobiology
of drug- and stress-induced relapse to drug-taking. J
Psychiatry Neurosci, 25(2):125–36.
Winick, C. (1962). Maturing out of narcotic addiction. The
United Nations Office on Drugs and Crime (UNODC)
Bulletin on Narcotics, 1962(1):1–7.
APPENDIX
This Appendix contains the mathematical details for
the internal and external processes in Section 2.1.
The bounding function σ is defined as:
σ(x) =
0 if x < 0
x if x ∈ [0, 1]
1 if x > 1
In the following, ν(∈ [−0.05, 0.05]) denotes the
uniform noise that is different for every signal at each
time step t.
The internal processes in the NepS are computed as
follows:
S - stress
S(t) =
σ[1 − (1 − S
0
) · e
−β
S
·d
+ ν] if G > 0
σ[S(t − 1) + ν] if G = 0
σ[S
0
· e
−γ
S
·d
+ ν] if G < 0
DRUG ADDICTION: A COMPUTATIONAL MULTISCALE MODEL COMBINING NEUROPSYCHOLOGY,
COGNITION AND BEHAVIOR
93

where t
c
is the time of last change of sign of G; S
0
is the value of S(t
c
); β
S
is the exponential constant
of S when G > 0; γ
S
is the exponential constant of S
when G < 0; d is the number of steps after t
c
; d ∈ N;
S ∈ [0, 1].
P - pain
P(t) =
σ[P
0
· e
−β
P
·d
+ ν] if G > 0
σ[P(t − 1) + ν] if G = 0
σ[1 − (1 − P
0
) · e
−γ
P
·d
+ ν] if G < 0
where t
c
is the time of last change of sign of G; P
0
is the value of P(t
c
); β
P
is the exponential constant
of P when G > 0; γ
P
is the exponential constant of P
when G < 0; d is the number of steps after t
c
; d ∈ N;
P ∈ [0, 1].
D - dopamine related craving
D(t) =
σ[1 − (1 − D
0
) · e
−β
D
·d
+ ν] if G > 0
and d ∈ [1, τ]
σ[D
0
0
· e
−β
D
·d
+ ν] if G > 0
and d > τ
σ[D(t − 1) + ν] if G = 0
σ[1 − (1 − D
0
) · e
−γ
D
·d
+ ν] if G < 0
where t
c
is the time of last change of sign of G; D
0
is the value of D(t
c
); τ is the number of time steps
in which the dopamine related craving increases after
there is no drug consumption; D
0
0
is the value of D(t)
at t = τ; β
D
is the exponential constant of D when G >
0; γ
D
is the exponential constant of D when G < 0; d
is the number of steps after t
c
; d ∈ N; D ∈ [0, 1].
q - saliency to drug cues
q(t) =
σ[q(t − 1) + ν] if {G > 0
and d ∈ [1, τ]}
or if G = 0
σ[q
0
0
· e
−β
q
·d
+ ν] if G > 0
and d > τ
σ[1 − (1 − q
0
) · e
−γ
q
·d
+ ν] if G < 0
where t
c
is the time of last change of sign of G; q
0
is the value of q(t
c
); τ is the number of time steps in
which saliency to drug cues does not decrease even
that there is no drug consumption; q
0
0
is the value of
q(t) when t = τ; β
q
is the exponential constant of
q when G > 0; γ
q
is the exponential constant of q
when G < 0; d is the number of steps after t
c
; d ∈ N;
q ∈ [0, 1].
The external processes in the NepS are computed as
follows:
A
S
- acute shock
A
S
(t) =
A
S
0
if {G > 0
and b
S
(t) = 1}
or t
S
∈ [1, τ
1
]
ρ
S
· A
S
(t − 1) if t
S
∈ [τ
1
, τ
2
]
0 else
where b
S
(t) is a Boolean variable ∈ {0, 1}; b
S
(t) = 1
means that a shock begins at time t; A
S
0
is a constant;
ρ
S
is a constant < 1; t
0
is the starting time of a shock;
t
S
∈ N is the number of steps after t
0
; τ
1
is the number
of time steps in which the shock effect is constant; τ
2
is the number of time steps in which the shock effect
is decreasing (τ
2
> τ
1
); A
S
∈ [0, A
S
0
].
A
P
and A
D
- acute trauma and acute priming to
drugs
The signals A
S
, A
P
, and A
D
are mathematically very
similar. The main difference is that an event A
P
can
start only when G < 0, but events A
S
and A
D
can start
only when G > 0.
Q - encountering drug cues
Q(t) =
q(t) if b
Q
(t) = 1
Q(t − 1) if t
Q
∈ [1, τ
1
]
ρ
Q
· Q(t − 1) if t
Q
∈ [τ
1
, τ
2
]
0 else
where b
Q
(t) is a Boolean variable ∈ {0, 1}; b
Q
(t) = 1
means that a cue begins at time t; ρ
Q
is a constant > 1;
t
0
is the starting time of a cue; t
Q
∈ N is the number of
steps after t
0
; τ
1
is the number of time steps in which
the cue effect is constant; τ
2
is the number of time
steps in which the cue effect is decreasing (τ
2
> τ
1
);
Q ∈ [0, ρ
Q
].
BIOSIGNALS 2009 - International Conference on Bio-inspired Systems and Signal Processing
94
