
HUMAN RANDOM GENERATION AND ITS APPLICATIONS
Mieko Tanaka-Yamawaki
Department of Information and Electronics,Tottori University, Tottori, 680-8552, Japan
Keywords: Human Random Generation, HURG, pattern recognition, randomness, mobile phone keyboards, MPK,
Inverse-Ten-Key.
Abstract: Human Random Generation (HURG) is a psychological test meant to detect the degree of mental fatigue, or
the level of concentration of individual subject, by testing the flexibility of thinking, without relying on any
equipment(Wagenaar, 1977). In early days, HURG was practiced in clinical psychology in order to detect
advanced level of schizophrenia. Later, the development of powerful computers made us possible to detect
subtle irregularity hidden in HURG taken from normal subjects. We have been studying the possibility of
utilizing HURG for self-detection of dementia at early stage, by using various information theoretical
techniques over several years including the pattern classification by means of hidden Markov model
(HMM), correlation dimension frequently used to identify chaotic time series, and selection of index
suitable to characterize short sequences. In this paper, we report our recent progress in developing a novel
method of HURG by using the pattern recognition and the randomness measured in the data taken from the
Inverse-Ten-Key on the mobile phone keyboards (MPK).
1 INTRODUCTION
Human random number generation test (HURG) is a
psychological test designed to check the flexibility
of thinking in a simple manner. Usually, it takes a
style of asking the subject to say or write numbers or
letters as random as possible. In the early days when
HURG was studied in the field of clinical
psychology, ability to produce a reasonable amount
of randomness was linked to the patients' mental
state, since patients in advanced stage of a certain
mental disease looses this ability considerably.
We interpret this test to detect small differences
that distinguish mental conditions or personal
characters of subjects. Our first investigation of
HURG from 1996 to 1998 used 30 sets of data taken
from 6 students at the age of 22 - 24. By means of
hidden Markov models (HMM), we have barely
succeeded in classifying those 6 subjects, and clearly
classified them into two distinct groups.
We constructed an HMM model for each person
by averaging over the learned values of parameters
and found out that the models can recognize the
correct persons with more than 50 percent of
accuracy. Moreover, the correlation dimensions
computed for each data split into the same two
groups as classified by the HMM analysis.
Later we added more data taken from 7 male
students of the same age as in the previous
experiments and obtained consistent conclusion to
the previous result mentioned above.
Recently we pay more effort on applying this
method to design health-care products for early stage
detection of dementia. However, we realize that the
experimental method we used for students demands
too much load on elderly people or patients.
In order to shorten the data series, we need novel
methods suitable for such lengths. We first put our
effort on searching for indices and selected 4
suitable ones. By using them, we have succeeded in
classifying the data of different age categories
correctly on the self-organized maps (SOM). Our
second attempt was the introduction of a new
direction of data-taking using the mobile phone
keyboard (MPK) in order to keep the data length
fixed to the shortest. We demand the subject to use
nine figures 1-9 only once for each and put them in a
random order. By doing this, we can keep the data
length to be 9, although more concentration is
required to produce data. This method can also be a
good method of training the brain to keep it
working.
The structure of the rest of this article is as
follows. In Section 2, we introduce the methods of
data collection and the results of statistical analysis.
396
Tanaka-Yamawaki M. (2008).
HUMAN RANDOM GENERATION AND ITS APPLICATIONS.
In Proceedings of the Third International Conference on Software and Data Technologies - PL/DPS/KE, pages 396-399
DOI: 10.5220/0001897103960399
Copyright
c
SciTePress
Section 3 is devoted to the results of HMM analysis.
In Section 4, we examine indices suitable to
characterize short data sequences. Finally, in Section
5, we report some result of our new direction using
mobile phone keyboards for data-taking.
2 DATA COLLECTION AND
STATISTICAL ANALYSIS
Various methods are used for data taking, such as
oral, written, or keyboard-typing. In the old days,
data were written on the paper. This method turned
out obsolete nowadays since extra effort is required
to convert the data into computer files. Moreover, it
is more suitable to conceal the previously generated
data from the eyes of the subjects in order to
maintain the quality of the data. We used in our
recent attempt the key-typing of the nine figures on
the mobile phone keyboard only once in one
attempt.
Commonly taken method is either to fix the
length of strings or to fix the time to take data of one
experiment. For example, the subjects are to say or
write one digit number for 100 times for one
experiment, or to say or write as many numbers as
possible within one (three) minute(s), etc.
The immediately recognizable feature of HURG
is the lack of repeats of the identical figures. Any
subject exhibits this tendency. Although one can
repeat the same figure one out of ten on purpose, this
attitude requires extra effort on the subject thus can
be easily lost as the subject gets tired and loose
concentration.
Whether any particular figure is more likely to
appear turned out to be negative. For the normal
subjects in the age group of 20s, the probability of
appearance of ten figures, 0,1,...,9 are almost equal
so that the corresponding entropy is just as large as
the case of machine random numbers. However, the
entropy for elderly or patients of brain disease tend
to be smaller than those of young normal subjects.
The patterns of two adjacent numbers in HURG
data show some characteristics of individual
subjects. However, the entropy of two-digit numbers
is not a suitable measure for data sequence of length
100 or shorter, since not all the patterns appear in
this length and the probability of appearance is
meaningless.
Statistical method looses power for data
sequences of length 50 or shorter, which we aim in
order to reduce the burden of the subjects.
3 PATTERN CLASSIFICATION
BY MEANS OF HMM
We adopted in our first experiment during 1996-
1998 to take data from the subject orally by fixing
the length of data to be 100 and the examiners input
the data to the keyboard so that the input data are
automatically styled into data files of prescribed
format. We collected 30 sets of data files from each
of 6 students, including 3 male students and 3
female students in the same department. By
connecting 30 data sets, we used the data sequence
of length 3000 as the input for learning the each
student’s HMM. We converted the original data
sequence by the differences between adjacent
numbers and coded them into 3 symbols, I for the
case of identical figures, II for the case of the
absolute values of the differences being 1 or 2, and
III for the case of jumping more than 2. The learned
parameters are the elements of two
33 × matrices
called A-matrix and B-Matrix, and one
31× matrix
called
π
matrix. The A-matrix represents the
transition probabilities between the hidden states,
and the B-matrix represents the probability of
appearance of those 3 symbols from 3 hidden states.
The
π
matrix is the initial probability distribution
among the hidden states. We have used Baum-
Welch algorithm for EM learning. As shown in
Table 1, the HMM can separate the 6 subjects into 2
groups. According to the patterns of two adjacent
numbers appeared in data, those 2 groups
correspond to the 2 types consisting of a group of
people who tend to move to adjacent figures
(absolute difference |d|=1, 2), and another group of
people who tend to jump to distant figures (|d|>2)
(
Tanaka-Yamawaki, 1999).
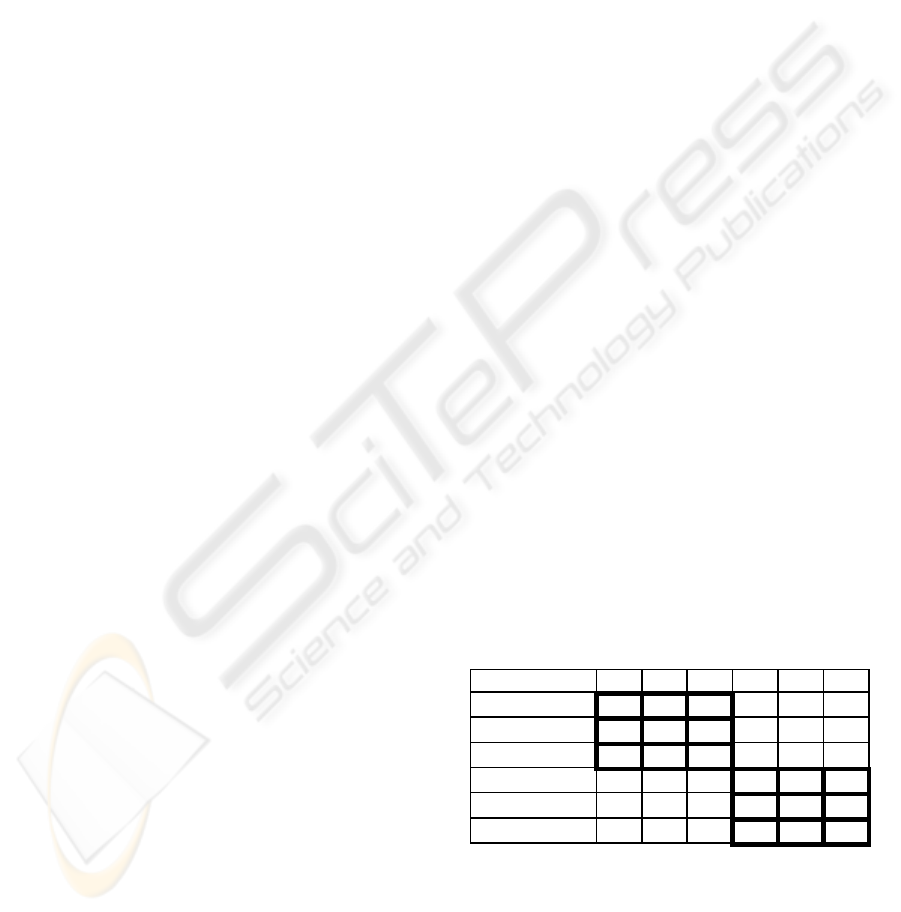
Table 1: Six subjects are recognized by HMM.
⇒HMM
A C E B D F
A(F) -data 23 3 3 0 1 0
C(F) -data 5 20 5 0 0 0
E(M) -data 3 6 20 0 0 1
B(F)-data 0 6 4 4 4 12
D(M)- data 1 0 3 4 14 8
F(M)- data 0 0 1 4 2 23
The correlation dimensions computed for the
same data shows interesting correspondence to the
above HMM result. As shown in Table 2 and Table
3, subject A, C and E, who belongs to the first group
in HMM classification, have small numbers
compared to subject B,D, and F who belong to the
second group. This result confirms that the
HUMAN RANDOM GENERATION AND ITS APPLICATIONS
397

characteristics exist in HURG data and HMM
together with the correlation dimensions can
recognize those patterns. (Tanaka-Yamawaki, 1998)
Table 2: Correlation dimension of the differences between
adjacent numbers (‘rand’ is machine-generated).
dat1 dat2 dat3 Ave. SDev
A 5.1 4.9 4.6 4.9 0.21
C 5.1 5.4 5.6 5.4 0.19
E 5.2 5.5 5.5 5.4
0.15
F 6.4 6.4 6.4
6.4
0.04
B 6.1 6.3 6.5
6.4
0.17
D 6.4 6.4 6.2
6.3
0.11
rand 6.3 6.4 6.2
6.3
0.07
4 INDICES FOR SHORT DATA
The immediate application of HURG that we can
conceive is the self-diagnoses of dementia. Oral data
of HURG generated without viewing the previously
generated numbers should represent the memory of
the subject of this experiment. The fact that the
subject tends to avoid repeating the same figure
reflects the memory effect. The memory toward
more than one becomes less clear, and the memory
goes blur for much longer past. However, the
entropy of normal subjects being close to the
maximum tells us that the HURG test is an easy task
for young normal people.
For older age groups, however, it is not so easy
to produce each figure evenly. For patients in the
advanced stage of schizophrenia, it seems more
difficult to generate random sequences. Some
patients could not finish the test of generating 100
figures. This fact indicates the effectiveness of such
test. At the same time, it tells us the necessity of
reducing the burden of the subject having such tests.
Thus we decided to shorten the length of data to 50,
and searched more suitable indices to measure the
randomness to be used for self-diagnoses.
We have selected 4 indices, the entropy (H),
turning-point-index (TPI), adjacency (ADJ), and the
repeat pattern (RP) defined as follows.
The entropy H is defined by using the probability
p
i
of appearance of the i-th figure.
∑
−=
i
ii
plogpH
(1)
The turning point index (TPI) measures how
frequently the switch from ascending pattern to
descending pattern, and vice versa, occurs in the
data sequence. Defining the turning point (TP) as the
letter after which the pattern changes, e.g., TP=2 for
“135426”, TPI is defined by dividing TP by its
expected value,
323/2)2m(TP
ex
=×−=
, where m
(=50) denotes the maximum data size.
exobs
TP/TPTPI
=
(2)
The TPI is highly vulnerable to the human brain
condition. When the subjects is active, it tends to be
larger than one, while for inactive subjects or
patients in advanced stage of mental disease it tends
to be smaller than one.
A remarkable feature of human generated
random numbers is the lack of repeats of the same
figures successively. Guided by this, we utilize the
adjacency (ADJ) to characterize the data. Focusing
on the difference between two adjacent figures
(defined by d), we classify the data to the four types,
d=0, |d|=1, |d|=2, |d|>2. All the data show the
extremely low rate of d=0 in human generated data
compared to computer generated random numbers.
Also the rate of |d|=1 is a good measure of mental
condition. For example, the data taken from the
schizophrenia patients are characterized by an
excess amount of |d|=1 compared to the data from
normal subjects.
The null score quotient (NSQ) measures the
degree of deviation from the even generation of
pairs (array of length 2). It is defined by
)1a/(NSNSQ
2
−=
(3)
where NS denotes the numbers of pairs not
appearing in the sequence and a denotes the size of
letters used. In the case of using decimal figures
{0,…,9}, a=10 (Towse, 1998) .
We propose a new index to be used in place of
NSQ for the case of short HURG. Since the subjects
of HURG try to generate the next letter based on
their memory of the last generated letter, NSQ is a
good measure for the memory capacity of the
subjects. However, the problem is that the value of
NSQ ranges from 51.5 to 100 for the case of data
sequence of length 50. We need a better index for
short data (Mishima, Tanaka-Yamawaki, 2008).
Consider the case when the generated data is
“1358763” so far, and 5 is about to come out next,
one would make an effort to avoid 5, by considering
the previously generated 35. Human would pay all
the effort to improve the randomness (complexity, in
fact). Guided by this thought, we define a new index
)1n(m
NRS
1RP
−−
−=
(4)
which represents the frequency of repeated pairs.
Here NRS denotes the number of unrepeated pairs,
ICSOFT 2008 - International Conference on Software and Data Technologies
398
m (=50) denotes the length of the sequence, and n
denotes the length of array (n=2 for pair). The more
the repeated pairs, the larger the value of RP,
indicate the deterioration of the memory capacity of
the subject. Since the case of n=3 did not show much
difference from that of n=2(pair), we stick to
consider only pairs (n=2). Note that RP ranges
[0:100] in percent, irrelevant to the size of the data
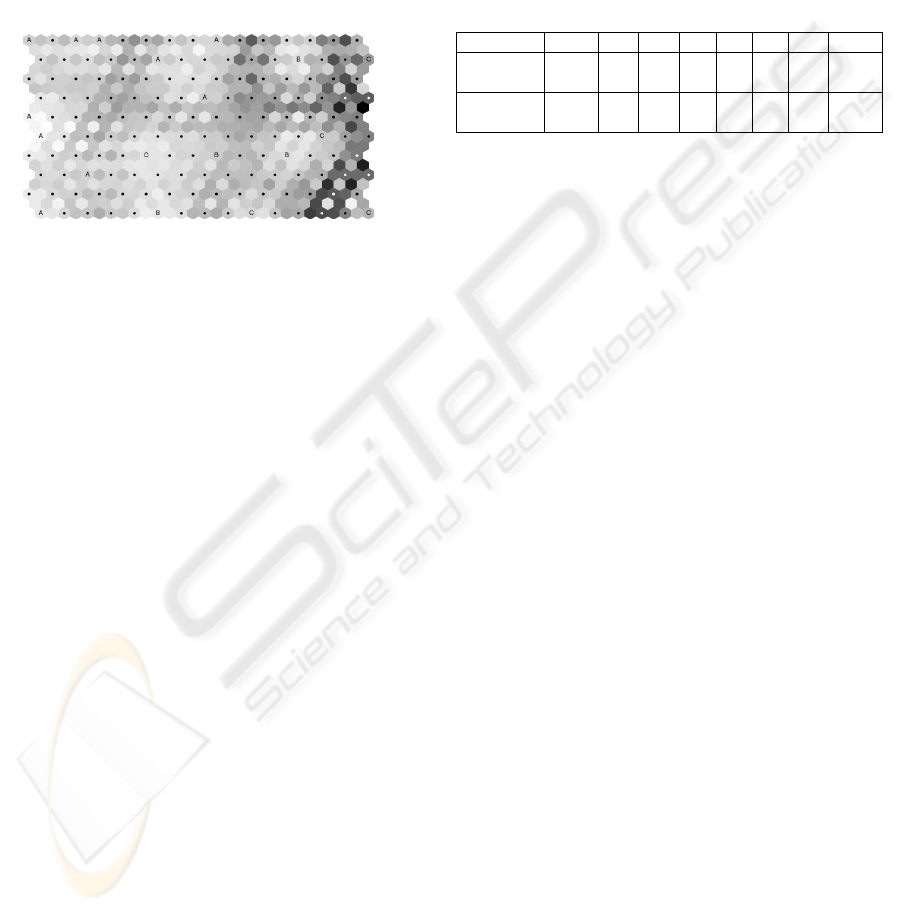
sequence unlike NSQ. We show in Figure 1 that the
data are separated to 4 distinct regions according to
the age groups by using RP, TPI, ADJ, H for indices.
Figure 1: The SOM representation of 20 subjects in RP,
TPI, ADJ, H. showing separation of different age groups:
A(20s), B(30-49), C(50-79), D(80-).
5 MOBILE PHONE KEYBOARD
HURG-on-MPK (Mobile Phone Keyboard) is
designed to reduce the length of data sequence,
which asks subjects to type 9 numerical keys on the
mobile phone keyboard once per each key in a
random order. In this scheme of HURG, the length
of data is fixed to 9, which is far shorter than the
previously studied HURG. Moreover, this is
effective to train the flexibility of brain, demanding
high level of concentration to the subjects.
This new method requires a new set of analytical
tools. Since all the 9 figures (1-9) are used in one
data only once, the randomness measure used for the
standard HURG such as entropy becomes useless in
this case. The randomness for HURG-on-MPK lies
in the order of those 9 figures.
We have developed a classification method of
such data by using a 3-layered feed-forward neural
network (3NN). The location the 9 figures plus the
total length of the path that the finger travels over
the keyboard are put into the 10 units of the first
(input) layer. Those are sent to the second (middle)
layer that consists of 3 nonlinear units, which
convert the weighted sum of the information from
the 10 input units into 1 (if it exceeds the threshold)
or 0 (if it is below the threshold). The outputs from
the 3 units of the middle layer are sent to the output
layer of the same kind of nonlinear structure and
they are compared with the teacher signals. We have
used the back-propagation learning algorithm for
training this 3NN. By using this, we have
successfully classified the 7 subjects. The rate of
recognition of 7 subjects (A-G) are shown in Table 3,
where the result with and without the 10-th unit are
compared. Note that the information of the total path
that the finger travelled put into the 10-th unit plays
an important roll.
Table 3: Recognition Rates [%] for 7 subjects (A-G).
Subject A B C D E F G ave
1-9 units 90 73 53 0 5
7
5
3
60 55
1-10 units 100 93 97 33 7
0
8
0
90 80
6 CONCLUSIONS AND BEYOND
We have presented in this article various ways of
pattern recognition of HURG, such as HMM,
correlation dimensions, etc., and the efforts to
shorten the length of data sequence. In this regard,
we discussed analytical techniques to extract
patterns from HURG, in particular, the identification
of the four indices, RP, TPI, ADJ, H to characterize
short sequences.
We have also introduced HURG-on-MPK and
presented the effectiveness of the 3 layered neural
network system (3NN), using the locations of 9
figures appeared in the data sequences and the path
length that the finger travels.
Our future work is to collect more data and test
the effect of HURG including the new method
proposed in this article. Other tools of pattern
recognition are to be considered.
REFERENCES
Wagenaar, W.A., 1977. Psychological Bulletin, 77, 65-72.
Towse, J., N., Nell, D., 1998. Analyzing Human Random
Generation Behaviour, Behavior Research Methods,
Instruments, & Computers, 30(A), 583-59.
Tanaka-Yamawaki M., 1998. Can We Measure the Brain
by Random Generations?, In Proc. ICONIP’98,
Omsha/IOS Press, 215-218.
Tanaka-Yamawaki M., 1999. Human Generated Random
Numbers and a Model of the Human Brain Functions;
Proc.1999 IEEE SMC, Piscataway, NJ, USA, 223-228.
Mishima, M., Tanaka-Yamawaki, M., 2008. Effective
Indices to Characterize Short Sequences of Human
Random Generations, Artificial Life and Robotics, 12,
Springer, 184-187.
HUMAN RANDOM GENERATION AND ITS APPLICATIONS
399
