
H-INDEX CALCULATION IN ENRON CORPUS
Anton Timofieiev, V
´
aclav Sn
´
a
ˇ
sel and Ji
ˇ
r
´
ı Dvorsk
´
y
Dept. of Computer Science, V
ˇ
SB - Technical University of Ostrava, 17. listopadu 15, 708 33 Ostrava-Poruba, Czech Republic
Keywords:
Social networks, graph theory, Enron corpus, H-Index, graph clustering.
Abstract:
Development of modern technologies is expanded with communications possibilities. Electronic systems of
communications make possible overcoming traditional barriers of communication, for example, such as dis-
tance. On their basis there are new types of communities which any more have no geographical restrictions.
Increasing popularity of electronic communities among which projects LiveJournal, LiveInternet, and also
projects popular in Russian-speaking part Internet Mamba, MirTesen, VKontakte, Odnoklassniki, etc., makes
as never earlier actual questions on working out of techniques of research of similar social networks. How-
ever communications of members of such communities only by means of electronic communications create
difficulties at definition of such communities. In this paper we describe method for measurement of the im-
portance of particular people within the community. The method is based on h-index calculation. Approach is
demonstrated on Enron corpus.
1 INTRODUCTION
With the increasing amount of data available electron-
ically the need for tools and techniques to extract, an-
alyze, and make sense of massive data sets, many of
which have strong temporal and geographic features,
has escalated. This has led to dramatic increase in re-
search in areas such as link analysis, network anal-
ysis, dynamic network analysis, text analysis, data
mining and machine learning.
One of the by-products of the Federal Energy Reg-
ulatory Commission’s (FERC) investigation of Enron
was the vast amount of information (electronic mail
messages, phone tapes, and internal documents) col-
lected towards building a legal case against the global
energy corporation. As a matter of public record, this
information which initially contained over 1.5 mil-
lion electronic mail (email) messages was originally
posted on FERC’s web site (Grieve, 2003). How-
ever the original set suffered from document integrity
problems and attempts were made to improve the
quality of the data and remove some of the sensitive
and irrelevant private information. Dr. William Co-
hen of Carnegie Mellon University took the lead in
distributing this improved corpus - known as the En-
ron Email Sets. The latest version of the Enron Email
Sets
1
. contains 517, 431 email messages of 150 Enron
1
March 2, 2004
employees covering a period from December 1979
through February 2004 with the majority of messages
spanning the three years: 1999, 2000, and 2001. It
includes messages of some of the top executives of
Enron management personnel including founder and
Chief Executive Officer (CEO) Ken Lay, president
and Chief Operating Officer (COO) Jeff Skilling, and
head of trading and later COO, Greg Whalley. Other
top executives who played major roles in the day-
to-day operations of the corporation are represented
as well. They include: Louise Kitchen who devel-
oped the Enronline, the corporation’s in-house trading
system, Vince Kaminski head of research, Richard
Sanders leader of Enron North America’s litigation
department and Steve Kean Executive Vice President
and Chief of Staff.
In addition to operational logistics of being Amer-
ica’s seventh largest company, Enron was faced with
many ongoing crises. One involved Enron’s devel-
opment of the Dabhol Power Company (DPC) in the
Indian state of Maharashtra, an endeavor awash in
years of logistical and political problems. Then there
was the deregulation of the California energy mar-
ket, which led to rolling blackouts during the sum-
mer of 2000 - a situation that Enron (and other energy
companies) took advantage of financially. By the fall
of 2001, Enron’s combination of greed, overspecula-
tion, and deceptive accounting practices snowballed
into an abrupt collapse. A last minute merger with
206
Timofieiev A., Snás
ˇ
el V. and Dvorský J. (2008).
H-INDEX CALCULATION IN ENRON CORPUS.
In Proceedings of the Third International Conference on Software and Data Technologies - ISDM/ABF, pages 206-211
DOI: 10.5220/0001891802060211
Copyright
c
SciTePress

the Dynegy energy company fell through and Enron
filed for Chapter 11 bankruptcy on December 2, 2001
(McLean, Elkind, 2003). The challenge was how to
classify this information in a meaningful way.
One key focus of this analysis has been the ex-
traction of patterns and meanings from these data
sets. Pattern discovery is particularly difficult in these
datasets as the patterns are usually small in scale and
hard to pick out against the background of normal ev-
ery day behavior. This creates difficult new problems
for analysis techniques: pragmatic problems caused
by the sheer size and complexity of the data, and dis-
crimination problems, determining when some small
variation in the structure of the data is potentially in-
teresting. The situation is further complicated by the
fact such data is inherently messy reflecting the vast
array of original data-sources (e.g., news plus web
plus email), biases in data collection, and intentional
ambiguities (such as false identities).
All of the techniques described in this paper are
general. They could equally well have been ap-
plied to counter-narcotics, counter-terrorism, money-
laundering or other activities. Thus, although the
techniques are used on Enron, they are equally ap-
plicable to analyzing virtual data generated by simu-
lations and real data extracted from various sources.
It was said, that the Enron Corpus has its own unique
difficulties and features. Data is time stamped. But
actors have multiple aliases (email accounts). Many
messages are duplicated, and so on. The sheer volume
of data cleaning is immense.
Within Enron, questions asked include, but are not
limited to the following. What do groups look like?
What is the inter-organizational profile of a company
as it moves toward crisis? How does message traf-
fic change over a corporate lifetime? Can communi-
ties of interest be identified? Which people are im-
portant in these communities? These and many other
complex real-world problems can be addressed by an-
alyzing large, complex, and messy datasets such as
the Enron mail corpus. There are two broad kinds of
analysis that can help in addressing such problems.
The first looks at the properties of individual objects,
perhaps people or messages or journeys, and tries to
detect those that are anomalous in some useful way.
The second looks at the relationships between objects,
and tries to find patterns in their connections that are
anomalous. Similarly, there are two broad kinds of
approaches. The first focuses on streams of data and
tries to locate anomalies as new data arrives. The sec-
ond focuses on the data as though it was a single block
in time, a snapshot of the world, and tries to locate
anomalies within this snapshot.
The paper is constructed as follows: section 2 de-
scribes state of the art relevant to Enron Corpus. A de-
tection of communities within social network is pre-
sented in section 3. Usage of h-index and person im-
portance measurement is given in section 4. Results
of experimental calculations are contained in section
5. Conclusions and prospects of the further researches
are described in section 6.
2 STATE OF THE ART
One of the key aspects of the Enron corpus is that
corpus is a result of emailing. This fact has several
consequents.
2.1 Language Processing
It is clear the email is not quite like either spoken or
formal written communication. Email tends to oc-
cupy a middle ground: less formal than other forms
of writing, but, more formal than speech. The Enron
emails provide a chance to investigate, empirically,
what the language of email is like.
Keila and Skillicorn (Keila, Skillicorn, 2005)
study structure of bodies of individual emails using
singular value decomposition and semidiscrete de-
composition. Vocabulary used in emails has specific
features, especially frequencies of words, different
from standard English.
2.2 Structural Patterns
Emails have a sender and one of more receivers, and
so represent a form of connection between people. It
is natural to build various forms of graphs to capture
these connections, and then to see what they can tell
us about how communication works, and how it con-
nects to relationships and to power.
McCallum et al. (McCallum, Corrada-Emmanuel,
Wang, 2005) combined social network information
extracted from sender recipient relations with infor-
mation on the topic of emails that they identified by
statistical analysis of word distributions into the ART
model. They extended the ART model by determin-
ing people’s roles (RART model) and showed exper-
imentally that this combination of evidence provides
a better prediction of similarities among people with
the same roles than traditional block modeling. Cha-
panond, Krishnamoorthy and Yener (Chapanond, Kr-
ishnamoorthy, Yener, 2005) detect social communi-
ties using sender-recipient relationship.
H-INDEX CALCULATION IN ENRON CORPUS
207

2.3 Topic Extraction
Emails are written for a purpose they are about some-
thing. Examining the content of real emails can tell us
how information flows in an organization, how infor-
mation is related to relationships, and also how words
usage and style might reflect relationships and power.
Berry and Browne (Berry, Browne, 2005) detect
topics (concepts) using non-negative word-email ma-
trix factorization to identify critical happenings and
individuals.
3 SOCIAL COMMUNITIES
DETECTION
3.1 Connected Components
This paragraph introduces basic definitions from
graph theory, for more details see (Tutte, 1984).
Definition 1. A vertex-cut in a graph G is a set U of
vertices of G such that G \U is not connected.
Definition 2. The vertex-connectivity or simply con-
nectivity κ(G) of a graph G is the minimum cardinal-
ity of a vertex-cut of G (Hence κ(G) is the minimum
number of vertices whose removal results in a discon-
nected or trivial graph).
Definition 3. A graph G is said to be k-connected,
k ≥ 1 if κ(G) ≥ k.
Definition 4 (k-connected component). Let G be a
graph. A k-component of G is a maximal k-connected
subgraph H of G.
The higher the degrees of the vertices of a graph,
the larger connectivity of graphs. A k-component of
the graph is a maximal graph with a cut-set of the size
k and with k or more independent paths between any
pair of its nodes.
3.2 Detection of Communities
Widely used approach to analyze communities struc-
tures is based on searching for triangles in social net-
works, (Ravasz, Barab
´
asi, 2003). In many networks
it is found that if the vertex A is connected to the ver-
tex B and the vertex B to the vertex C, then there is a
heightened probability that vertex A will also be con-
nected to the vertex C. In the language of social net-
works, the friend of your friend is likely also to be
your friend. In terms of network topology, transitivity
means the presence of a heightened number of trian-
gles in the networksets. It can be quantified by defin-
ing a clustering coefficient C thus:
C =
3 ∗ # o f triangles in the network
# o f connected triples o f vertices
(1)
The clustering coefficient measures the density of tri-
angles in a network, see (Newmann, 2000).
According to the graph theory, we can say that
each triangle is a smallest 2-connected component be-
cause it satisfies the conditions of the definition 4. We
have used this knowledge in our approach.
4 H-INDEX
Definition 5 (h-index). The index of the scientist is
equal h if h from his/hers N
p
(quantity of papers for
the certain period) papers are quoted not less h time
everyone, and each of the others (N
p
− h) papers is
quoted no more than h time.
The h-index, suggested by Jorge E. Hirsch
(Hirsch, 2005), was intended to address the main dis-
advantages of other bibliometric indicators, such as
the total number of papers or total number of cita-
tions. Total number of papers does not account for the
quality of scientific publications, while total number
of citations can be disproportionately affected by par-
ticipation in a single publication of major influence.
The h-index is intended to measure simultaneously
the quality and sustainability of scientific output, as
well as, to some extent, the diversity of scientific re-
search.
In the same manner we can define measurement
for communication in social network. And based on
this measurement, importance of particular person in
social network can be classified. Equivalent for cita-
tion can be found in the communication. A relation-
ship ”I cite paper X” can be rewritten as ”I send email
to user X”, and relationship ”My paper was cited by
X” can be formulated as ”I receive email from user
X”.
Let suppose set of persons {p
1
, p
2
, . . . , p
n
}. For
each person p
i
two h-indices can be defined: h
s
, active
h-index, with meaning ”I send at least h
s
emails to
h
s
people”, and passive h-index, h
r
, with meaning ”I
receive h
r
emails from at least h
r
people”. To combine
these numbers into one number we can define ∆h as:
∆h
i
= h
s
i
− h
r
i
∆h
i
can be normalized to more accurately measure
flow of communication:
∆h
i
= ∆h
i
−
1
n
n
∑
j=1
∆h
j
ICSOFT 2008 - International Conference on Software and Data Technologies
208
Based on sign of ∆h
i
, there are three possibilities:
• ∆h
i
< 0 This person acts as consumer of informa-
tion. This scenario may be typical for subordinate
workers, but some leaders can receive a lot of data
from his/her team co-workers.
• ∆h
i
= 0 This case describes person, with approxi-
mately equivalent number of incoming emails and
outgoing emails. This is typical ”question and
answer” scenario - person receive some question
from his/her boss and replay him/her with answer.
• ∆h
i
> 0 This person is source of information. This
scenario probably fits on leading workers, which
produce many emails with instructions, demands
etc.
Extreme values, especially positive values, of ∆h
i
can help to identify leading, important, members of
team, community, or in case of Enron, of company.
5 EXPERIMENTAL RESULTS
A large set of email messages, the Enron corpus
2
, was
made public during the legal investigation concerning
the Enron corporation. The raw Enron corpus con-
tains 517,431 messages belonging to 150 users, see
(Klimt, Yang, 2004). Each message present in the
folders contains the senders and the receiver email
address, date and time, subject, body, text and some
other email specific technical details.
We perform following three steps in our experi-
ment:
1. The dataset has a lot of integrity issues. It has
many duplicate and corrupt messages. We cleaned
the corpus before this analysis by removing cer-
tain folders from each user, such as ”discus-
sion threads”, ”all documents”, ” sent email”.
These folders were presented for most users, and
did not appear to be used directly by the users,
but rather were computer generated. Our goal in
this paper is to analyze graph properties of En-
ron corpus, so these folders would have likely
been misleading. In our cleaned Enron corpus,
there are a total of 300,458 messages belonging to
148 users. The graph G has 77,784 vertices and
332,777 edges.
2. All 2-connected components were found in the
second step. 44,685 components were found in
graph G. Maximal component has 31,420 vertices
and contains most of the graph G, 44,685 compo-
nents have only two vertices.
2
Corpus is available at
http://www-2.cs.cmu.edu/˜enron/
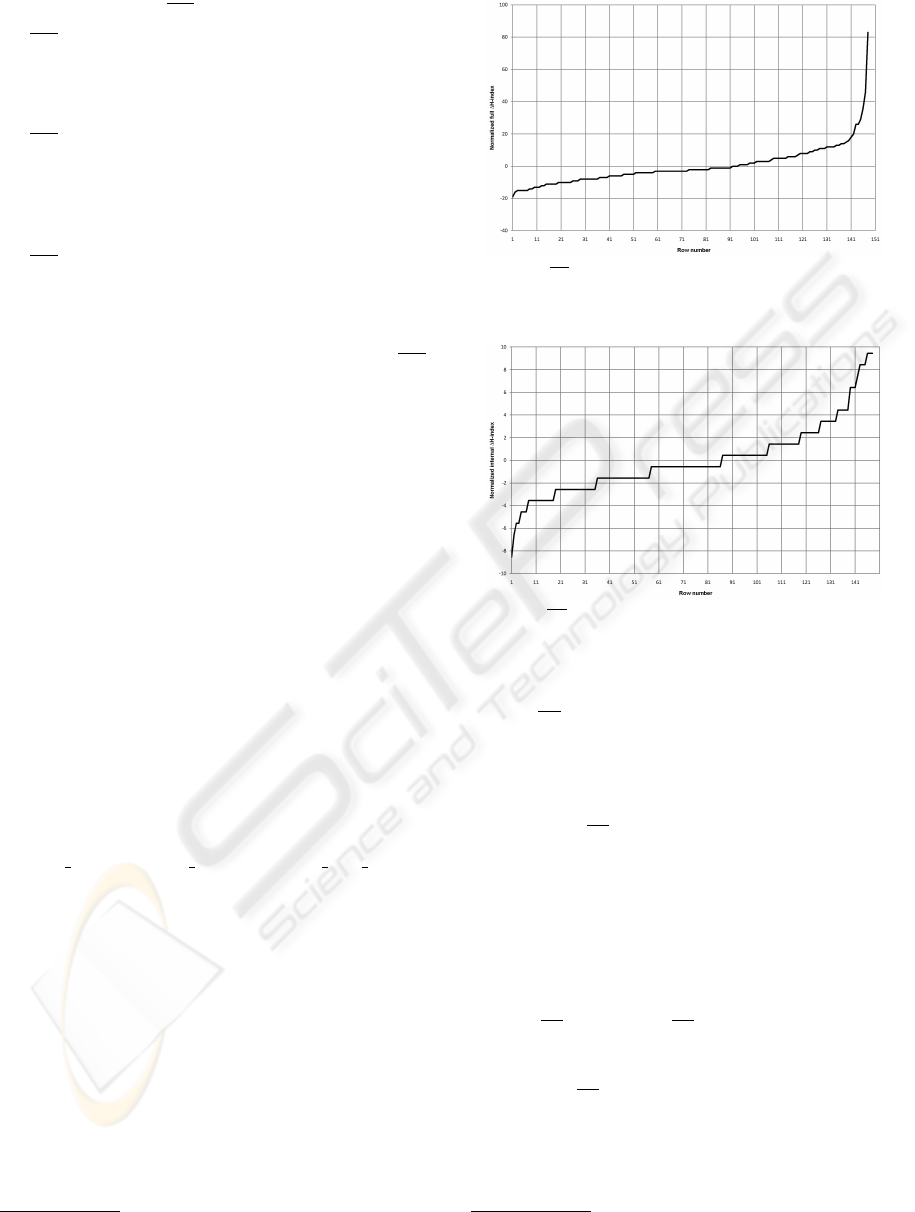
Figure 1: ∆h-index with respect to row numbers, all ad-
dresses
Figure 2: ∆h-index with respect to row numbers, internal
addresses only
3. For each Enron employee (email address) h
s
, h
r
,
and ∆h were computed. We take into account
only communication across 2-connected compo-
nent. Communication within component is con-
sidered as ”in-group” communication. These val-
ues are stored, and sorted in increasing order ac-
cording to ∆h.
The question is, which addresses should be taken
into account, when h-index is computed. The first
possibility is take all email addresses, the second one
is take only addresses within Enron Company. The re-
sults for the first approach are given in table 2. It can
be seen that the first row is occupied by Greg Whal-
ley, and the last one by Jeff Dasovich, who has the
greatest ∆h index. The ∆h index for internal email
addresses can be seen in table 3. Greg Whalley is at
the first row too, Jeff Dasovich is the 143-th one
3
. A
behaviour of ∆h-index for all addresses resp. internal
addresses are given in figures 1 resp. 2.
To evaluate our result we focus on a priori known:
• members of top executives of Enron Corpo-
3
Both tables are very long, due to lack of space only
parts of them are presented.
H-INDEX CALCULATION IN ENRON CORPUS
209

Table 1: Density of important persons.
Row number Number of
important persons
from to ∆h-index ∆h-index
all addrs. internal addrs.
148 134 3 4
133 119 1 4
118 104 4 2
103 89 1 0
88 74 0 2
73 59 2 0
58 44 0 0
43 29 1 0
28 14 0 0
13 1 1 1
ration
4
: Kenneth Lay (CEO), Jeffrey Skilling
(CEO), Jeff Dasovich (Director), Richard Shapiro
(VP), Steven Kean (VP), James Steffes (VP), Sara
Shackleton (VP), Tana Jones, Mark Taylor, head
of trading and later COO, Greg Whalley.
• other top executives who played major roles in the
day-to-day operations of the corporation are rep-
resented as well. They include: Louise Kitchen
who developed the Enronline, the corporation’s
in-house trading system, Vince Kaminski head of
research, Richard Sanders leader of Enron North
America’s litigation department and Steve Kean
Executive Vice President and Chief of Staff.
As can be seen on table 2 and especially on table
3 important persons have tend to group at the mar-
gins of the tables. For example, Greg Whalley (COO)
is at the first line at both tables, and other important
persons are grouped at the oposite side of the tables.
There are very low density of ”VIP” persons in the
middle of the table. Table 1 clearly shows the density
of the persons across the whole tables. Moreover ta-
ble 1 shows, that higher density of important person is
obtained with internal addresses only. Filtering to in-
ternal addresses only has positive impact on detection
of important persons.
6 CONCLUSIONS
Method for communities detection in social network
was presented. The method is based on 2-connected
components. The importance of particular member of
these communities was measured using h-index, orig-
inally designed to measure scientific work.
We found in the middle of the work. There are
still many question remains. The presented approach
4
Andrew Fastow (CFO), Susan Mara (Director), Paul
Kaufman (VP) are not included in Enron Corpus.
should be compared with PageRank algorithm. Or
importance of web pages can be measured by our ap-
proach etc.?
Table 2: Enron users and their h-indices, all adresses.
Row Name h
s
h
r
∆h ∆h
#
1 Greg Whalley 7 30 -23 -19.108
.
.
.
.
.
.
.
.
.
.
.
.
.
.
.
.
.
.
40 Jeff Skilling 6 17 -11 -7.108
.
.
.
.
.
.
.
.
.
.
.
.
.
.
.
.
.
.
65 Steven Kean 29 36 -7 -3.108
66 Kenneth Lay 10 17 -7 -3.108
.
.
.
.
.
.
.
.
.
.
.
.
.
.
.
.
.
.
93 Mark Taylor 35 39 -4 -0.108
.
.
.
.
.
.
.
.
.
.
.
.
.
.
.
.
.
.
104 Richard Sanders 23 24 -1 2.892
113 Louise Kitchen 44 43 1 4.892
114 Sara Shackleton 38 37 1 4.892
117 Vince Kaminski 25 23 2 5.892
.
.
.
.
.
.
.
.
.
.
.
.
.
.
.
.
.
.
132 Richard Shapiro 47 39 8 11.892
134 James Steffes 46 38 8 11.892
.
.
.
.
.
.
.
.
.
.
.
.
.
.
.
.
.
.
144 Tana Jones 66 44 22 25.892
148 Jeff Dasovich 119 40 79 82.892
Table 3: Enron users and their h-indices, internal addresses
only.
Row Name h
s
h
r
∆h ∆h
#
1 Greg Whalley 5 14 -9 -8.561
.
.
.
.
.
.
.
.
.
.
.
.
.
.
.
.
.
.
81 Richard Sanders 10 11 -1 -0.561
83 Jeff Skilling 4 5 -1 -0.561
.
.
.
.
.
.
.
.
.
.
.
.
.
.
.
.
.
.
113 Kenneth Lay 9 8 1 1.439
115 Sara Shackleton 11 10 1 1.439
.
.
.
.
.
.
.
.
.
.
.
.
.
.
.
.
.
.
120 Tana Jones 12 10 2 2.439
121 Vince Kaminski 8 6 2 2.439
126 Mark Taylor 14 12 2 2.439
.
.
.
.
.
.
.
.
.
.
.
.
.
.
.
.
.
.
132 Richard Shapiro 11 8 3 3.439
135 Steven Kean 16 12 4 4.439
.
.
.
.
.
.
.
.
.
.
.
.
.
.
.
.
.
.
141 James Steffes 17 11 6 6.439
142 Louise Kitchen 24 17 7 7.439
143 Jeff Dasovich 18 10 8 8.439
ICSOFT 2008 - International Conference on Software and Data Technologies
210

REFERENCES
Berry, M. W., Browne M. (2005). Email Surveillance Us-
ing Nonnegative Matrix Factorization. Proceedings of
Workshop on Link Analysis, Counterterrorism and Se-
curity, SIAM International Conference on Data Min-
ing 2005. Newport Beach, CA, 45-54.
Chapanond, A., Krishnamoorthy, M. S., Yener, B. (2005).
Graph Theoretic and Spectral Analysis of Enron
Email Data, Proceedings of Workshop on Link Anal-
ysis, Counterterrorism and Security, SIAM Interna-
tional Conference on Data Mining 2005. Newport
Beach, CA, 15-22.
Grieve, T. (2003): The Decline and Fall of the En-
ron Empire. Slate. http://www.salon.com/news/ fea-
ture/2003/10/14/enron/index np.html. (2003, October
14)
Hirsch J. E. (2005). An index to quantify an individual’s
scientific research output. Proc.Nat.Acad.Sci.
Keila, P.S., D.B. Skillicorn (2005). Structure in the En-
ron Email Dataset. Proceedings of Workshop on Link
Analysis, Counterterrorism and Security, SIAM Inter-
national Conference on Data Mining 2005. Newport
Beach, CA, April 2005, 55-64.
Klimt B., Yang Y. (2004) Introducing the Enron Corpus,
Proceedings of First Conference on Email and Anti-
Spam (CEAS).
McCallum, A., Corrada-Emmanuel, A., Wang, X. (2005).
The Author-Recipient-Topic Model for Topic and
Role Discovery in Social Networks, with Applica-
tion to Enron and Academic Email. Proceedings of
Workshop on Link Analysis, Counterterrorism and Se-
curity, SIAM International Conference on Data Min-
ing.Newport Beach, CA, April 2005, 33-44.
McLean B., Elkind P. (20030. The Smartest Guys in the
Room: The Amazing Rise and Scandalous Fall of En-
ron. Portfolio.
Newman M. E. J. (2000): The Structure and Function of
Complex Networks. SIAM Review. vol. 45 (2003),
167-256.
Ravasz E., Barab
´
asi A.-L. (2003): Hierarchical organiza-
tion in complex networks. Phys. Rev. E, 67 (2003),
art. no. 026112.
Tutte W. T. (1984). Graph Theory, Encyclopedia of math-
ematics and its applications, Addison Wesley, volume
21.
H-INDEX CALCULATION IN ENRON CORPUS
211
