
EMPIRICAL ASSESSMENT OF EXECUTION TRACE
SEGMENTATION IN REVERSE-ENGINEERING
Philippe Dugerdil and Sebastien Jossi
Department of Information Systems, HEG-University of Applied Sciences, 7 rte de Drize, 1227 Geneva, Switzerland
Keywords: Reverse-engineering, dynamic analysis, software architecture, empirical study.
Abstract: Reverse-engineering methods using dynamic techniques rests on the post-mortem analysis of the execution
trace of the programs. However, one key problem is to cope with the amount of data to process. In fact, such
a file could contain hundreds of thousands of events. To cope with this data volume, we recently developed
a trace segmentation technique. This lets us compute the correlation between classes and identify cluster of
closely correlated classes. However, no systematic study of the quality of the clusters has been conducted so
far. In this paper we present a quantitative study of the performance of our technique with respect to the
chosen parameters of the method. We then highlight the need for a benchmark and present the framework
for the study. Then we discuss the matching metrics and present the results we obtained on the analysis of
two very large execution traces. Finally we define a clustering quality metrics to identify the parameters
providing the best results.
1 INTRODUCTION
During the last decade, software reengineering has
been proposed as a viable solution to software
ageing problem (legacy software). According to
(Biggerstaff, 1994) the first step to reengineering,
reverse-engineering, is “the process under which an
existing software system is analyzed to identify its
components and the relation between them and to
create representation of the system at different
conceptual levels”. Moreover, according to (Bergey,
1999), reengineering initiatives that do not target the
architectural level are more likely to fail.
Consequently, many reengineering initiatives begin
by reverse architecting the legacy software. The
trouble is that, usually, the source code does not
contain many clues on the high level components of
the system (Kazman, 2002). However, it is known
that to “understand” a large software system, which
is a critical task in reengineering, the structural
aspects of the software system i.e. its architecture
are more important than any single algorithmic
component (Tilley, 1996). Besides, we know that
there is not a unique view of software architecture,
there are many (Clements, 2002), each targeting a
particular purpose. In this work, we aim at
reconstructing the functional architecture of the
system i.e. the structure of components and their
relationships that implement the high level business
function of the software. Our technique rests on the
post mortem dynamic analysis of the legacy
software i.e. the analysis of the execution trace file
after the software has been executed. Moreover, to
be able to correlate the recovered components to the
business function of the software, the latter is
executed by following the recovered use-case
performed by the actual users of the system. The
technique to generate an execution trace file from a
legacy software system has been presented
elsewhere (Dugerdil, 2006). One key problem in
post-mortem dynamic analysis is to cope with the
amount of data to process. In fact, the execution
trace file can contain hundreds of thousands of
events, if not millions. To cope with this data
volume, we recently developed a trace segmentation
technique (Dugerdil, 2007b) that provided
encouraging results. So far, the parameters of this
technique have been set somewhat arbitrarily. In
fact, we did not know what parameter would provide
optimal results. In this paper we present a
quantitative study of the performance of our
segmentation technique according to the parameters
chosen. To be able to assess the quality of the result
we used a benchmark: a recent and well architected
Java system whose functional components
20
Dugerdil P. and Jossi S. (2008).
EMPIRICAL ASSESSMENT OF EXECUTION TRACE SEGMENTATION IN REVERSE-ENGINEERING.
In Proceedings of the Third International Conference on Software and Data Technologies - SE/GSDCA/MUSE, pages 20-27
DOI: 10.5220/0001877200200027
Copyright
c
SciTePress

correspond closely to its package structure. Then, we
measure the match of the recovered components
with the package structure. The closer the match, the
better the result. In section 2 we briefly present our
segmentation and component identification
technique. Then, in section 3 we present the
evaluation framework and the metrics we used to
evaluate the quality of the results. In section 4 we
present the empirical results in several
configurations of the parameters. These experiments
are discussed in section 5. In section 6, we define the
Clustering Quality metric to assess the performance
of our clustering technique with respect to the
chosen parameters. The related work is presented in
section 7. Section 8 concludes the paper by
presenting our future work.
2 SEGMENTATION
The execution trace files in all but trivial programs
are generally very large. In one of our experiments,
we got a file with more than 7.10
6
events (procedure
calls). Although many authors try to cope with the
quantity of information to process by compressing
the trace using more or less sophisticated techniques
(Hamou-Ladj, 2002), we have developed another
technique: trace segmentation (Dugerdil, 2007b).
First, the trace is split into contiguous segment of
equal size. Then we observe the class occurrence in
each segment and compute a correlation factor
between the classes: if classes are simultaneously
present or absent in the same segments, then they are
considered as highly correlated. The highly
correlated classes will be considered as forming
functional clusters or components. In this context, a
functional component is a set of classes working
closely together to implement some useful business
function. Let us define the number of segments in
the trace as Ns and the binary occurrence vector V
C
for a given class C as a vector whose size is Ns and
whose i
th
component indicates the presence (1) or
absence (0) of the class in the i
th
segment. Then, the
correlation between any two classes C
1
, C
2
is given
by (Dugerdil, 2007b):
12
12
12
1
.
(, )
[] []
Ns
i
VV
correlation C C
Vi V i
=
=
⊕
∑
Where V1.V2 is the usual dot product for vectors
and V
1
[i]⊕V
2
[i] is the boolean OR operator between
the corresponding components of both vectors.
Two classes are considered strongly correlated if
their correlation is higher or equal to some
predefined threshold T. Using this metric, we cluster
the classes that are mutually strongly correlated.
Each such a cluster will represent a functional
component. The rationale behind this technique is
that functional components should be highly
cohesive and their classes strongly coupled. In this
technique, two parameters must be determined: the
number of segments (Ns) and the correlation
threshold (T). Then, this approach has been applied
to the reverse engineering of an industrial software
(Dugerdil, 2007a). Although the results were
encouraging, since we observed clusters that were
common among several use-cases, we did not
systematically investigate the effect of the choice of
parameters (Ns and T) on the clustering. In these
experiments, we somewhat arbitrarily chose Ns =
twice the number of classes present in the execution
trace and two correlation factors: 60% ≤ T < 80% for
moderately correlated classes and T ≥ 80% for
strongly correlated classes. Since the technique
seems promising, we need to study the effect of the
parameters on the quality of the result. Besides, in
all our experiments, we saw that some classes were
present in most of the segments of the execution
trace. These are similar to the utility classes in the
work of (Hamou-Ladj, 2005): they are classes that
perform some utility work, not specific to any
functional component. Then, we filtered out these
classes before proceeding with the computation of
the clusters. Let us define G = (C,R) a weighted
graph whose set of nodes C is the set of classes
identified in an execution trace and whose edges are
defined by the correlation R between these classes.
The weight of an edge is the strength of the
correlation between the connected nodes. Then our
clustering technique computes the connected
subgraphs of G whose weight is greater or equal to
the chosen threshold T.
Since a given class can be part of several
connected subgraphs, it will also be part of several
clusters. Moreover, our technique will not only
generate clusters whose classes are located in a
single directory but also clusters spanning several
directories. Finally, there will be classes not
associated to any clusters. This is the case when a
class works in isolation i.e. does not collaborate with
any other class to fulfil its responsibilities.
EMPIRICAL ASSESSMENT OF EXECUTION TRACE SEGMENTATION IN REVERSE-ENGINEERING
21
3 FRAMEWORK AND METRICS
Basically, all clustering techniques try to “discover”
the components of the software under study in order,
for the software engineer, to reconstruct the
architecture of the system. However to evaluate the
quality of the clustering technique we need to define
a benchmark. Then, we decided to apply our
technique on a recently written, well architected
system written in Java. This system holds more than
600 classes. The packages of this system represent
well defined functional components. Therefore, if
our technique is able to discover the functional
components of the system, then there will be a
strong match between the recovered component and
the package structure. In other words, the recovered
cluster would indeed represent functional
components. Then, faced with an unknown legacy
system, we could apply the technique to recover its
functional architecture. Now the problem is to
evaluate the match between the clusters and the
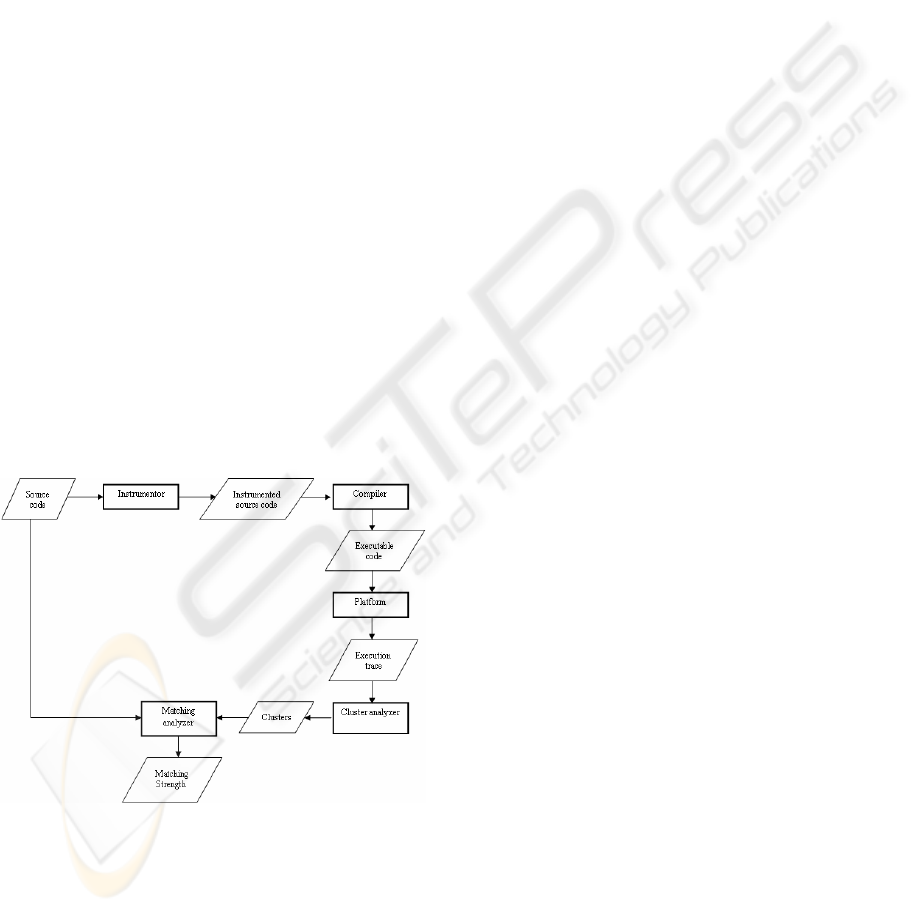
directories. In figure 1 we present the workflow of
the tools we used to perform our experiments.
Starting from the source code, it is first instrumented
to be able to generate the execution trace. The result
is compiled and executed on the target platform.
Then the execution trace file is created. This file is
analyzed to identify the clusters. The set of clusters
is then matched against the packages found in the
source code and the matching strength is computed.
Figure 1: Workflow for the evaluation of the match
As a first approximation, we could have set the
strength of the match as the ratio of the number of
clusters whose classes are all located in the same
package compared to the total number of clusters.
However, this approximation has a strong limitation:
in the case of minimal cluster size (pairs of classes)
even if all the clusters would each be located in a
single directory, they would be far from representing
a good approximation of the original architecture. It
must also be noted that we cannot compute the
match the other way around, starting from the
packages in the source code. In fact, a single
execution of the system is very likely not to involve
all the classes in the system. Therefore the ratio of
packages identified in the clusters compared to all
the packages cannot be a good evaluation of the
match. Another important factor to evaluate the
match is the coverage of the classes in the trace by
the clusters i.e. the ratio of the classes that have been
clusterized compared to the total number of classes
in the trace. Normally the more the coverage the
better, provided that the clusters hold a “significant”
number of classes. In other words, we would not be
happy with a large coverage by “atomic” clusters of
minimal size. All other things being equal, we would
rank higher a clustering where clusters would
contain classes belonging to a single package.
4 EMPIRICAL RESULTS
4.1 Introduction
In our experiment, we chose to set the number of
segments Ns according to the number n of classes in
the trace. In fact, it seems reasonable to claim that
Ns cannot be set independently from n (Dugerdil,
2007b). Then, we performed our clustering
experiments with the following parameters:
Ns = 2*n, 4*n, 8*n, 16*n, 32*n, 64*n
T = 50%, 60%, 70%, 80%, 90%
The resulting clusters are classified by cluster
“type”, where the type represents the number of
packages the contained cluster span. We present the
results as a graph showing the contribution to the
class coverage of each of the cluster category named
after the number of packages spanned. Therefore we
will show the “layer” representing the clusters
whose classes are located in only one package, the
“layer” representing the clusters whose classes are
located in 2 packages and so on. The class coverage
represents the ratio of the classes located in the
clusters over the total number of classes identified in
the trace file. Since a class can simultaneously be
located in several clusters, we present two class
coverage graphs. The first shows the class coverage
taking into account all the duplicates. This is why
the maximum coverage is higher than 100%, This
represents the raw result of our clustering technique.
ICSOFT 2008 - International Conference on Software and Data Technologies
22
Then, we present the same graph but with all the
duplicates removed using the following technique: if
a class is present in a cluster spanning n packages
then we remove it from the clusters spanning n+k
packages with k= 1,2,3. But class coverage is not
enough. In fact, depending on the segmentation
technique, we could end up with an excellent
coverage due to clusters of minimal size (2 classes).
This would definitely not represent a good recovery
of the original architecture. Therefore, it is important
to know the average size of the clusters and the
standard deviation. Finally, we represent the number
of different packages found in the clusters that span
only one package. In fact, even if each cluster has all
its classes in the same package, it is important to
know if all the classes of all the clusters are in the
same package or if there are many packages
involved.
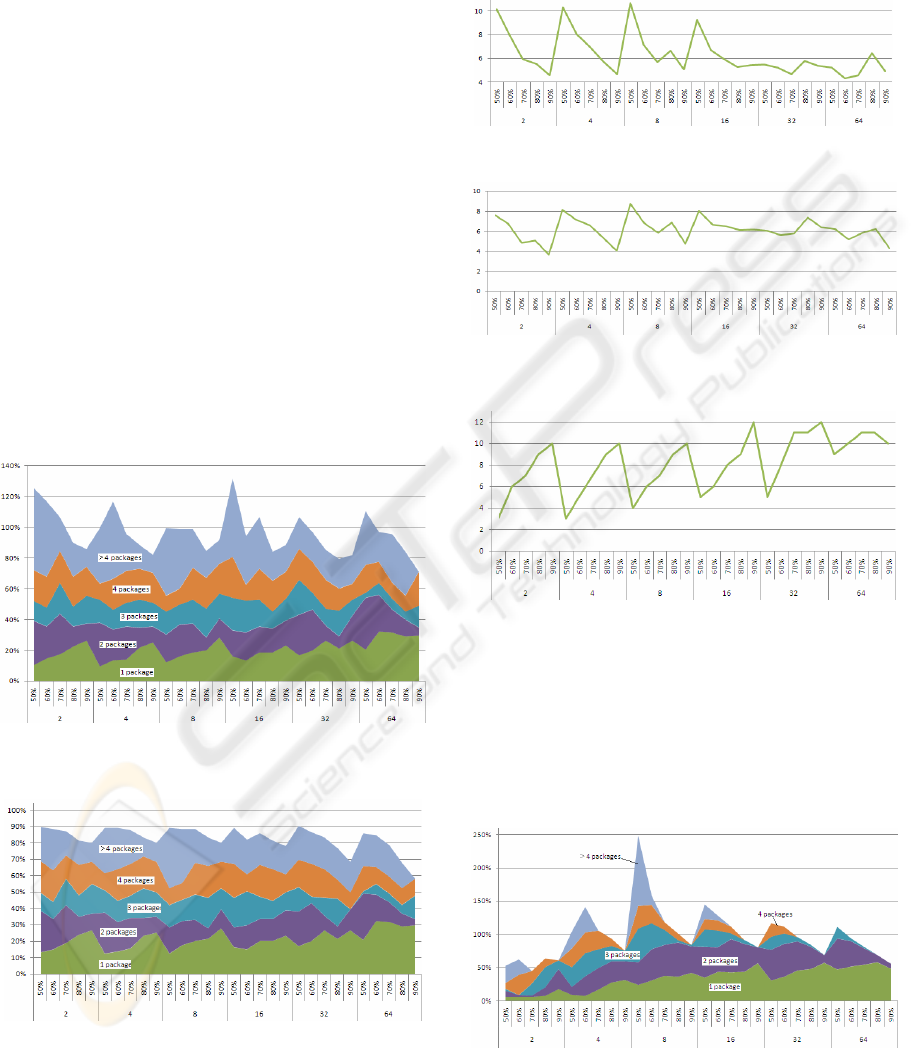
4.2 Results for the First Trace
The execution trace of the first use-case contains
more than 7*10
6
events (method calls). The number
of classes in the trace n = 158.
Figure 2: Class coverage by cluster type with duplicates
classes.
Figure 3: Class coverage by all clusters types without
duplicate classes.
The labels on the horizontal axis of all the
figures represent the number of segments (Ns) and
the correlation threshold (T). Since the number of
segments is a multiple of the number of classes in
the trace, we only display the multiplier (2, 4, 8, 16,
32, 64).
Figure 4: Average number of classes per cluster.
Figure 5: Std deviation of the number of classes per
cluster.
Figure 6: Number of different packages in the case of
clusters located in one package only.
4.3 Results for the Second Trace
The execution trace of the second use-case contains
more than 5.10
5
events, therefore about 10 times less
events than in the first trace. In this second case, the
number of classes in the trace n = 138.
Figure 7: Class coverage by all clusters types with
duplicate classes.
EMPIRICAL ASSESSMENT OF EXECUTION TRACE SEGMENTATION IN REVERSE-ENGINEERING
23
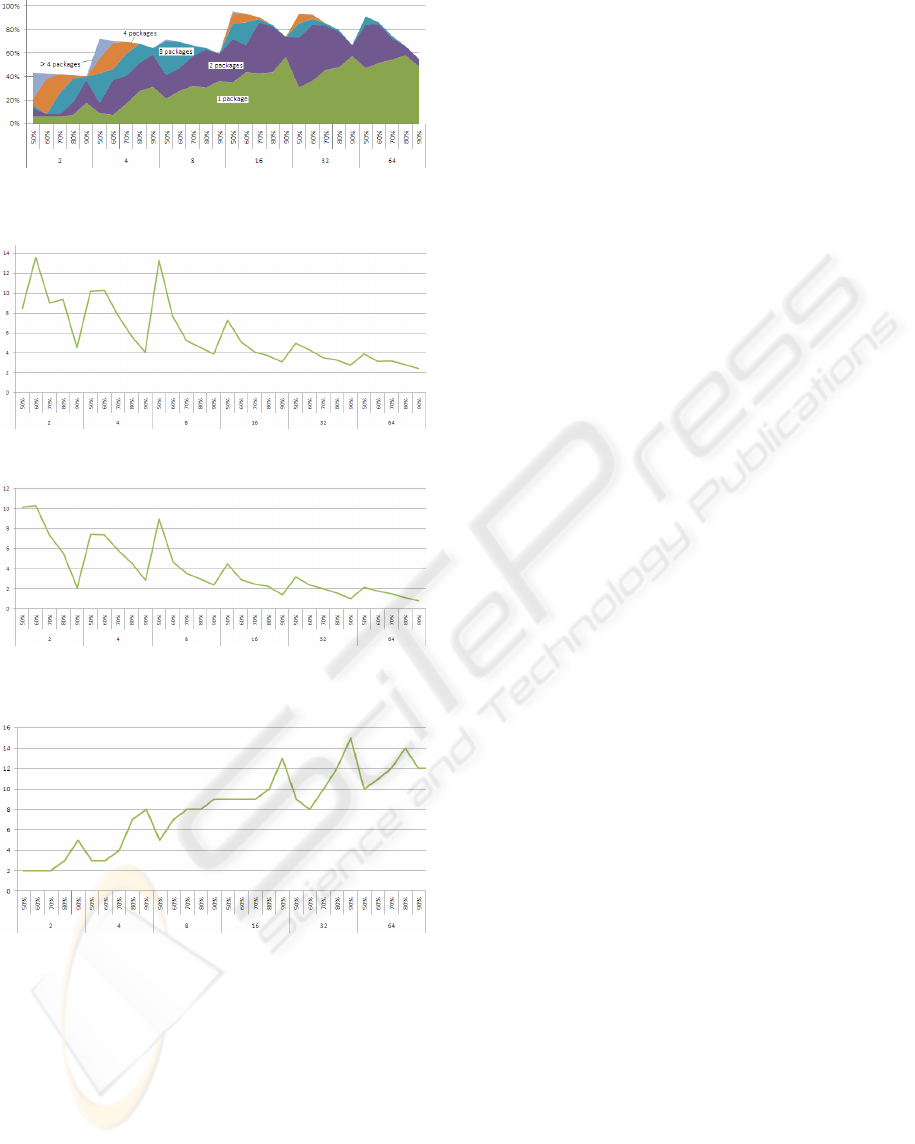
Figure 8: Class coverage by all clusters types without
duplicate classes.
Figure 9: Average number of classes per cluster.
Figure 10: Std deviation of the number of classes per
cluster.
Figure 11: Number of different packages in the case of
clusters located in one package only.
5 DISCUSSION
The first finding is that the duplicate classes in
clusters vary highly among the use-cases. While in
the largest execution trace, we have at most 30%
duplicates, we obtained 150% in the second case.
However, after having removed these duplicates the
interesting fact is that, if one puts aside the
segmentation with a number of segments Ns = 2*n,
we get a high level of class coverage in both
experiments, between 70 and 90 %. But the
important difference between both situations is the
change in coverage ratio with respect to Ns. In the
first case, this ratio is almost insensitive to Ns while
in the second case it changes much with Ns. We may
think that because in the first experiment there are
10 times more events in each segment than in the
second experiment, the correlation between the
classes would be very different in both experiments.
In fact, since the computation of the correlation is
based on the presence or absence of a class in a
segment, we could expect that the larger the size of a
segment the higher the correlation. If this was true,
we should observe much larger clusters in the first
experiment than in the second. But this is not the
case. The cluster size with respect to the number of
segments stays remarkably similar in both
experiments: starting at about 10 to 12 classes on
average per cluster with Ns = 2*n, it stabilizes at
about 3-4 classes in both cases. Although the std
deviation is somewhat different, this result in
encouraging since it tends to suggest that our
technique is robust with respect to the trace size.
Moreover, the variation of the number of classes per
cluster with respect to the correlation threshold T for
each value of Ns shows a striking symmetry in both
experiments. While the number of classes varies a
lot for Ns < 16*n, it stabilizes rapidly with Ns ≥
16*n. Besides, the variation of the average number
of classes per clusters with respect to the correlation
threshold T for a given value of Ns is in accordance
to our expectation: the higher T, the less the number
of correlated classes and the lower the cluster size.
We also observe that, for a given value of Ns, the
higher T the higher the coverage of classes by the
cluster spanning only one package. Again, this is
also in accordance to our expectations: if the system
is well designed then the coupling among classes
(that we measure with our correlation metrics) must
be higher within a given package than among
packages. Therefore, by increasing T, we de-couple
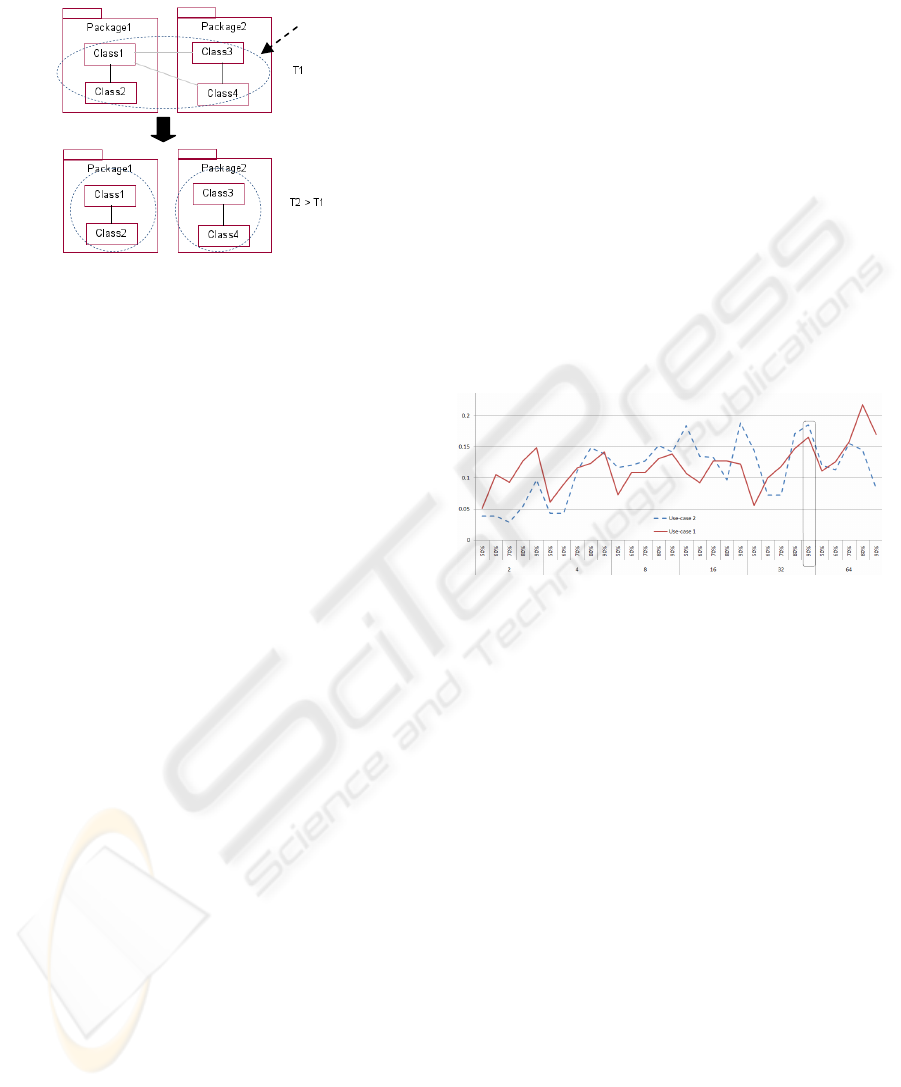
the loosely coupled classes among packages (fig 12).
This phenomenon can be observed for each value of
Ns, but it is much more salient in the low values of
Ns. A key difference in the results of both
experiments, however, is the coverage by the
clusters located in a single package (the lowest
“layer” in the figures 3 and 8): in the largest trace,
the coverage is quite regular whatever Ns (between
15% and 30%) but in the second it goes from 10% to
60%). This suggest that the higher Ns the less the
span of the clusters among several packages. This
again is a good result of our method since it reveals
ICSOFT 2008 - International Conference on Software and Data Technologies
24
the high cohesion and loose coupling feature of the
benchmark system.
Figure 12: De-coupling loosely coupled classes.
Finally, in both experiments we observed a
decrease in the class coverage for Ns > 64*n (not
shown in the figures). This can be easily explained:
the higher Ns the less the computed value of the
correlation between classes therefore the less the
number of clusters.
As a first result of this study, we observed that
the cohesion/coupling nature of a system could be
assessed using our technique. A system whose
packages or modules represent functional
components should therefore exhibit the following
behaviour, when analyzed :
• For 2*n ≤ Ns ≤ 64*n, the ratio of the class
coverage by the clusters located in a single
component should, for each Ns, increase with
T.
• For 50% ≤ T ≤ 90%, the ratio of the class
coverage by the clusters located in a single
component should, for each T, increase with
Ns.
These rules are obviously independent of the
duplicate classes, since we focus on the cluster
located in a single component. Finally, these
experiments did not allow us to find a definite
criterion to set Ns and T for the identification of the
functional components of a legacy system.
6 SEGMENTATION METRICS
Now, we must define a quality metrics to identify
the best segmentation parameters (Ns and T) to use.
First, the metric should highlight the component
discrimination of the segmentation. Then we must
focus on the clusters located each in a single
package (lowest “layer” in figures 2, 3, 7, 8). The
metrics should get its highest value when the
identified clusters are the same as the components
(packages). This is given by the ratio of the number
of different packages over the number of clusters.
The maximum is reached when the number of
clusters are the same as the number of packages (it
could obviously never be bigger). Therefore this
ratio is in the range [0..1]. But this is not enough: the
metrics should also include the class coverage: the
more the classes included in the identified
components the better. Then we define the clustering
quality CQ metric by:
CQ=(Nb of packages/Nb of clusters)*class coverage
Where the number of packages and the number of
clusters concern the clusters whose classes are
located in a single package. The result of this
metrics for each combination of parameters is
displayed in figure 13.
Figure 13: Clustering quality metrics.
When we reverse-engineer a software system, we
must choose a unique value of T for the analysis of
all its execution traces, since this sets the internal
cohesion of the clusters (components). If we used
different values of T then the recovered components
would not all have the same internal cohesion i.e. the
same level of “quality”. Therefore, we must look for
the parameters that provide optimum results taking
all the execution trace of the system into account. In
the experiment presented in this paper we observe
that for both use-cases considered together the
optimum result is found at Ns = 32*n and T = 90%
(see figure 13).
7 RELATED WORK
In the literature, many techniques have been
proposed to recover the structure of a system by
splitting it into components. They range from
document indexing techniques (Marcus, 2004),
slicing (Verbaere, 2003) to the more recent “concept
analysis” technique (Siff, 1999) or even mixed
techniques (Harman, 2002)(Tonella, 2003). All these
cluster
EMPIRICAL ASSESSMENT OF EXECUTION TRACE SEGMENTATION IN REVERSE-ENGINEERING
25

techniques are static i.e. they try to partition the set
of source code statements and program elements into
subsets that will hopefully help to rebuild the
architecture of the system. Then, the key problem is
to choose the relevant set of criteria (or similarity
metrics (Wiggerts, 1997) with which the “natural”
boundaries of components can be found. In the
reverse-engineering literature, the similarity metrics
range from the interconnection strength of Rigi
(Müller, 1993) to the sophisticated information-
theory based measurement of Andritsos and Tzerpos
(Andritsos, 2003)(Andritsos, 2005), the information
retrieval technique such as Latent Semantic Indexing
(Marcus, 2004) or the kind of variables accessed in
formal concept analysis (Siff, 1999)(Tonella, 2001).
Then, based on such a similarity metric, an
algorithm decides what element should be part of the
same cluster (Mitchell, 2003). In dynamic analysis
(Zaidman, 2005) proposed a slicing technique to
cope with the size of the execution trace. The main
idea is to cluster the classes using metrics similar to
the ones used in Webmining projects (the HITS
algorithm used to reference pages in the web). In
another work, Zaidman and Demeyer proposed to
manage the volume of the trace by searching for
common global frequency patterns (Zaidman, 2004).
In fact, they analyzed consecutive samples of the
trace to identify recurring patterns of events having
the same global frequencies. In other words they
search locally for events with similar global
frequency. It is then quite different from our
approach that analyzes class distribution throughout
the trace. In their work, Xiao and Tzerpos compared
several clustering algorithms based on dynamic
dependencies. In particular they focused on the
clustering based on the global frequency of calls
between classes (Xiao, 2005). This approach does
not discriminate between situations where the calls
happen in different locations in the trace. This is to
be contrasted with our approach that analyzes where
the calls happen in the trace. Very few authors have
worked on sampling techniques for trace analysis.
One pioneering work is the one of Chan et al. (Chan,
2003) to visualize long sequence of low-level Java
execution traces in the AVID system (including
memory event and call stack events). But their
approach is quite different from ours. It selectively
picks information from the source (the call stack for
example) to limit the quantity of information to
process. Although the literature is abundant in
clustering and architecture recovery techniques, we
have had a hard time finding any research work
whose results would actually be benchmarked
against some reference clustering, to the notable
exception of Mitchell (Mitchell, 2003) who uses
static techniques. Our approach seems original also
to this respect.
8 CONCLUSIONS
This paper focuses on the systematic assessment of
our dynamic analysis technique for component
identification in reverse engineering. After having
shortly presented the method, we set the framework
for the experiment. In particular, the key feature of
such an assessment is the definition of a benchmark.
Then, we used a well designed system whose
packages truly represent the functional components
of the system. Therefore, the results of our dynamic
analysis method can be compared to the package
structure of the software under study. The closer the
recovered components to the latter structure, the
more efficient the analysis technique. We observed
that our dynamic analysis technique exhibited highly
desirable behaviour like a good sensitivity to the
cohesion / coupling feature of the software under
study. We suggested that our dynamic analysis could
be used to assess the quality of the system studied
(on the cohesion / coupling axis). Next we defined a
Clustering Quality metric (CQ) to compute the
optimal values for Ns and T. We found that Ns =
32*n and T = 90% give the optimal results for both
use-cases in the experiment presented in this paper.
Although these results need further experimentation,
they show that our technique represents an effective
way to identify functional components in legacy
software. Finally, it is worth mentioning that our
statistical approach to dynamic analysis is able to
cope with very large data volume (~10
7
events). As
further work, we will extend this study to systems
written in different languages to see if it is robust
across programming languages.
ACKNOWLEDGEMENTS
This work has been done with the support of HESSO
Grant N° 15989 from the Swiss Confederation,
which is gratefully acknowledged. The author would
also like to thank the computing center (CTI) of the
state of Geneva for their support.
ICSOFT 2008 - International Conference on Software and Data Technologies
26

REFERENCES
Andritsos P., Tzerpos V., 2003 - Software Clustering
based on Information Loss Minimization. Proc. IEEE
Working Conference on Reverse engineering.
Andritsos P., Tzerpos V., 2005 - Information Theoretic
Software Clustering. IEEE Trans. on Software
Engineering 31(2).
Bass L., Clements P., Kazman R.,2003 – Software
Architecture in Practice, 2nd edition. Addison-Wesley
Inc..
Bergey J., Smith D., Tilley S., Weiderman N., Woods S.,
1999 - Why Reengineering Projects Fail. Software
Engineering Institute, Tech Report CMU/SEI-99-TR-
010.
Biggerstaff T. J., Mitbander B.G., Webster D.E., 1994.
Program Understanding and the Concept Assignment
Problem. Communications of the ACM, CACM 37(5).
Chan A., Holmes R., Murphy G.C., Ying A.T.T. , 2003 -
Scaling an Object-oriented System Execution
Visualizer through Sampling. Proc. of the 11th IEEE
International Workshop on Program Comprehension
(ICPC'03),.
Paul Clements, Felix Bachmann, Len Bass, David Garlan,
James Ivers, Reed Little, Robert Nord, Judith Stafford,
2002 - Documenting Software Architectures: Views
and Beyond. Addison-Wesley Professional.
Dugerdil Ph. – 2006 - A Reengineering Process Based on
the Unified Process. Proc. IEEE Int Conf. on software
Maintenance (ICSM’06).
Dugerdil Ph., Jossi S., 2007a- Role based clustering of
software modules: an industrial experiment. Proc.
ICSOFT 2007, Barcelona.
Dugerdil Ph., 2007b - Using trace sampling techniques to
identify dynamic clusters of classes. Proc. of the IBM
CAS Software and Systems Engineering Symposium
(CASCON).
Hamou-Lhadj A., Lethbridge T.C, 2002 – Compression
Techniques to Simplify the Analysis of Large
Execution Traces. Proc. of the IEEE Workshop on
Program Comprehension (IWPC),
Hamou-Lhadj A., Braun E., Amyot D., Lethbridge T. ,
2005 – Recovering Behavioral Design Model from
Execution Traces. Proc. of the European Conference
on Software Maintenance and Reengineering
(CSMR’05).
Harman M., Gold N., Hierons R., Binkeley D., 2002 –
Code Extraction Algorithms which Unify Slicing and
Concept Assignment. Proc IEEE Working Conference
on Reverse Engineering (WCRE’02).
Kazman R., O’Brien L., Verhoef C., 2002 - Architecture
Reconstruction Guidelines, 3rd edition. Software
Engineering Institute, Tech. Report CMU/SEI-2002-
TR-034.
Mitchell B.S., 2003 - A Heuristic Search Approach to
Solving the Software Clustering Problem. Proc IEEE
Conf on Software Maintenance.
Marcus A., 2004 – Semantic Driven Program Analysis.
Proc IEEE Int. Conference on Software Maintenance
(ICSM’04).
Müller H.A., Orgun M.A., Tilley S., Uhl J.S, 1993. - A
Reverse Engineering Approach To Subsystem
Structure Identification. Software Maintenance:
Research and Practice 5(4), John Wiley & Sons.
Siff M., Reps T. . 1999 – Identifying Modules via Concept
Analysis. IEEE Trans. On Software Engineering
25(6).
Tonella P., 2001 - Concept Analysis for Module
Restructuring. IEEE Trans. On Software Engineering,
27(4),
Tonella P., 2003 - Using a Concept Lattice of
Decomposition Slices for Program Understanding and
Impact Analysis. IEEE Trans. On Software
Engineering. 29(6),
Tilley S.R., Santanu P., Smith D.B. - Toward a
Framework for Program Understanding. Proc. IEEE
Int. Workshop on Program Comprehension, 1996
Verbaere M. , 2003 – Program Slicing for Refactoring.
MS Thesis, Oxford University.
Wiggerts T.A., 1997 - Using Clustering Algorithms in
Legacy Systems Remodularization. Proc IEEE
Working Conference on Reverse Engineering (WCRE
'97),
Xiao C., Tzerpos, V., 2005 – Software Clustering basd on
Dynamic Dependencies. Proc. of the IEEE European
Conference on Software Maintenance and
Reengineering (CSMR’2005).
Zaidman A., Demeyer S., 2004 – Managing trace data
volume through a heuristical clustering process based
on event execution frequency. Proc. of the IEEE
European Conference on Software Maintenance and
Reengineering (CSMR’2004).
Zaidman A., Calders T., Demeyer S. Paredaens J., 2005 –
Applying Webmining Techniques to Execution Traces
to Support the Program Comprehension Process. Proc.
of the IEEE European Conference on Software
Maintenance and Reengineering (CSMR’2005).
EMPIRICAL ASSESSMENT OF EXECUTION TRACE SEGMENTATION IN REVERSE-ENGINEERING
27
