
A SIMILARITY MEASURE FOR MUSIC SIGNALS
Gonc¸alo Marques
Instituto Superior de Engenharia de Lisboa, Portugal
Thibault Langlois
Universidade de Lisboa, Faculdade de Ciˆencias, Departamento de Informatica, Portugal
Keywords:
Music Information Retrieval, Music Similarity Measure, Audio Signal Processing, Feature Extraction.
Abstract:
One of the goals in the field of Music Information Retrieval is to obtain a measure of similarity between two
musical recordings. Such a measure is at the core of automatic classification, query, and retrieval systems,
which have become a necessity due to the ever increasing availability and size of musical databases. This
paper proposes a method for calculating a similarity distance between two music signals. The method extracts
a set of features from the audio recordings, models the features, and determines the distance between models.
While further work is needed, preliminary results show that the proposed method has the potential to be used
as a similarity measure for musical signals.
1 INTRODUCTION
Nowadays there is an enormous amount of digital mu-
sic available on-line, and users can search through
vast databases to select their favorite albums, artists,
songs, and create their own databases or playlists.
Even at a personal level, one can create fairly large
music collections by transferring ones CDs to a com-
puter or an iPod. Nevertheless, with the rapidly in-
creasing amount of digital data it is necessary to have
some means of indexing,searching and retrieving mu-
sic contents. Theses tasks are aided by including
some information along with a song (metadata), typ-
ically annotated manually by an expert or by the user.
Nevertheless, metadata is not always provided or in
some cases is erroneous, and with the every increas-
ing number of new songs, the required manual work
becomes prohibitive.
Similarity is the core of classification and ranking
algorithms, thus, having an automatic way of mea-
suring similarities between two songs would be a
valuable tool in the field of Music Information Re-
trieval. Such a tool would have many applications
such as making database queries by user-provided ex-
amples (Spevak and Favreau, 2002; Heln and Virta-
nen, 2007), automatically organizing and classifying
digital audio collections (Neumayer et al., 2005), au-
tomatic playlist generation (Aucouturier and Pachet,
2002b; Logan and Salomon, 2001), providing per-
sonal musical recommendations, etc.
In order to measure the similarity between songs
it is necessary to characterize each song with a set
of features and to determine a distance between sets.
There is an extensive number of features that can be
used for this purpose, since the question of similarity
can be answered from multiple perspectives. For in-
stance, one could include features that are not directly
related to the audio signals, such as lyrical contents,
geographical origins, historical periods, artists infor-
mation, reviews, etc. This type of information is well
suited for Web-based methods, and a various works
exist on this subject - for example (Whitman and Ellis,
2004; Baumann et al., 2004; Pampalk et al., 2005a).
In this paper we are interested in deriving a mea-
sure of similarity solely based on the music signal,
without any additional information. There are several
features that can be extracted directly from the audio
signal, and there are many ways of using them to ob-
tain a similarity measure between songs. The most
common approach for obtaining the features is to di-
vide the signal into short overlapping frames (typi-
cally 10ms to 40ms long) and use each frame to ex-
tract time domain information such as the zero cross-
ing rate, or some spectral domain information such
as the fast Fourier transform (FFT), or the Mel fre-
quency cepstrum coefficients (MFCCs). These can be
directly used as features vectors, or one can be incor-
porated some additional statistics of each audio seg-
ment such as the spectral centroid, spectral flux, his-
tograms, etc. Once the features are extracted, there
308
Marques G. and Langlois T. (2008).
A SIMILARITY MEASURE FOR MUSIC SIGNALS.
In Proceedings of the Tenth International Conference on Enterprise Information Systems - AIDSS, pages 308-312
DOI: 10.5220/0001707903080312
Copyright
c
SciTePress
are a few ways of obtaining a similarity measure.
A model can be constructed for the feature vectors,
and then, the distances between models from different
musics can be determined. For instance (Tzanetakis
and Cook, 2002; Pampalk et al., 2005b; Aucouturier
and Pachet, 2002a; Heln and Virtanen, 2007) use a
Gaussian mixture model, and (Logan and Salomon,
2001; Berenzweig et al., 2004) apply a k-means algo-
rithm to model the features. Then the modelsare com-
pared using different techniques such as Monte Carlo
sampling (Aucouturier and Pachet, 2002a), Kullback-
Leibler divergence (Virtanen and Heln, 2007), likeli-
hood approximation (Berenzweig et al., 2004), ... (for
a review of the main methods see (Aucouturier and
Pachet, 2004) and references therein).
In this paper, we present a method for construct-
ing a distance measure between musics based on their
audio contents. The organization of this paper is as
follows. In section 2 we describe the process of ob-
taining the features and we present the method for de-
termining the similarity measure. Experimental re-
sults are presented and analyzed in section 3. Finally,
some conclusions are drawn and possible directions
for future work are presented.
2 OVERVIEW OF THE METHOD
Our goal is to estimate a similarity measure between
different pieces of music. The first step consist in
computing the spectrogram of the music and finding
the most representative frames. This set of frames is
then used to compute a “distance” between this music
and other signals. This is done by calculating the av-
erage minimum distance between the FFT vectors of
the audio signal and the representative frames found
in the first music.
2.1 Representative Frames
The first step consist in finding representative frames
for each music. First, from the audio signal sam-
pled at 44.1KHz, the spectrogram is computed using
a 1024 samples windows with 50% overlap. Let F
A
be the set of FFT vectors of every frame of music A.
Let F
′A
be the subset of F
A
that corresponds to a
30 seconds excerpt of the middle of music A. Then,
the k-means algorithm is used on this subset to find
k centroids (c
A
i=1..k
) that will represent the music. Ac-
cording to the parameter used to compute the FFT, the
FFT vectors are in a 512-dimensional space.
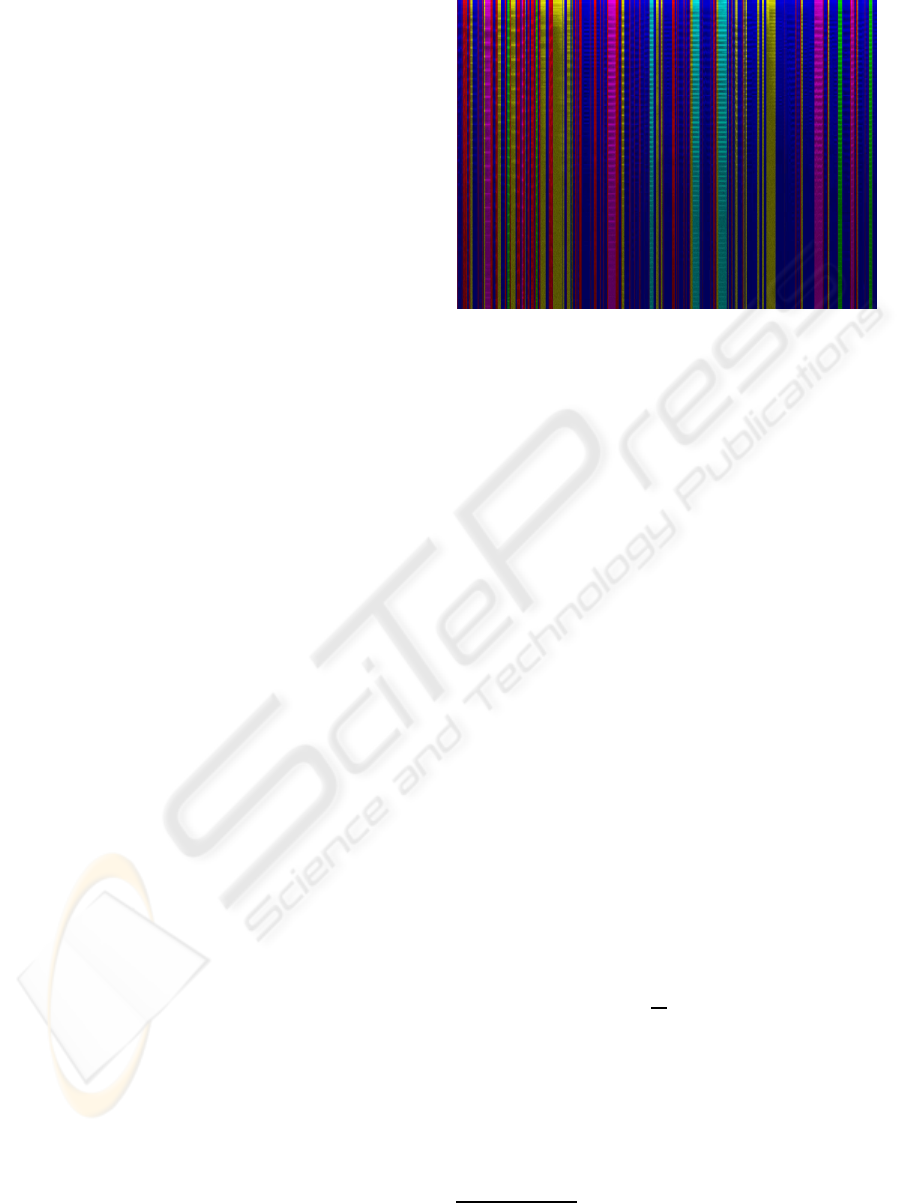
In our experiment, we used k = 6. The figure 1
shows the different clusters obtained on a spectrogram
Figure 1: An example of spectrogram. The color indicates,
for each frame, the corresponding cluster.
(each frame is colored according to the nearest cen-
troid).
2.2 Similarity
In order to compute the similarity between a music A
and a music B, we consider a set F
B
n
(n = 1..N) of 30
seconds-sequences of music B
1
. For each portion of
music F
B
n
, the euclidean distance between each vec-
tor f
B
t
in F
B
n
and each centroid of A (c
A
i=1..k
) is com-
puted. The time indice t corresponds to the indice of
the FFT frames. For each frame the distance to the
nearest centroid is recorded:
D (A, f
B
t
) = argmin
j
(dist( f
B
t
,c
A
j
)) ∀t ∈ j = 1..k
This set of distances is then averaged to give the the
similarity between music A and the portionF
B
n
of mu-
sic B:
S (A,F
B
n
) =
∑
t
D (A, f
B
t
) (1)
Because we are interested in a similarity measure
between music A and the whole B music, we define
the similarity measure as the average similarity over
all portions F
B
n
:
S (A,B) =
1
N
N
∑
n=1
S (A,F
B
n
) (2)
The following section shows some results obtained
when comparing various kinds of musical pieces us-
ing this similarity measure.
1
The signal is cut in 30 second sequences in order to
save computing resources.
A SIMILARITY MEASURE FOR MUSIC SIGNALS
309
3 EXPERIMENTS AND RESULTS
In order to evaluate the proposed similarity measure,
we extracted three musics from three albums from
very different artists: Sade, The Clash and Frederic
Chopin. The goal of this first test is to verify ex-
perimentally that the similarity measure makes sense
when very different kinds of sounds are compared.
The tracks chosen for this experiment are:
Artist - Album - Title
A Sade - Love Deluxe - No Ordinary Love
B Sade - Love Deluxe - Feel No Pain
C Sade - Love Deluxe - I Couldn’t Love you more
D The Clash - London Calling - London Calling
E The Clash - London Calling - Hateful
F The Clash - London Calling - Brand new Cadillac
G Frederic Chopin - Nr. 11 g-moll op. 37/1: Andante
sostenuto
H Frederic Chopin - Nr. 14 fis-moll op. 48/2: An-
dantino
I Frederic Chopin - Nr. 20 cis-moll op. posth.: Lento
con gran espressione
The capital letters will be used for shorter reference.
3.1 Similarity between Different Kinds
of Music
The similarity matrix, computed for the musics A - I
is represented in this table:
A B C D E F G H I
A 323 315 368 412 431 475 626 570 630
B 337 293 361 391 396 471 554 500 560
C 357 352 324 500 534 547 395 423 417
D 491 453 579 324 363 417 1043 967 1034
E 482 430 559 360 297 455 1054 984 1044
F 498 460 556 352 364 351 892 816 889
G 863 864 700 1014 1051 902 300 288 314
H 799 798 651 929 968 825 318 280 315
I 819 809 666 939 972 827 301 280 299
As seen above, the similarity measure is not symmet-
ric. It is interesting to note that in most cases the
shortest distance is between a music and itself (i.e.
the smallest values are on the diagonal). The only ex-
ception occurs for music I.
The measure of similarity can be easily be adapted
to yield a symmetric distance:
d(A,B) = (S (A,B) + S (B, A))/2
where d(A,B) represents the distance between musics
A and B. The image in figure 2 represent the distance
Figure 2: Picture of the matrix of distances between music
pieces A – I.
matrix. Tracks are ordered from A to I starting at the
upper left corner. Dark squares correspond to small
distances. One can see clearly three clusters that cor-
respond to the pieces from the same author. Accord-
ing to the distance measure, The Clash is closer to
Sade than it is to Frederic Chopin, which corresponds
to our expectations.
3.2 Similarity between Portions of
Tracks
In this experiment we use the same set of tracks as be-
fore but we consider each 30 seconds-long sequences
extracted from each track as a different music. The
distance matrix is computedas before and represented
as an image (see figure 3) but this time a logarithmic
scale is used to represent the gray levels.
At this scale, one can see three clusters that cor-
Figure 3: Picture of the matrix distance between all 30 sec-
onds portions of music A – I.
ICEIS 2008 - International Conference on Enterprise Information Systems
310

respond to the three artists. Within each cluster, the
lighter pixels indicate that certain segments of a given
music are not that close to the centroids of another
portion of the same music. This is not surprising,
since different instruments may be used on different
segments.
3.3 Similarity between Musics with
Different Instruments
The objective of this experiment is to evaluate the
ability of the proposed similarity measure to capture
timbral characteristics of differentinstruments. In this
experiment we use three kinds of classical music fea-
turing a piano solo, a piano and cello, and a cello solo:
Artist - Album - Title
H Frederic Chopin - Nr. 14 fis-moll op. 48/2: An-
dantino
I Frederic Chopin - Nr. 20 cis-moll op. posth.: Lento
con gran espressione
J Rostropovitch, Britten - Frank Bridge - Sonata for
viloncello and piano part 1
K Rostropovitch, Britten - Frank Bridge - Sonata for
viloncello and piano part 2
L Janos Straker - Bach Suite for Solo Cello - Suite
No. 1 in G Major
M Janos Straker - Bach Suite for Solo Cello - Suite
No. 3 in C Major
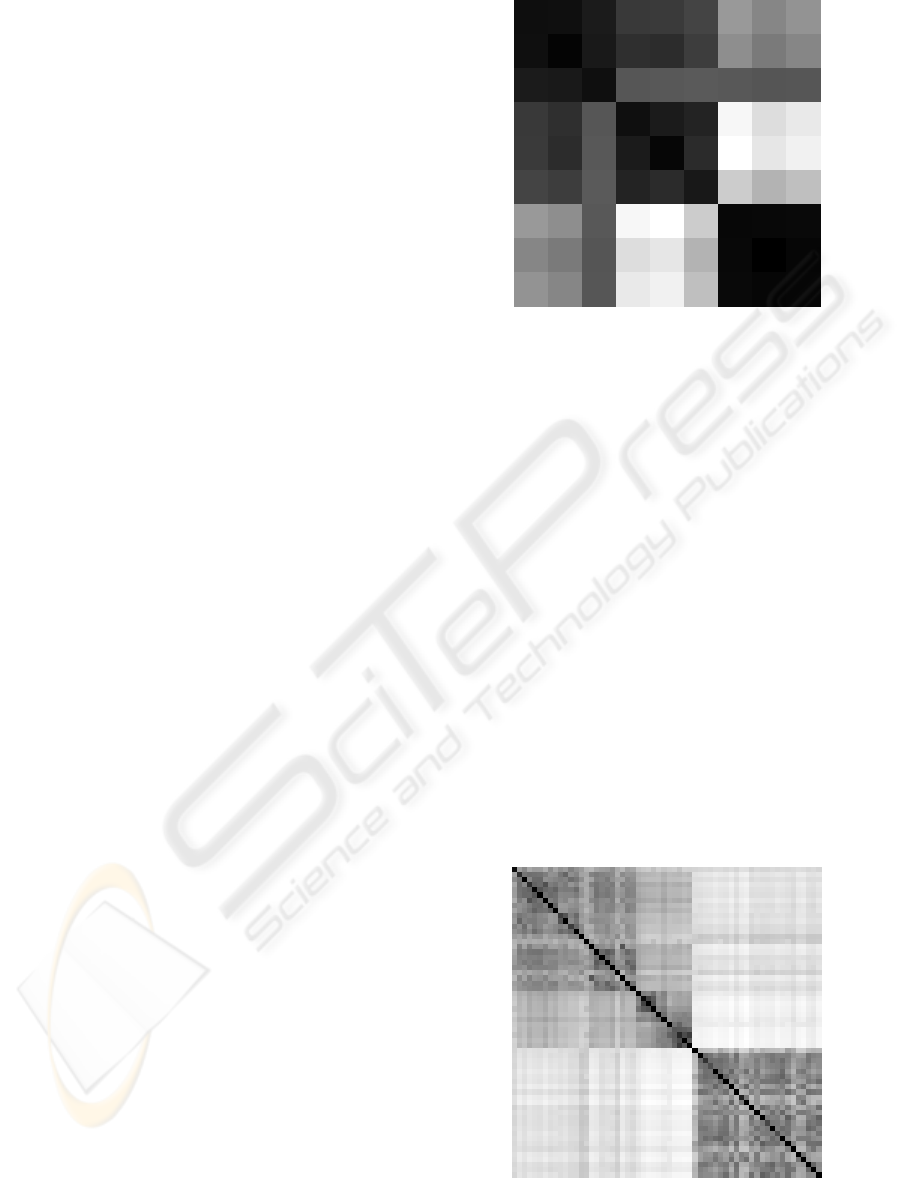
The matrix distance is represented as before by a
gray-scale image (figure 4) with tracks in the follow-
ing order: H, I, J, K, L, and M starting at the upper
right corner. Again, darker squares represent shorter
distances.
Figure 4: Picture of the matrix distance calculated between
music pieces H, I, J, K, L and M.
The gray cross visible on the image indicates
that musics J and K that feature cello and piano are
roughly equidistant from musics H and I and from
musics L and M. Our interpretation of these results
is that in the first two pieces (H and I), clusters will
represent various instances of piano sounds and clus-
ters of musics (L and M) will represent cello. Then,
as Frank Bridge sonatas feature piano and cello, the
corresponding FFT vectors are likely to be close to a
piano cluster or to a cello cluster.
4 CONCLUSIONS AND FUTURE
WORK
A new distance measure for estimating similarity be-
tween audio signals was presented. Preliminary re-
sults on a set of musics show that the distance measure
meet our expectations in terms of perceptual similar-
ities. The proposed distance does not capture high
level features of the music like beat or melody but
musics with similar sounds are indeed recognized as
similar. This characteristic is an interesting feature
that indicates that our distance may be used for clus-
tering audio signals based on timbre.
Ongoing work focus two main directions: on one
hand these preliminary results have to be confirmed
on a larger database, and several parameters like
the number of centroids used in the clustering phase
should be better understood and optimized. On the
other hand, following the last experiment described
in this paper, we are working on methods that use
this approach in order to cluster a set of music tracks
according to the instruments used or to the timbre
present in the signal.
ACKNOWLEDGEMENTS
This work was supported by EU and FCT, through
LaSIGE Multiannual Funding Programme, and by the
Department EETC of ISEL.
REFERENCES
Aucouturier, J.-J. and Pachet, F. (2002a). Music similarity
measures: What’s the use? In ISMIR, Paris, France.
Aucouturier, J.-J. and Pachet, F. (2002b). Scaling up music
playlist generation. In ICME, Lausanne, Switzerland.
Aucouturier, J.-J. and Pachet, F. (2004). Improving timbre
similarity: How high is the sky? Journal of Negative
Results in Speech and Audio Sciences, 1(1).
A SIMILARITY MEASURE FOR MUSIC SIGNALS
311

Baumann, S., Pohle, T., and Shankar, V. (2004). Towards
a socio-cultural compatibility or MIR systems. In IS-
MIR, Barcelona, Spain.
Berenzweig, A., Logan, B., Ellis, D., and Whitman, B.
(2004). A large-scale evaluation of acoustic and sub-
jective music similarity measures. Computer Music
Journal, 28(2):63–76.
Heln, M. and Virtanen, T. (2007). Query by example of au-
dio signals using euclidean distance between gaussian
mixture models. In ICASSP, Honolulu, USA.
Logan, B. and Salomon, A. (2001). A music similarity func-
tion based on signal analysis. In ICME, Tokyo, Japan.
Neumayer, R., Lidy, T., and Rauber, A. (2005). Content-
based organization of digital audio collections. In Pro-
ceedings of the 5th Open Workshop of MUSICNET-
WORK, Vienna, Austria.
Pampalk, E., Flexer, A., and Widmer, G. (2005a). Hier-
archical organization and description of music collec-
tions at the artist level. In ECDL, Vienna, Austria.
Pampalk, E., Pohle, T., and Widmer, G. (2005b). Improve-
ments of audio-based music similarity and genre clas-
sification. In ISMIR, London, UK.
Spevak, C. and Favreau, E. (2002). Soundspotter - pro-
totype system for content-based audio retrieval. In
DAFX, Hamburg, Germany.
Tzanetakis, G. and Cook, P. (2002). Musical genre classi-
fication of audio singals. IEEE Trans. on Speech and
Audio Processing, 10(5):293–302.
Virtanen, T. and Heln, M. (2007). Probabilistic model based
similarity measures for audio query-by-example. In
WASPAA, NY.
Whitman, B. and Ellis, D. (2004). Automatic record re-
views. In ISMIR, Barcelona, Spain.
ICEIS 2008 - International Conference on Enterprise Information Systems
312
