
THE SWARM EFFECT MINIMIZATION ALGORITHM
Utilized to Optimise the Frequency Assignment Problem
Grant Blaise O’Reilly and Elizabeth Ehlers
Academy for Information Technology, University of Johannnesburg,Auckland Park, Johannesburg, South Africa
Keywords: Swarm intelligence, stigmergy, frequency assignment problem, NP-complete problem.
Abstract: The swarm effect minimization algorithm (SEMA) is presented in this paper. The SEMA was used to
produce improved solutions for the minimum interference frequency assignment problem (MI-FAP) in
mobile telecommunications networks. The SEMA is a multi-agent orientated design. The SEMA is based on
the stigmergy concept. The stigmergy concept allows the actual changes in the environment made by
entities in a swarm to act as a source of information that aids the swarm entities when making further
changes in the environment. The entities do not blindly control the changes in the environment the actual
changes guide the entities. The SwarmAFP is tested against the COST 259 Siemens bench marks as well as
tested in a commercial mobile telecommunications network and the results are presented in this paper.
1 INTRODUCTION
The frequency assignment problem (FAP) is a daily
occurrence in second generation (2G) mobile
telecommunications networks. A large saving in
revenue could be made by mobile network operators
if a model were presented that could improve
optimization of the FAP more efficiently and in less
time. The FAP focused on in this paper is the
minimum interference frequency assignment
problem (MI-FAP) with a fixed spectrum. The FAP
is a NP-complete problem (Grotschel 2000,
Eisenblätter 2000). There are a number of
techniques that have been used to try and optimize a
solution in an NP-complete problem to a level that is
acceptable (Eberhart et al., 2001, Bonabeau et al.,
1999, Dorigo et al., 1999). The success of these
techniques is measured by the time it took to reach
an acceptable solution as well as the efficiency of
the acceptable solution. The FAP is practically
unsolvable for real mobile telephone networks and
approximate algorithmic methods that obtain
solutions close the absolute minimum in a
reasonable time frame need to be used. It is beyond
the scope of this paper to give a detailed discussion
on all the proposed optimization algorithms for FAP.
However, a survey of all the optimization algorithms
and additional references can be found (Aardal et
al., 2001, Eisenblatter and Koster, 2007).
In this paper the swarm effect minimization
algorithm (SEMA) will be presented and discussed.
SEMA is an algorithm based on stigmergy.
The
SEMA is a multi-agent orientated application
design. The SEMA was utilized to try and improve
the optimization of the minimum interference
frequency assignment problem (MI-FAP). The
results produced by the SEMA were compared to the
COST 259 Siemens bench marks (Eisenblatter and
Koster, 2007). The SEMA was also applied to a
commercial, operational mobile telephone network
and the results are presented in this paper.
2 STIGMERGY
Stigmergy is the coordination of tasks and regulation
of constructions (e.g. a termite mound in a termite
colony) in an environment that depends not on the
entities, but on the constructions themselves
(Kristensen 2000, Valckenaers et al., 2001). The
entities do not direct the work but are guided by it.
In the swarm effect, stigmergy is defined as the
influence the changing environment has on the
entities in the environment. The constructions
created by the entities in the environment are
assumed to form part of the environment. These
constructions change the environment and the
changing environment stimulates a certain response
in the agents. In stigmergy the fundamental
mechanism is the ability to use the environment as a
397
Blaise O’Reilly G. and Ehlers E. (2008).
THE SWARM EFFECT MINIMIZATION ALGORITHM - Utilized to Optimise the Frequency Assignment Problem.
In Proceedings of the Tenth International Conference on Enterprise Information Systems - AIDSS, pages 397-402
DOI: 10.5220/0001671803970402
Copyright
c
SciTePress

shared medium for storing information so that other
individuals can interpret it (Heylighen, 1999).
3 THE SWARM EFFECT
MINIMIZATION ALGORITHM
The swarm effect minimization algorithm (SEMA)
is based on a swarm of agents making changes in the
environment in which they exist. The continual
changes induced in the environment act as a growing
information base which the agents utilize to make
further more informed changes. When applying the
SEMA to the FAP, in particular the MI-FAP, the
environment will represent the mobile telephone
network. The cells in the network will represent the
swarm agents and will be referred to as cell agents.
Each cell agent will contain a list of its channels and
each channel will require a carrier i.e. frequency.
The environment will be represented by the
collective memory map. The collective memory map
is a data structure containing information on all the
cell agents. The cell agents in the cellular network
make localized changes that result in a globalized
effect.
The algorithm utilizes a heuristic cost function to
determine the minimum interference or network
quality due to interference (NQI) (see equation 1
(Eisenblätter 2000)). The first step in the algorithm
is to load the interference matrix. An interference
matrix (IM) is a model of all the interference in the
network, i.e. it describes how the cell’s frequencies
are interfering with the neighbouring cell’s
frequencies. Each row in the IM represents a cell in
the cellular network while each column represents
an interfering cellular network cell.
Mobile measurement reports (MMRs) are used
to generate an interference matrix (Eisenblätter
2000). MMR data can be extracted from the base
station controller (BSC) in the network. This data is
utilized to build up the cell agents. From this data
each cell agent is able to build up a list of interferers,
neighbours and transceivers (TRX). Interference
between two cells in the IM is measured by the
frame erasure rate (FER). To calculate the FER the
frame erasure probability (FEP) is needed. The FEP
is calculated for all the measurements collected on
the specific cell and its interferers. These
measurements are summed and then divided by the
total number of MMRs as in equation 2 (Kuurne,
2001). The FEP is defined in equation 4. The
constants a and b are used to fit the curve to actual
broad casting control channel (BCCH) FEP and
traffic channel (TCH) FEP measurements in the
network. To calculate the FEP the carrier to
interference ratio (CIR) is needed. The CIR is
defined in equation 3. The CIR is calculated using
the data in the MMR, namely the BSPower,
rxlevelsub for the serving cell (i.e cell agent) and the
rxlevel for all the potential interferers. The BSPower
indicates the reduction from nominal power in steps
of 2dB emitted by the channel used by the call that
originated the MMR. To eliminate the effect of
power control the BSPower*2 needs to be added to
the carrier power level in an MMR. The rxlevelsub
is actually the carrier power level measured on the
slow associated control channel (SACCH). The
rxlevel reports the average signal strength during a
measurement period.
∑
∑
∈
=−
∈
=
+=
Evw
wyvy
adj
Evw
wyvy
co
vwcvwcNQI
feasibley
1|)()(|)()(
min
)()(
where
• v,w are carriers and represent transceivers (TRX).
• c
co
(vw) and c
ad
(vw) denote the co-channel and
adjacent channel respectively, which may occur
between v and w
• y(v) Є C where C= all available channels at
carrier v\
• |y(v) - y(w)|
≥
d(vw) where d(vw) gives the
separation necessary between channels assigned
to v and w
(1)
FER = ∑
i,j
FEP/ (Total number of MMRs)
(2)
CIR
i,j
= C – I
i,j
where
• C=BSPower*2 + rxlevelSubservercell.
• Ii,j=Potential interferer’s rxlevel (dBm).
• Each MMR contains up to six I-values.
(3)
bCIRa
e
FEP
ij
+
+
=
1
1
(4)
All the cell agents are referenced from the
collective memory map. Once all the cell agents
have been created the process begins. The swarm of
agents is created by iterating through the collective
memory map and spawning each cell agent. Each
cell agent then determines its interference. An
important rule is that a cell agent is only allowed to
adjust its own channels. The cell agent cannot adjust
its interferer’s or neighbour’s channels. A cell agent
will adjust its own channels depending on how the
channels interferer with other cell agents’ channels
(i.e. the cell agent’s interferers and neighbours
channels). Weights are assigned to each channel
depending on the amount of interference that
channel is experiencing. Thus a channel with a large
ICEIS 2008 - International Conference on Enterprise Information Systems
398

amount of interference will have a large weighting.
If a certain channel of the cell agent interferes with a
channel from one of the cell agent’s interferers or
neighbours then that specific channel is weighted
accordingly.
If the interference is co-channel i.e. the channels
have the same frequency values then the channel is
weighted for co-channel interference. Similarly, if
the interference is adjacent channel interference i.e.
the channels are adjacent to each other (separated by
one) then the channel is weighted for adjacent
channel interference. The weightings are found in
the interference matrix. Channels are also checked
against locally blocked channels, handovers, co-site
and co-cell separation. Channels violating these
checks are weighted heavily i.e. a large value
typically 1000. Thus channels with the lowest
weighting are queued to the front of the selection
queue while the highest weighted channels are
queued at the back. Once the cell agent has picked
the channels with the least interference from the
selection queue (i.e. the best channels) it will update
its channels with these selections.
If the cost value or NQI (defined in equation 1
(Eisenblätter 2000)) is greater than the previous cost
value then the localized adjustments made by the
cell agent are not beneficial to the collective. Non
beneficial adjustments are dropped and the old
channels of the cell agent are reloaded. The cost
value is then assigned to the previous cost value. In
the case where the cost value is equal to the previous
cost then no adjustment has been made i.e. the cell
agent is content with its current channel settings.
If the cost is less than the lowest cost then the
cell entities have made a localized adjustment to
their channels that have benefited the collective. In
this scenario the global interference is lower than it
was previously and the adjustment is accepted. The
lowest cost is then set to the current cost and the
collective memory map is update with the recent
changes. The process is terminated by the user once
a satisfactory cost value is achieved.
Predators are introduced into the system when
trying to break a local minimum. A local minimum
can be defined as a minimum found by the system
but that minimum is not a global minimum.
Predators are used to cause perturbations in the
collective by randomly selecting a cell agent and
then randomly changing the cell agent’s channels. If
the cell agents are randomly changed this will cause
a major perturbation in the interference resulting in a
change in the cost value or NQI. If the change
caused by the predators is within a certain threshold
value then the change is allowed otherwise the
change is dropped and another attack by the
predators is allowed. Each predator will only select
and attack a single cell agent out of the collective. A
beta parameter is used to reduce the number of
predators every time a new lowest cost is found. An
alpha parameter is used to reduce the threshold value
as time progresses.
At startup the threshold value will be set large
enough so that the system will accept many of the
changes made by the predators i.e. the system is very
volatile allowing a greater search space. However, as
the process matures the selection on changes caused
by the predators will become more conservative.
Thus, allowing the process to be less volatile as it
matures. As the process matures the threshold value
will grow smaller allowing the process to settle into
a more stable state.
4 COST 259 BENCHMARK
The effectiveness of the swarm effect algorithm is
demonstrated by applying the algorithm to the
COST 259 benchmarks (Eisenblatter and Koster,
2007). These instances are widely used in the mobile
telephone industry. The best cost values found by
the SEMA for the Siemens instances were compared
to the following: DTS (Glamorgan) a dynamic tabu
search method (Eisenblatter and Koster, 2007),
KTHIN a simulated annealing combined with
dynamic programming to compute local optima
method (Mannino et al., 2002),, TUHH a simulated
annealing (Beckmann and Killat, 1999). RWTH a
threshold accepting method (Hellebrandt and Heller,
2000) TA a threshold accepting method (Hellebrandt
and Heller, 2000) and U(Siemens) an unknown
method (Eisenblatter and Koster, 2007). The COST
259 scenarios used are described in Table 1.
The results from these methods were obtained
from the FAP website (Eisenblatter and Koster,
2007) and are presented in Table1. The comparison
of these results and the results obtained with the
SEMA are also presented in Table 1. The columns
described in table 1 are the total cost, the maximum
co-channel, adjacent channel and TRX values as
well as the total number TRX pairs exceeding an
interference of x where xЄ(0.01, 0.02, 0.03, 0.04).
The emphasis was on the ultimate quality of the
solution so the SEMA solutions did not take time
into consideration i.e. the application was run until
an acceptable solution was found. However, it
should be emphasized that the SEMA can produce
satisfactory results in times that range from 45
minutes to several hours. These times are acceptable
THE SWARM EFFECT MINIMIZATION ALGORITHM - Utilized to Optimise the Frequency Assignment Problem
399

in a commercial environment. For example a cost
minimization value of 3.21 was achieved in 45
minutes for the Siemens 1 scenario utilizing ten
predators, alpha = 0.95 and beta = 0.99. Best results
were found when using less than twenty predators,
0.9≤alpha≤0.99 and 0.9≤beta≤0.999 in all the COST
259 scenarios.
Table 1: COST 259 Siemens scenarios.
Siemens 1: GSM 900 network with 179 active sites, 506 cells, and an average of
1.84 TRXs per cell. The available spectrum consists of two blocks containing 20
and 23 frequencies, respectively
TRX pairs exceeding App Cost Co Adj TRX
.01 .02 .03 .04
K-THIN 2.20 0.03 0.03 0.05 33 4 1 0
TUHH 2.78 0.04 0.04 0.08 60 14 6 0
RWTH 2.53 0.03 0.03 0.06 48 11 3 0
TA 2.30 0.03 0.03 0.05 43 7 2 0
U 3.36 0.05 0.04 0.12 78 25 10 3
SEMA 2.35 0.03 0.03 0.06 44 9 2 0
Siemens 2: GSM 900 network with 86 active sites, 254 cells, and an average of
3.85 TRXs per cell. The available spectrum consists of two blocks containing 4
and 72 frequencies, respectively
TRX pairs exceeding App Cost Co Adj TRX
.01 .02 .03 .04
DTS 14.28 0.11 0.02 0.20 343 89 24 18
K-THIN 14.27 0.07 0.02 0.16 359 71 27 17
TUHH 15.46 0.07 0.02 0.18 404 109 42 20
RWTH 14.75 0.06 0.02 0.17 268 91 34 13
TA 15.05 0.11 0.02 0.20 381 92 37 15
U 17.33 0.08 0.02 0.20 462 148 47 18
SEMA 14.86 0.08 0.02 0.17 364 87 41 14
Siemens 3: GSM 900 network with 366 active sites, 894 cells, and an average of
1.82 TRXs per cell. The available spectrum comprises 55 contiguous frequencies.
TRX pairs exceeding App Cost Co Adj TRX
.01 .02 .03 .04
DTS 5.19 0.04 0.03 0.07 88 14 3 0
K-THIN 4.73 0.03 0.02 0.08 80 6 0 0
TUHH 6.75 0.05 0.03 0.11 137 31 9 2
RWTH 5.63 0.03 0.03 0.07 103 15 3 0
TA 5.26 0.04 0.03 0.07 87 10 3 0
U 8.42 0.05 0.04 0.12 188 47 18 6
SEMA 5.76 0.03 0.03 0.08 101 28 3 0
Siemens 4: GSM 900 network with 276 active sites, 760 cells, and an average of
3.66 TRXs per cell. The available spectrum comprises 39 contiguous frequencies
TRX pairs exceeding App Cost Co Adj TRX
.01 .02 .03 .04
DTS 81.88 0.20 0.05 0.43 2161 971 547 344
K-THIN 77.25 0.19 0.05 0.36 2053 871 445 282
TUHH 89.15 0.24 0.03 0.53 2350 1056 591 368
RWTH 83.57 0.18 0.04 0.35 2251 1006 540 343
TA 80.97 0.17 0.03 0.36 2143 933 502 328
U 105.82 0.27 0.04 0.53 2644 1286 798 562
SEMA 81.96 0.21 0.05 0.48 2181 991 549 353
5 RESULTS OF
IMPLEMENTATION
The SEMA was tested on a commercial mobile
telecommunications network in South Africa,
namely MTN. The SEMA was applied to one
operational base station controller (BSC). There
were 349 cells with an average of 3 transmitters per
cell in the BSC. The available spectrum consisted of
two blocks containing 24 and 31 frequencies,
respectively. The frequency plan produced by the
SEMA took on average several days to produce. The
frequency plan produced by the SEMA was also
implemented into the mobile telephone network. The
%DROP (percent drop) parameter represents the
percentage of abnormal disconnections (drop calls)
on the BSC in a mobile cellular network. From
figure 1 it is clear that there was a decrease in the
%DROP on the BSC after the SEMA frequency plan
was implemented. This can be seen by studying the
%DROP before and after the vertical yellow broken
line. The vertical yellow broken line depicts the
point at which the SEMA was implemented into the
BSC (see the label “Swarm AFP run in”). Swarm
AFP stands for the Swarm automatic frequency
planner that implements SEMA. The measurement
before this mark depicts the initial network
measurements while all measurements after the
mark depict the network after the SEMA frequency
plan was implemented. The decrease in the %DROP
was a substantial 0.4 on the %DROP scale. This may
not seem significant, but in terms of the %DROP on
a cellular network that prides itself on its low
%DROP, a decrease of 0.4 is amazing. An
improvement of 0.4 on the %DROP scale on a BSC
carrying a large amount of traffic can equate to a
large addition in revenue. To substantiate the actual
decrease of a 0.4% on the %DROP scale, the traffic
(erlang rate) would have to have remained constant,
since a decrease in the erlang rate would also cause a
decrease in the %DROP. However, by studying
figure 1 it can be seen that the erlang rate remained
constant (see the horizontal black broken line which
represents the erlang gradient), while there was a
distinct decrease in the %DROP after the SEMA
was implemented. Usually when a frequency plan is
implemented an increase in the %CFAIL is
experienced. The %CFAIL (percent channel failure)
parameter represents the percentage failure rate in
the ability to seize a traffic channel. The reason for
this is that most frequency plans relax the adjacent
channel rule for the traffic channels, as the major
concern is to minimize co-channel interference on
the TCHs and to ensure that there is absolutely no
co-channel or adjacent channel interference between
the BCCH and TCHs. Again, an encouraging feature
noted in figure 1 is that the BSC did not suffer from
an increase in the %CFAIL. The %CFAIL remained
fairly constant after the SEMA implementation. This
indicates that the actual frequency planning that was
taking place by the SEMA was of good quality.
Overall the SEMA frequency plan performed fairly
well by decreasing the %DROP by 0.4% on the
%DROP scale and did not cause the %CFAIL to
fluctuate in an increasing way after the frequency
plan was implemented.
ICEIS 2008 - International Conference on Enterprise Information Systems
400
%DROP and %CFAIL
0
2
4
6
8
10
12
14
1 16 31 46 61 76 91 106 121 136 151 166 181 196 211 226 241 256 271 286 301 316 331 346 361 376 391 406 421 436 451 466 481
Hours
Erlan
g
0
1
2
3
4
5
6
%DROP, %CFAIL
Erlang %DROP %CFAIL Linear (Erlang)
Swarm AFP run in
Figure 1: %DROP and %CFAIL for the operational BSC
before and after the Swarm AFP run.
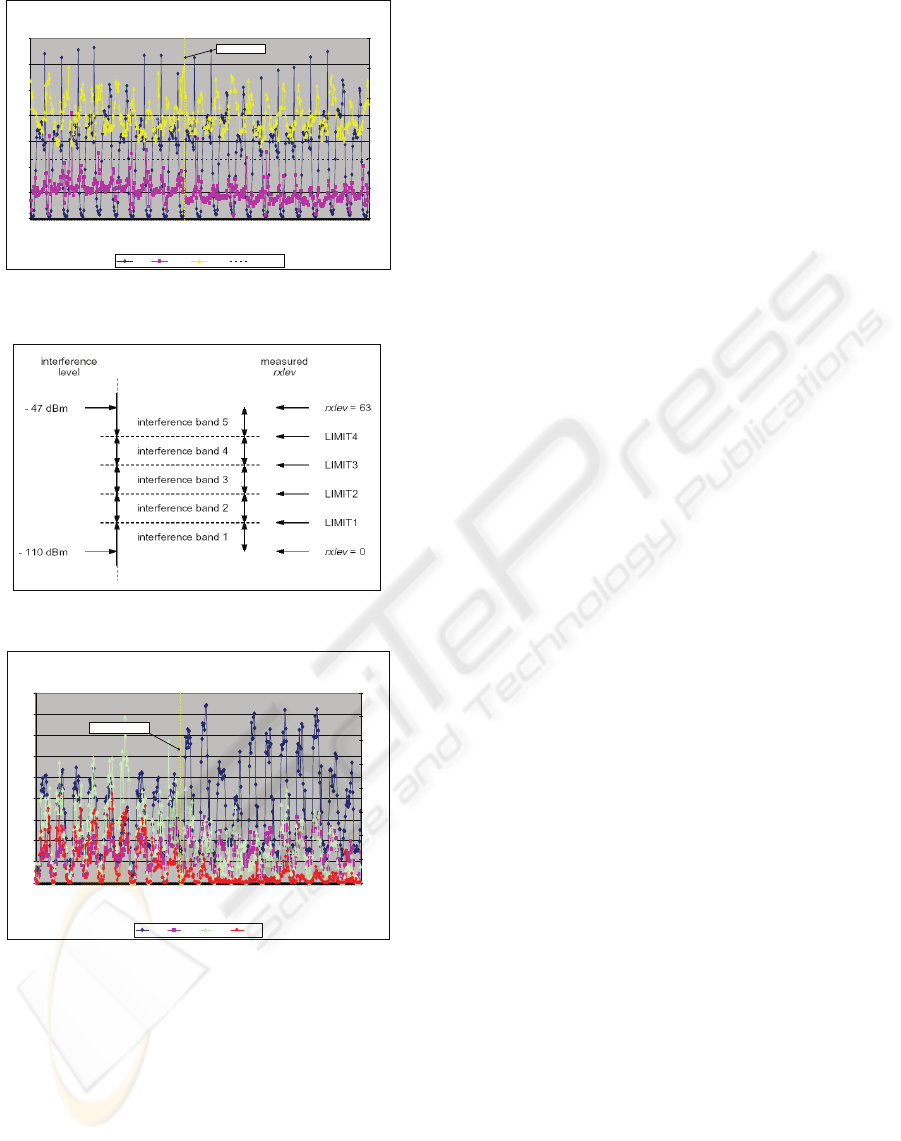
Figure 2: Interference bands 1 to 5.
ICM
0
10
20
30
40
50
60
70
80
90
1 19 37 55 73 91 109 127 145 163 181 199 217 235 253 271 289 307 325 343 361 379 397 415 433 451 469
Hours
ICM 2,ICM 3
0
2
4
6
8
10
12
14
16
ICM 4,ICM 5
ICM2 ICM3 ICM4 ICM5
Swarm AFP run in
Figure 3: ICMs for operational BSC.
The idle channel measurement (ICM) parameter is
explained with the use of figure 2. There are five
interference bands, each marked by a limit. For
example, interference band 1 ends at limit 1 and
interference band 2 ends at limit 2. This continues
up to interference band 5, which is the last
interference band. The limits 1 to 5 are represented
by the ICM parameters, namely ICM1 to ICM5,
respectively. The ICM band parameters provide an
indication of the level of interference in the cell.
A large number of points in the ICM4 and ICM5
bands indicates a large amount of interference in the
BSC and is a very unfavourable situation. From
figure 3, it can be seen that the more points in band
5, the more the interference (~-47dBm), while
interference band 1 has much less interference
(~110dBm). Thus ICM5 is worse than ICM4 and
similarly ICM4 is worse than ICM3 and so on. The
ideal situation in a mobile cellular network BSC is to
have all points located in ICM1 and ICM2, a smaller
number of points in ICM3 and virtually no points in
ICM4 and ICM5.
Figure 3 depicts the actual idle channel
measurements for the BSC before and after the
SEMA frequency plan was implemented. Remember
that the vertical yellow broken line represents the
point at which the frequency plan was implemented
into the BSC. It is apparent from the measurements
in figure 3 that there was a drastic drop in ICM5 and
ICM4 parameter values after the SEMA was
implemented into the BSC. There was also an
extensive improvement in ICM2 after the
implementation of the SEMA frequency plan. This
again proves that the SEMA frequency plan has
made considerable improvements to the BSC. The
BSC was optimized to the ideal situation with regard
to the ideal channel measurements. The number of
points has decreased in the ICM4 and ICM5 bands,
while the ICM2 band has increased considerably.
6 CONCLUSIONS
In this paper an engineering problem of high
practical relevance has been addressed, a relatively
simple optimization approached based on a
particular search scheme, namely the swarm effect
minimization algorithm (SEMA) has been designed
and implemented using a multi-agent model. The
SEMA was benchmarked against the COST 259
benchmarks, in particular the Siemens set of
problems. The SEMA was then implemented into a
commercial mobile telephone network in South
Africa, namely MTN. It was shown that the SEMA
produced encouraging results when applied to the
COST 259 Siemen’s problems. The results were
compared to the current results published on the
FAP website (Eisenblatter and Koster, 2007) and the
SEMA closely match some of the best results. One
of the most important characterizing aspects
produced in the swarm effect minimization
algorithm is the use of the stigmergetic model of
communication. This allows the cell agents to be
directed by the formation of the ever changing
assignments of frequencies in the network. The cell
THE SWARM EFFECT MINIMIZATION ALGORITHM - Utilized to Optimise the Frequency Assignment Problem
401

agents form the swarm. This novel approach of
allowing the changes in the structure of the network
frequencies (i.e. the environment) to guide the actual
selection and determination of assigned frequencies
is the main reason for the improvements displayed
by the SEMA.
ACKNOWLEDGEMENTS
The authors wish to thank the University of
Johannesburg and the Academy for Information
Technology at the University of Johannesburg and
MTN (SA).
REFERENCES
Grotschel, M., 2000. Frequency Assignment in Mobile
Phone Systems, ZIB-Report 00-58, December.
Eisenblätter, A., 2000. Frequency Assignment in GSM
Networks: Models, Heuristics and Lower Bounds, PhD
Thesis, TU Berlin.
Eberhart, R.C., Kennedy K., and Shi, Y., 2001. Swarm
Intelligence (The Morgan Kaufmann Series in
Artificial Intelligence), Academic Press.
Bonabeau, E., Dorigo, M., and Theraulaz, G., 1999.
Swarm Intelligence: From Natural to Artificial
Systems (Santa Fe Institute Studies in the Sciences of
Complexity Proceedings), Oxford University Press.
Dorigo, M., and di Caro, G., 1999. The ant colony
optimization meta-heuristic, New Ideas in
Optimization, D. Corne, M. Dorigo and F. Glover,
eds., McGraw-Hill, pp.11-32.
Eisenblatter A. And Koster A. 2007. FAP website
http://fap.zib.de
Aardal, K. I., van Hoesel, S. P. M. , Koster, A. M. C. A.,
Mannino, C. , and Sassano, A., 2001. Models and
Solution Techniques for Frequency Assignment
Problems, Berlin, Germany, ZIB-Rep. 01–40.
Montemanni, R., Moon, J.N.J., Smith, D.H., 2003. An
improved tabu search algorithm for the fixed spectrum
frequency assignment problem, IEEE Transactions on
Vehicular Technology, vol 52, no.3, pp.891–901,
May.
Maniezzo, V., and Carbonaro, A., 2000. An ANTS
heuristic for the frequency assignment problem, Future
Generation Computer Systems 16, pp. 927-935, 2000.
Kristensen, L.K. 2000. Aintz: Collective Problem Solving
by Artificial Ants,
http://www.evalife.dk/publications2.php.
Valckenaers, P., Kollingbaum, M., van Brussel, K.,
Bochmann, O., and Zamfirescu, C., 2001. The Design
of Multi-Agent Coordination and Control Systems
using Stigmergy, Proc. of the IWES'01 Conference.
Heylighen, F., 1999. Collective intelligence and its
implementation on the Web: algorithms to develop a
collective mental map, Computational and
Mathematical Organizational Theory, vol. 5, no. 3,
pp.253-280.
Kuurne A., 2001. Mobile Measurement based frequency
planning in GSM Networks, M.Sc. dissertation,
Department of Engineering Physics and Mathematics,
University of Helsinki.
Mannino, C., Oriolo G., and Ricci f., 2002. Solving
Stability Problems on a Superclass of Interval Graphs,
26-02,Universit'a di Roma La Sapienza, Dipartimento
di Informatica e Sistemistica,
Beckmann, D., and Killat U., 1999. Frequency Planning
with respect to Interference Minimization in Cellular
Radio Networks, TD(99)032, COST 259, Vienna,
Austria", January, 1999.
Hellebrandt, M., and Heller, H., 2000. A new heuristic
method for frequency assignment TD(00)003", COST
259, Valencia, Spain, January.
ICEIS 2008 - International Conference on Enterprise Information Systems
402
