
A 3D WEB BASED GEOGRAPHICAL INFORMATION SYSTEM
FOR REGIONAL PLANNING
Giuseppe Conti, Michele Andreolli, Stefano Piffer and Raffaele de Amicis
Graphitech, Center for Advanced Computer Graphics Technologies, Via Alla Cascata 56/C, Trento, Italy
Keywords: 3D geobrowser, GeoRSS, planning, INSPIRE directive.
Abstract: Managing a territory through web based Geobrowsers requires very interactive and scalable architectures,
capable to access vast scale repositories and capable to provide real-time behaviour. This paper illustrates a
web-service based infrastructure developed by Graphitech to access geographical information of
environmental interest. The paper shows that a 3D Geobrowser, deployed as a web-start application, is used
to access a variety of different remote repositories containing a wide range of geographical information at a
regional scale. Each user can interactively navigate within the 3D environment and can also interactively
send real-time information on environmental features using GeoRSS technology. The paper illustrates how
the resulting system is currently in use by an urban planning authority during their daily activities.
1 INTRODUCTION
The process of planning and managing a territory
requires a deep understanding of a very large
territory, of its problems, evolution and resources.
Traditionally this process was carried on with the
use of paper-based maps and more recently through
the use of GIS (Geographical Information Systems)
systems.
The availability of Web-based Geographical
Information Systems and more specifically 3D
Geobrowsers such as Google™ Earth (Google,
2007), Microsoft® Virtual Earth™ (Microsoft,
2007) or NASA WorldWind (NASA, 2007) has
extended the domain of GIS-based application to the
web. This has brought to a radical breakthrough in
the daily workflow of planners and administrators.
In fact the use of geobrowsers has made it possible
to use Geobrowser as a new generation of easy to
use yet powerful planning tools as they give
operators the possibility to interactively access vast
amount of territorial data in a very interactive and
effective manner.
3D Geobrowsers are today used by a number of
administrations both as a working tool (Tang, 2003)
and as a platform to make geographical data publicly
available to the entire community (PAB, 2007).
The nature of data accessed by Geobrowsers is
traditionally static as in most cases Geobrowsers
render only static information such as orthophoto,
vector data (e.g. streets and houses), as well as 3D
objects, (e.g. buildings and trees), which are
extracted from a database. However access to real-
time data can be of crucial importance in contexts
such as emergency planning and management,
traffic management etc.
The recent availability of GeoRSS has helped
filling this gap by extending the real-time nature of
standard Really Simple Syndication – RSS (RSS
Advisory Board, 2007) feeds to the geographical
context.
This paper shows how the use of GeoRSS has
been implemented within an interactive 3D web-
based Geobrowser to allow users and operators to
distribute information to the wide community of
users. The results of the system are illustrated within
a real life scenario.
2 THE IMPORTANCE OF
REAL-TIME DATA
Access, distribution and processing of real-time
Geographical Information (GI) are basic
preconditions to support the process of
environmental decision-making (De Amicis, 2007).
The heterogeneity of information on the
environment today available is driving a wide
number of initiatives, on both sides of the Atlantic,
155
Conti G., Andreolli M., Piffer S. and de Amicis R. (2008).
A 3D WEB BASED GEOGRAPHICAL INFORMATION SYSTEM FOR REGIONAL PLANNING.
In Proceedings of the Fourth International Conference on Web Information Systems and Technologies, pages 155-160
DOI: 10.5220/0001520701550160
Copyright
c
SciTePress

which advocate the strategic role of proper
management and processing of real-time or quasi
real-time environment-related data within a
harmonised web-based IT infrastructure designed to
better monitor and manage the environment.
This is proved by several regulatory actions
within the international stage, such as the recent
INSPIRE directive (INfrastructure for SPatial
InfoRmation in Europe), approved by the EU and in
force since 15-05-2007 (JRC, 2007). INSPIRE will
enforce to member states the creation of a highly
interoperable, web-service-based, Spatial Data
Infrastructure (SDI), based on ISO and OGC® -
Open Geospatial Consortium standards (OGC, 2007)
to better support environmental monitoring and
planning.
Other initiatives of relevance within the
European context have been promoted by the EEA
(European Environmental Agency) which plays a
major role promoting sustainable development at the
EU level through the Environmental Action
programs. Most notably EEA contributes to
EIONET - European Environment Information and
Observation Network (EEA, 2007) to support the
collection and organization of environmental spatial
data. Further EEA supports EEIS (European
Environmental Information System) as well as SEIS
(Shared Environmental Information System) to
produce and manage software components which
will contribute to the forthcoming creation of a web-
service based ESDI (European Spatial Data
Infrastructure). The importance of environmental
monitoring is also emphasized by the other major
initiatives such as the Global Monitoring for
Environment and Security (GMES, 2007) which
represents the EU initiative within GEOSS (Global
Earth Observation System of Systems).
3 STATE OF THE ART
Within the scientific community the importance of
interactive with 3D environments for environmental
planning applications has been stressed by different
authors (Bishop, 2005). Access of real time data is
essential to environment and risk management
(Laurini, 2005). To this extent a number of
international initiatives have tried to reach a mature
standardization level for real-time environmental
data. Most notably OGC® has proposed the first
version of the standard called SensorML
(SensorML, 2007), thought to support real-time
sensor data.
Quite recently RSS (Really Simple Syndication)
has been recently extended in an effort to use the
concept of feeds within a geographical-aware
context. GeoRSS was thought to add geographical
dimension to simple RSS XML based messages
capable to contain information related to an event
and related data such as author, title, text, abstract
etc.
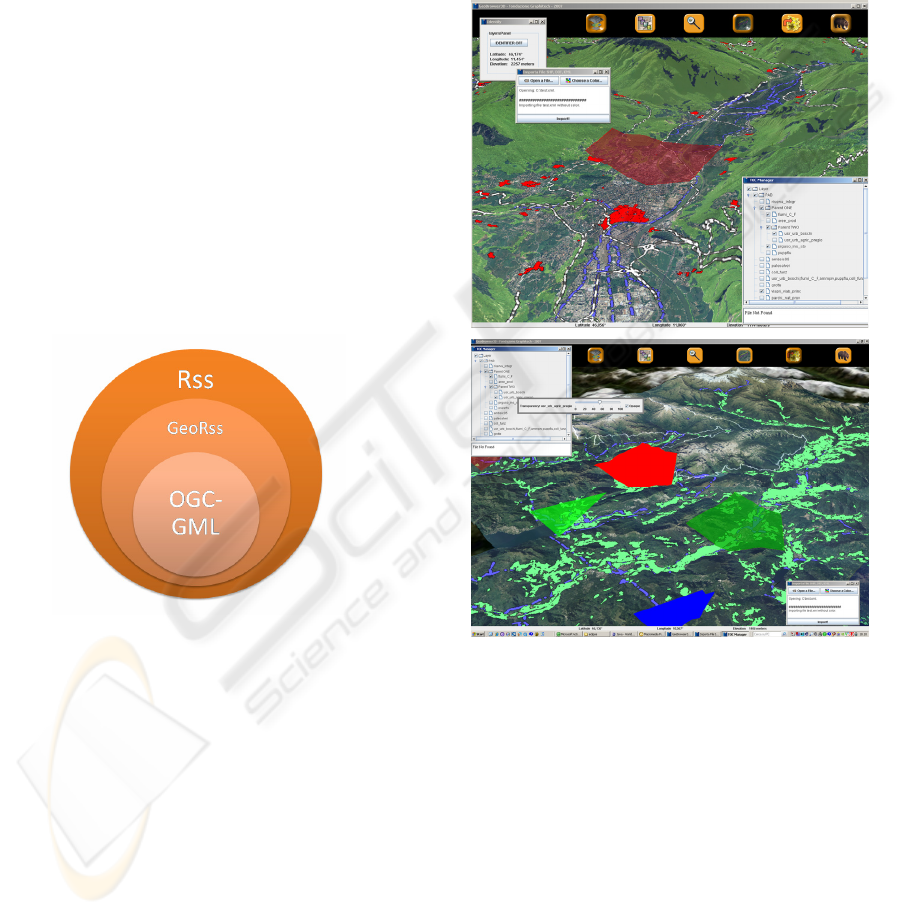
At the moment three versions of GeoRSS exists:
the W3C version, supporting geo-referenced
points
the so-called Simple GeoRSS, supporting
heights and areas
The GeoRSS GML also known as Pro GeoRSS
a further extension supporting geometrical
content through formalization in GML mark-
up language (GML, 2007).
None of them has reached the full status of a
mature standard.
4 THE APPLICATION SCENARIO
The work presented emerged from a precise
requirement emerging from the local public
administration. This required a client-server
software infrastructure to be used by technicians,
engineers, administrator to access the vast
geographical dataset which constitute the latest
Urban Plan of the provincial of Trento in Italy. The
project, which has been commissioned by
department of urban planning, has brought to the
creation of a set of web based services, available
throughout the public network of the provincial
offices, to access and interact with geographical
information.
From the technical point of view the project has
brought to the development of a client-server
architecture where several 3D Geobrowsers access
in real-time a number of repositories containing the
geographical data. The architecture of the client
application has been based on the WorldWind
libraries from NASA which have been extended to
cope with the specific requirements of the provincial
authority. The server applications have been
developed with the aim of creating a very fast
infrastructure capable of serving a large amount of
clients at very high speed.
For this the project has brought to the
development of a set of classes capable to pre-
process and compress the data available from the
provincial plan according to an optimized data
structure which is then sent via the network and then
used by the client application.
WEBIST 2008 - International Conference on Web Information Systems and Technologies
156
The main challenge of the project was set by the
sheer size of the dataset to be accessed by operators.
In fact the urban plan covers the entire province
territory, one of the widest in Italy, with a total
surface of 6.200 square kilometres at very high
resolution yielding several hundreds of Gigabytes of
data to be made accessible over the web. In fact the
base for the visualization of the territory is an
orthophoto with a resolution of 1 pixel per square
meter, covering the entire surface of provincial
territory. Further geographical information is
structured in more than 130 layers dealing with a
number of different themes such as:
Data of environmental interest, such as
protected areas, hydrograph information,
natural parks, natural reserves, lakes, skiing
areas, agricultural areas, glaciers etc.
Data related to infrastructure, such as power
lines, streets, layers, airports, sewage etc.
Data of interest for urban planning, such as
public infrastructure, administration borders,
areas to be used for dwelling, industrial areas
etc.
5 TECHNICAL DEVELOPMENT
The work presented in this paper has followed a
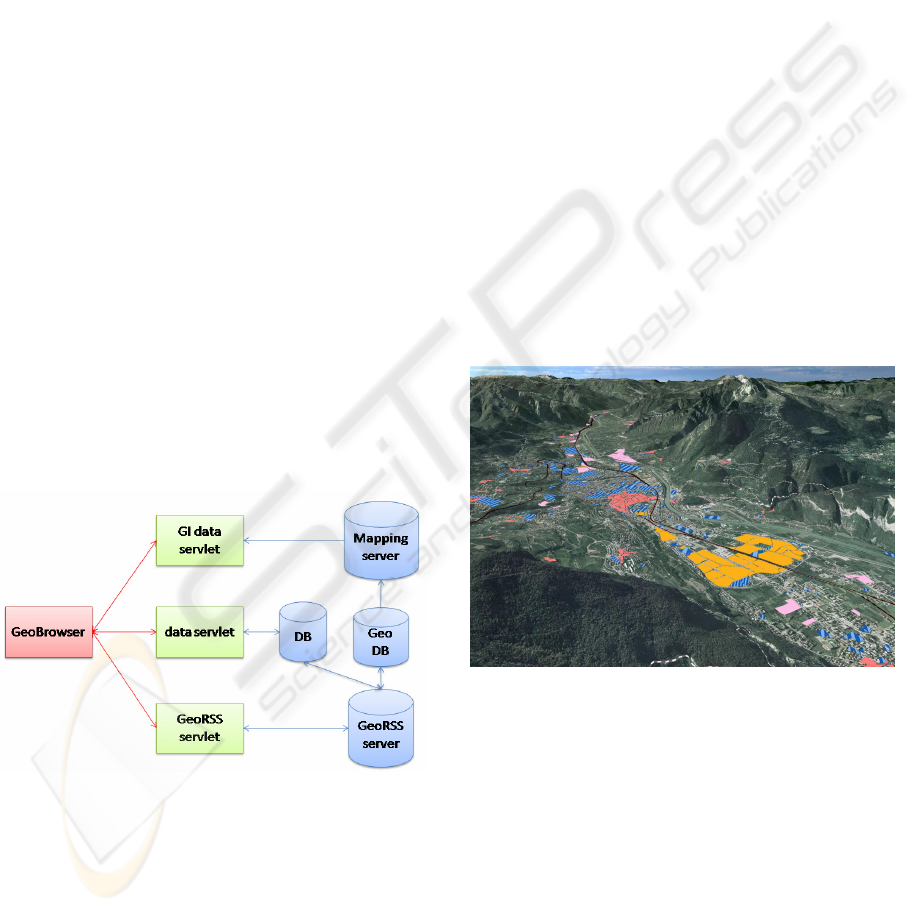
service based architecture (see Figure 1) and it has
been completely developed in Java on both client
and server side, thus ensuring maximum portability.
Figure 1: The system architecture.
The client application, which makes use of the
WorldWind libraries (NASA, 2007), has been
deployed as a Java Web Start. This way operator can
start the application with no need for installing any
specific software.
As shown in Figure 1 as soon as the application
is started this starts to make a number or requests to
a set of server-side application deployed as servlets.
These are capable to provide access to a wide range
of data necessary to administrators and planners to
operate ranging from vector data, to geo-referenced
images to GeoRSS feeds.
Specifically, requests include standard Web Map
Service (WMS, 2007), in order to access imagery of
the territory as well as rasterized geo-referenced
vector information (see Figure 2). The data is
requested to the repositories through WMS calls
which are received by a servlet which takes care of
forwarding the request to the relevant repository and
back to the client. The servlet responsible to manage
the repositories has been developed in order to pre-
process geographical data rendered by a standard
UMN map server (UMN, 2007) at multiple level of
resolutions, to compress it and to store it as binary
within an optimised data structure at the server side.
Pre-processing of static imagery provides a very
consistent increment, in terms of performance, if
compared with direct queries to a map server.
Benchmarks have shown how the developed
architecture is capable to return geo-referenced
images as result of a WMS query more than ten
times faster than relying on standard UMN map
server to resolve WMS requests.
Figure 2: A view of showing images of the territory and
rasterized vector information.
Several operators at the same time can thus use
client applications to access a number of different
repositories containing the data relative to the urban
plan of the entire Province.
Furthermore it is possible to manage the history
of the development of the territory by providing
access to previous edition of the urban plan. This
becomes an extremely useful feature as it allows
both versioning of different planning choices as well
as overlapping of different planning solutions.
This architecture, currently being used by the
planning department in their daily activities, has
A 3D WEB BASED GEOGRAPHICAL INFORMATION SYSTEM FOR REGIONAL PLANNING
157
been further extended to support access to real-time
data by using GeoRSS feeds.
Several factors have brought to the choice of
using GeoRSS. First GeoRSS feeds, for their very
nature, are an ideal technology for syndication that is
to distribute information to a wide range of users
through different means. The main advantage of
GeoRSS is therefore to facilitate re-distribution and
widespread access to data through a subscription-
based approach.
For this the client functionalities have been
extended to allow user to interactively create a new
real-time event by generating a new GeoRSS feed.
This is done by selecting the proper option on the
GUI and by clicking on the position within the 3D
scene where the event is localised. The user can then
add textual information on the nature of the event.
Further taking advantage of the GeoRSS support
for GML geometries the user can send also other
geometrically-related information. As illustrated in
figure 3 the created GeoRSS feed in fact can contain
further XML geometrical description of geo-
referenced geometrical content described as GML -
Geography Mark-up Language (GML, 2007).
Figure 3: The logical structure of the GeoRSS GML feed
generated by each user.
This allows sending geometrical geo-referenced
data to users with the textual information specified
within the RSS content tag. As a result the user can
draw geometries directly within his/her web-based
Geobrowser.
As illustrated in Figure 4, a polygon can be
drawn directly within the 3D scene thus identifying
areas characterised by a certain feature, for instance
showing the presence of pollution or road
congestion. The region of interest can be either
directly sketched within the 3D scene, retrieved
from a geo-database or simply loaded through a
shape file.
The importance of operating directly within a 3D
environment is essential as the nature of layout of
the terrain can have profound impacts on planning
activities (for instance when planning a new road).
As soon as the geometry is confirmed the user
can submit the feed with associated description and
geometry which is then sent to the central server (see
Figure 1). Here the feed is processed by a servlet
which in turn stores it within the database.
Figure 4: Two screenshots of the system. (TOP) the user
has identified an area (in light red) characterised by traffic
congestion. (BOTTOM) The client has received and
rendered several feeds which are shown as polygons
draped on the terrain.
At this stage the new feed is notified to all other
users registered with the relevant topic, graphically
represented by a further layer within the web based
Geobrowser. As a result all users will be able to see
the new geometry and by clicking on it they will be
able to read the related information.
A further advantage of this approach is that
information can be searched according to their
geographical position as well for their content. The
user in fact can, at any time, use a standard query-
WEBIST 2008 - International Conference on Web Information Systems and Technologies
158
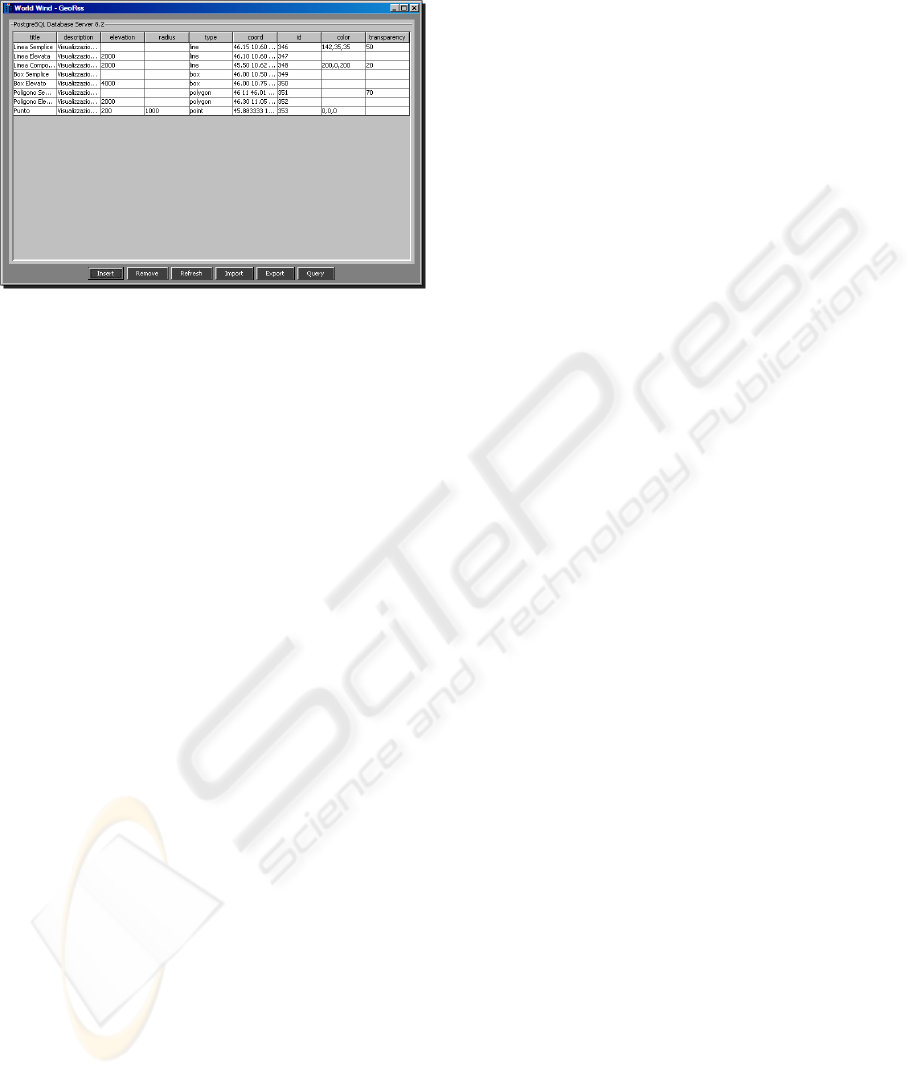
based approach to enquiry the central repository for
any specific feed.
Figure 5: A screenshot of the query interface.
6 CONCLUSIONS
The work described in this paper clearly emphasizes
the global need for suitable web-based IT tools for
geographical information capable to better support
environmental management. Access to web-based
real-time information within 3D geo-referenced
environments can potentially yield to increased
prediction of disasters, better protection of human
lives and reduced cost caused by environmental
threats.
This paper has shown the detail of a web-based
architecture used to access interactively a variety of
themes and real-time information at a regional scale.
The resulting infrastructure has been deployed in a
real life context and it is used, during the daily
activities of the planning department of a provincial
authority in Italy. This clearly shows how these web-
GIS 3D technology are paving the way for a brand
new way of managing geographical information of
public interest.
This is in line with a number of international
initiatives to provide web-service-based planning
tools capable to exploit environmental geographic
data. Most of these initiatives are being carried on
by OGC® and it represents an effort on
harmonization with a number of emerging ISO
standards. This is an emerging trend which is fuelled
by international regulations such as the European
INSPIRE directive. This trend is fostering research
and development in a number of key fields whose
results will converge into the creation of an
interactive, networked software infrastructure
capable to provide collaborative management and
decision support, in an integrated way, in the context
of environmental support at the EU level.
ACKNOWLEDGEMENTS
Part of the achievements discussed in this paper as
well as the data shown in the images is the result of
a project commissioned by the Planning Department
of the Autonomous Provincia of Trento, Italy. Part
of the work has also been carried on as result of the
Framework Program between Graphitech and the
University of Trento.
REFERENCES
Bishop I. & Lange E. (Eds.) 2005. Visualization in
Landscape and Environmental Planning. Taylor &
Francis Ltd.
De Amicis R., Witzel M. & Conti G. 2007. Interoperable
Networked Service-based infrastructure for
Interactive. In Proceedings of Proceedings of the
NATO-OTAN Workshop on Development of a
Prototype System for Sharing Information related to
Acts of Terrorism to the Environment, Agriculture and
Water systems (Ecoterrorism), Venice, Zorzi Palace –
4930 Castello, July 1 - 3, 2007 .
EEA 2007, European Environment Agency - Eionet -
European Environment Information and Observation
Network. Available at: http://www.eionet.europa.eu/
GMES 2007, Global Monitoring for Environment and
Security a joint European Commission and European
Space Agency initiative. Available at:
http://www.gmes.info/
GML 2007, Open Geospatial Consortium, Inc.®
Geography Markup Language (GML) Encoding
Standard. Available at: http://
www.opengeospatial.org/standards/gml
Google™ 2007, Google™ Earth. Available at:
http://earth.google.com/
JOGL 2007, Java bindings for OpenGL. Available at:
https://jogl.dev.java.net/
JRC 2007, Joint Reseach Center - INSPIRE INfrastructure
for SPatial InfoRmation in Europe. Available at:
http://inspire.jrc.it/
Laurini R., Servigne S. & Noel G. 2005. Soft Real-Time
GIS for Disaster Monitoring. Springer.
Microsoft® 2007, Virtual Earth™. Available at:
www.microsoft.com/virtualearth/
Nasa 2007, World Wind. Available at: http://
worldwind.arc.nasa.gov/
OGC 2007, Open Geospatial Consortium, Inc.®.
Available at: http://www.opengeospatial.org/
PAB 2007, Provincia Autonoma di Bolzano - Cartografia
Provinciale – Geobrowser. Available at:
http://www.provincia.bz.it/urbanistica/geodati/
A 3D WEB BASED GEOGRAPHICAL INFORMATION SYSTEM FOR REGIONAL PLANNING
159

RSS Advisory Board 2007, RSS 2.0 Specifications, Oct.
15, 2007. Available at: http://www.rssboard.org/rss-
specification
SensorML 2007, Sensor Model Language. Available at:
http://www.opengeospatial.org/standards/sensorml#ov
erview
Tang, W. & Selwood, J., 2003. Connecting Our World.
Esri Press.
UMN 2007, UNM Mapserver. Available at:
http://mapserver.gis.umn.edu/
WMS 2007, Open Geospatial Consortium, Inc.® – Web
Map Service. Available at: http://
www.opengeospatial.org/standards/wms
WEBIST 2008 - International Conference on Web Information Systems and Technologies
160
