
A HIGHER-ORDER STATISTICS-BASED VIRTUAL INSTRUMENT
FOR TERMITE ACTIVITY TARGETING
Juan Jos´e Gonz´alez de la Rosa, Jos´e Melgar Camarero, Stephane Bouaud, J. G. Ramiro
Univ. C´adiz, Electronics Area, Research Group PAI-TIC-168, EPSA, Av. Ram´on Puyol S/N, E-11202-Algeciras-C´adiz, Spain
Antonio Moreno Mu˜noz
Univ. C´ordoba. Electronics Area. Research Group PAI-TIC-168
Campus Rabanales, A. Einstein C-2, E-14071, C´ordoba, Spain
Keywords: Acoustic Emission, Discrete Wavelet Transform, Higher-Order Statistics, Insect detection, Spectral kurtosis,
Transient detection.
Abstract: In this paper we present the operation results of a portable computer-based measurement equipment conceived
to perform non-destructive testing of suspicious termite infestations. Its signal processing module is based
in the spectral kurtosis (SK), with the de-noising complement of the discrete wavelet transform (DWT). The
SK pattern allows the targeting of alarms and activity signals. The DWT complements the SK, by keeping
the successive approximations of the termite emissions, supposed more non-gaussian (less noisy) and with
less entropy than the detail approximations. For a given mother wavelet, the maximum acceptable level, in
the wavelet decomposition tree, which preserves the insects’ emissions features, depends on the comparative
evolution of the approximations details’ entropies, and the value of the global spectral kurtosis associated to
the approximation of the separated signals. The paper explains the detection criterion by showing different
types of real-life recordings (alarms, activity, and background).
1 INTRODUCTION
Biological transients gather all the natural complex-
ity of their associated sources, and the media through
which they propagate. As a consequence, finding the
most adequate method to get a complete characteriza-
tion of the emission, implies the selection of the ap-
propriate model, which better explains the processes
of generation, propagation and capture of the emitted
signals. This description matches the issue of mea-
surement termite activity.
This paper deals with the performance of a final-
version equipment (computer-basedsignal processing
unit), whose previous prototype’s performance, based
in the time-frequency domain analysis of the kurto-
sis, was described in (De la Rosa and Mu˜noz, 2008,
). In this final version, the measurement method is
mainly based in the interpretation of the spectral kur-
tosis graph, along with the wavelet analysis, which is
thought as an aid. At the same time, we use a simple
data acquisition unit, the sound card (maximum speed
at 44,100 Hz), which simplifies the hardware unit and
the criterion of detection.
The instruments for plague detection are thought
with the objective of decreasing subjectiveness of the
field operator. On-site monitoring implies reproduc-
ing the natural phenomenon of insect emissions with
high accuracy. As a consequence it is imperative the
use of a deep storage device, and high sensitive probes
with selective frequency characteristics. These fea-
tures make the price paid very high, and still do not
guarantee the success of the detection. Besides, the
expert’s subjectiveness plays a crucial role, because
only trained field operators can separate the signals of
interest from the non-usable background.
Regarding the procedures, the methods in which
the instruments are based are very much dependent on
the detection of excess of power in the signals; these
are the so-called second-order methods. For example,
the RMS calculation can only characterize the inten-
sity (amplitude level of the signal), and does not pro-
vide information regarding the envelope of the signal
nor the time fluctuations of the amplitude. Another
handicap of the second-order principle, e.g. the clas-
sical power spectrum, attends to the preservation of
the energy during data processing. Consequently, the
eradication of additive noise lies in filter design and
sub-band decomposition, like wavelets and wavelet
155
José González de la Rosa J., Melgar Camarero J., Bouaud S., G. Ramiro J. and Moreno Muñoz A. (2008).
A HIGHER-ORDER STATISTICS-BASED VIRTUAL INSTRUMENT FOR TERMITE ACTIVITY TARGETING.
In Proceedings of the Fifth International Conference on Informatics in Control, Automation and Robotics - SPSMC, pages 155-162
DOI: 10.5220/0001493701550162
Copyright
c
SciTePress

packets.
As an alternative to improve noise rejection and
complete characterization of the signals, in the past
ten years, a myriad of higher-order methods are being
applied in different fields of Science and Technology,
in scenarios which involve signal separation and char-
acterization of non-Gaussian signals. Concretely, the
area of diagnostics-monitoring of rotating machines
is also under our interest due to the similarities of the
signals to be monitored with the transients from ter-
mites. Many time-series of faulty rotating machines
consist of more-or-less repetitive short transients of
random amplitudes and random occurrences of the
impulses.
This paper describes a method based in the spec-
tral kurtosis (related to the fourth-order cumulant at
zero lags) to detect infestations of subterranean ter-
mites in a real-life scenario (southern Spain). Wavelet
decomposition is used as an extra tool to aid detection
from the preservation of the approximation of the sig-
nal, which is thought to be more Gaussian than the
details.
The interpretation of the results is focussed on the
classical peakedness of the statistical probability dis-
tribution associated to each frequency component of
the signal, to get a measure of the distance from the
Gaussian distribution. The spectral kurtosis serves as
a twofold tool. First, it enhances non-Gaussian sig-
nals over the background. Secondly, it offers a more
complete characterization of the transients emitted by
the insects, providing the user with the probability as-
sociated to each frequency component.
The paper is structured as follows: in Section 2 a
review on termite detection and relevant HOS expe-
riences sets the foundations. In Section 3 we make a
brief report on the definition of kurtosis; we use an
unbiased estimator of the spectral kurtosis, success-
fully used in (De la Rosa and Mu˜noz, 2008, ), using
a higher measurement bandwidth. Results are pre-
sented in Section 5. Finally, conclusions are drawn
in Section 6.
2 TERMITE DETECTION AND
HIGHER-ORDER STATISTICS
2.1 Subterranean Termites:
Fundamentals
Termites have become a threat in all the modern coun-
tries, mainly due to the advent of central heating in the
buildings. Cause more damage to homes in U.S.A.
than storms and fire combined, on the average, there
could be as many as 15 to 20 subterranean termite
colonies per hectare, which means that for example
a typical U.S.A. home may easily have three to four
colonies situated under or around it. Colonies can
contain up to 1,000,000 members (De la Rosa and
Mu˜noz, 2008, ).
Termite detection has been gaining importance
within the research community in the last two
decades, mainly due to the urgent necessity of avoid-
ing the use of harming termiticides, and to the joint
use of new emerging techniques of detection and hor-
monal treatments (IGR
1
products), with the aim of
performing an early treatment of the infestation. A
localized partial infestation can be exterminated af-
ter two or three generations of the colony’s members
with the aid of these hormones, which stop chitin syn-
thesis. A chitin synthesis inhibitor kills termites by
inhibiting formation of a new exoskeleton when they
shed their existing exoskeleton. As a direct conse-
quence, the weakened unprotected workers stop feed-
ing the queen termite of the colony, which dies of star-
vation, finishing the reproduction process, and conse-
quently cutting any possible replacement of the mem-
bers of the colony with a new generation. In this paper
the specie reticulitermes lucifugus is under study.
2.2 Subterranean Termites: Detection
Project towards HOS
The primary method of termite detection consists of
looking for evidence of activity. But only about 25
percent of the building structure is accessible, and the
conclusions depend very much on the level of exper-
tise and the criteria of the inspector (De la Rosa and
Mu˜noz, 2008, ),(Robbins et al., 1991). As a conse-
quence, new techniques have been developed to re-
move subjectiveness and gain accessibility.
User-friendly equipment is being currently used in
targeting subterranean insect infestations by means of
temporal analysis of the vibratory data sequences
2
.
An acoustic-emission (AE) sensor or an accelerome-
ter is fixed to the suspicious structure. This class of in-
struments is based on the calculation of the root mean
square (RMS) value of the vibratory waveform. The
RMS value comprises information of the AE raw sig-
nal power during each time-interval of measurement
(averaging time). This measurement strategy conveys
a loss of potentially valuable information both in the
time and in the frequency domain (De la Rosa and
Mu˜noz, 2008, ).
1
Inhibitor Growth Regulators
2
The system AED2000 (Acoustic Emission Consulting)
has proven to be an advance in the detection of several insect
species.
ICINCO 2008 - International Conference on Informatics in Control, Automation and Robotics
156
On the other hand, the use of the RMS value
can be justified both by the difficulty of working
with raw AE signals in the high-frequency range, and
the scarce information about sources and propagation
properties of the AE waves through the substratum.
Noisy media and anisotropy makes even harder the
implementation of new methods of calculation and
measurement procedures. A more sophisticated fam-
ily of instruments makes use of spectral analysis and
digital filtering to detect and characterize vibratory
signals (Mankin and Fisher, 2002).
Other complementary second-order tools, like
wavelets and wavelet packets (time-dependent tech-
nique) concentrate on transients and non-stationary
movements, making possible the detection of singu-
larities and sharp transitions, by means of sub-band
decomposition. The method has been proved under
controlled laboratory conditions, up to a SNR=-30 dB
(De la Rosa et al., 2006, ).
Higher-order statistics, are being widely used in
several fields. The following are relevant due to the
similarities of the problems they study. The spectral
kurtosis has been successfully described and applied
to the vibratory surveillance and diagnostics of rotat-
ing machines (Antoni, 2006a),(Antoni, 2006b), show-
ing an inedit set of results that include kurtogram-
based calculations of optimal band-pass filters and
their performance in detecting two types of machin-
ery faults (ball faults and outer race fault in rolling
elements bearings); the kurtosis of the filtered signals
is enhanced, which improves the detection of the fault
type under study.
In the field of insect detection, the work presented
in (De la Rosa and Mu˜noz, 2008, ) set the founda-
tions of the present paper. The combined used of the
spectral kurtosis and the time-domain sliding kurtosis
showed marked features associated to termite emis-
sions. In the frequency domain (sample frequency
64,000 Hz) three frequency zones were identified in
the spectral kurtosis graph as evidence of infestation;
two in the audio band (which will be also checked in
the present paper) and one in the near ultrasound (≈
22 kHz). In the present paper the sample frequency
was fixed to 44,100 Hz and the sound card was di-
rectly driven by MATLAB, which presents the results
in an user-oriented interface, which is forwarded in
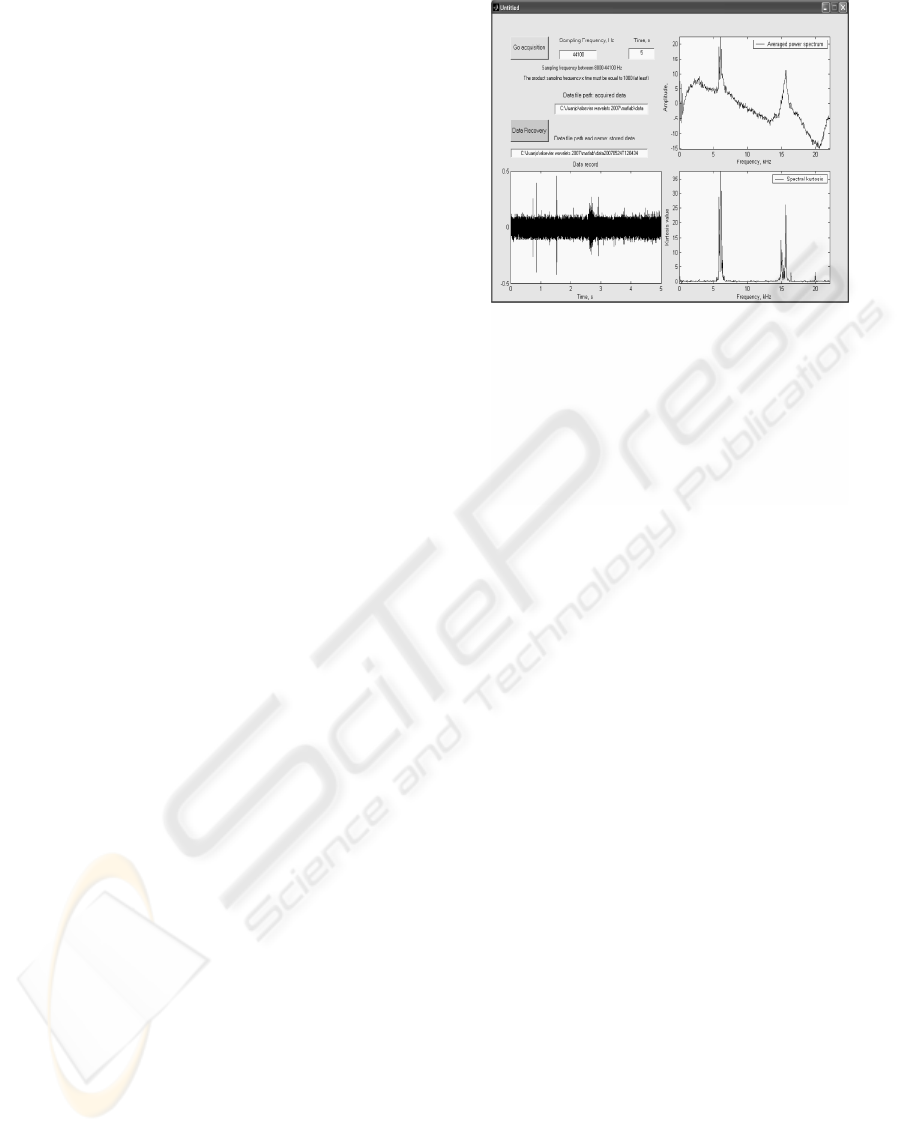
Fig. 1. In the measurement situation shown in Fig.
1, the time-raw data contains alarms an activity sig-
nals from termites. This is a clear example of positive
detection.
The developed virtual instrument also calculates
and presents the spectrum (up-right graph) and the
raw data (bottom-left). The field operator adds there-
fore visual information to the classical audio-based
Figure 1: The graphical user interface which presents the
results to the field operator. The spectral kurtosis is in the
bottom-right corner.
criterion, which was by the way very subjective and
very expertise-depend.
Other relevant achievements related to HOS are
the following. Cumulants have been modeled in order
to characterize the ultrasound waves in materials (Mi-
ralles et al., 2004). Bi-cepstrum, have been success-
fully used in blind identification of acoustic emissions
(Iturrospe et al., 2005). Bi-spectrum has been applied
to enhance reflections in ring-type samples of steel
pipes, in a non-destructive testing frame (De la Rosa
et al., 2007b, ).
In the field of termite detection, a cumulant-based
independent component analysis algorithm has
proven to separate termites’ alarm signals from
synthetics noise backgrounds (De la Rosa et al., 2005,
) in a blind source separation scenario. The informa-
tion contained in the diagonal of the bi-spectrum data
structure has proven to enhance the frequency pattern
of the termites’ emissions (De la Rosa et al., 2007a,
). The conclusions of these works were funded in
the advantages of cumulants; in particular, in the
capability of enhancing the SNR of a signal buried
in noise processes, whose probability dnsity function
is symmetrically distributed. The computational
cost (memory consuming) could be pointed as the
main drawback of the technique. Calculation of
the cumulants’ is made for all the combinations of
time lags, giving rise to complex multidimensional
data structures. The exam of this data sets leads to
the selection of a privileged direction, whose which
data are analyzed. In this paper, time-lags are set
to zero in order to reduce the cost of computation.
Statistically speaking, zero time lags lead to kurtosis,
in a fourth-order cumulant.
A HIGHER-ORDER STATISTICS-BASED VIRTUAL INSTRUMENT FOR TERMITE ACTIVITY TARGETING
157

3 KURTOSIS AND SPECTRAL
KURTOSIS
3.1 Kurtosis, 4th-order Cumulants and
its Interpretation
Kurtosis is a measure of the ”peakedness” of the prob-
ability distribution of a real-valued random variable.
Higher kurtosis means more of the variance is due to
infrequent extreme deviations, as opposed to frequent
modestly-sized deviations. This fact is by the way
used in this paper to detect termite emissions in an ur-
ban background. Kurtosis is more commonly defined
as the fourth central cumulant divided by the square
of the variance of the probability distribution, which
is the so-called excess kurtosis:
γ
2
=
κ
4
κ
2
2
=
µ
4
σ
4
− 3, (1)
where µ
4
= κ
4
+ 3κ
2
2
is the 4th-order central mo-
ment; and κ
4
is the 4th-order central cumulant, i.d.
the ideal value of Cum
4,x
(0, 0, 0). This definition of
the 4th-order cumulant for zero time-lags comes from
a combinational relationship among the cumulants of
stochastic signals and their moments, and is given by
the Leonov-Shiryaevformula. A complete description
for these statistics are found for example in (Nikias
and Mendel, 1993; Mendel, 1991; Chonavel, 2003).
The ”minus 3” at the end of this formula is a cor-
rection to make the kurtosis of the normal distribution
equal to zero. Excess kurtosis can range from -2 to
+∞.
The sample kurtosis is calculated over a sample-
register (an N-point data record), and noted by:
g
2
=
m
4
s
4
− 3 =
m
4
m
2
2
− 3 =
1
N
P
N
i=1
(x
i
− ¯x)
4
1
N
2
h
P
N
i=1
(x
i
− ¯x)
2
i
2
− 3,
(2)
where m
4
is the fourth sample moment about the
mean, m
2
is the second sample moment about the
mean (that is, the sample variance), and ¯x is the sam-
ple mean. The sample kurtosis defined in Eq. (2)
is a biased estimator of the population kurtosis, if we
consider a sub-set of samples from the population (the
observed data).
3.2 Spectral Kurtosis Estimation and
Interpretation
Ideally, the spectral kurtosis is a representation of the
kurtosis of each frequencycomponent of a process (or
data from a measurement instrument x
i
). For esti-
mation issues we will consider M realizations of the
process; each realization containing N points; i.d. we
consider M measurement sweeps, each sweep with N
points. The time spacing between points is the sam-
pling period, T
s
, of the data acquisition unit.
A biased estimator for the spectral kurtosis for a
number M of N-point realizations at the frequency
index m, is given by:
ˆ
G
N,M
2,X
(m) =
=
M
M − 1
(M + 1 )
P
M
i=1
|X
i
N
(m)|
4
P
M
i=1
|X
i
N
(m)|
2
2
− 2
.
(3)
This estimator is the one we have implemented in
the program code in order to perform the data com-
putation and it was also used successfully in (Vrabie
et al., 2003; De la Rosa and Mu˜noz, 2008, ).
Regarding the experimental signals, we expect to
detect positivepeaks in the kurtosis’s spectrum, which
may be associated to termite emissions, character-
ized by random-amplitude impulse-like events. This
non-Gaussian behavior should be enhanced over the
symmetrically distributed electronic noise, introduced
in the measurement system. Speech is perhaps also
reflected in the spectral kurtosis but not in the fre-
quencies were termite emissions manifest. Besides,
we assume, as a starting point, that non-Gaussian
behavior of termite emissions is more acute than in
speech. As a consequence, these emissions would be
clearly outlined in the kurtosis spectrum. As a final
remark, we expect that constant amplitude interfer-
ences are clearly differentiate due to their negative
peaks in the spectral kurtosis. To show the ideal per-
formance of the estimator, which has been described
in these lines, and also described in (De la Rosa and
Mu˜noz, 2008, ), we show an example based in syn-
thetics. A mix of six different signals have been
designed. Each mixture is the sum of a constant-
amplitude sine of 2 kHz, a constant-amplitude sine
at 9 kHz, a Gaussian-distributed-amplitude sine al
5 kHz, a Gaussian-distributed-amplitude sine at 18
kHz, a Gaussian white noise, and a colored Gaussian
noise between 12 and 13 kHz. Each mixture (realiza-
tion or sample register) contains 1324 points.
Negative kurtosis is expected for constant-
amplitude processes, positive kurtosis should be as-
sociated to random-amplitudes and zero kurtosis will
characterize both Gaussian-noise processes.
A simulation has been made in order to show the
influence of the number of sample registers (M) in
the averaged results for the SK graph. Fig. 2 shows
a good performance because enough registers have
ICINCO 2008 - International Conference on Informatics in Control, Automation and Robotics
158
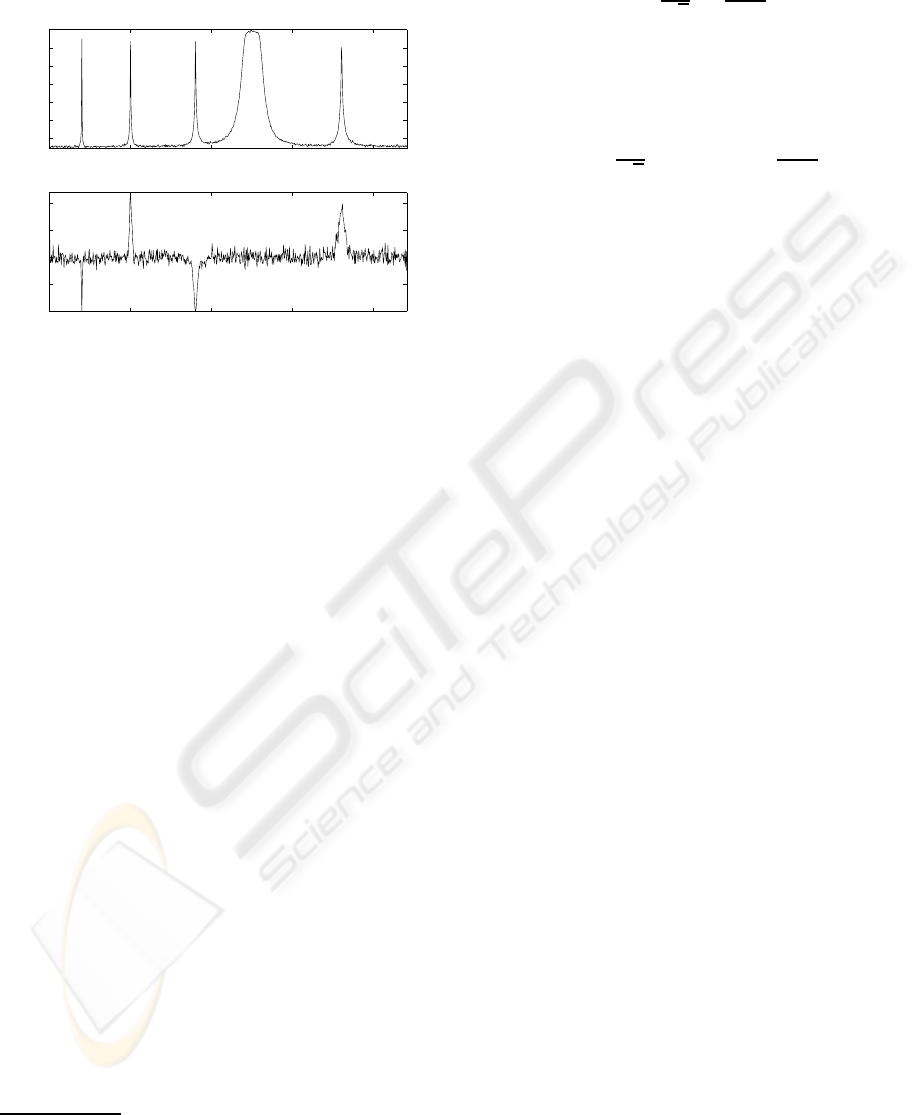
been averaged (M=500). For M ¡ 100, roughly, per-
formance degenerates.
0 5 10 15 20
−60
−50
−40
−30
−20
−10
0
Frequency, kHz
Normalised amplitude, dB
Averaged−normalised power spectrum
2 kHz
fixed ampl.
9 kHz
fixed ampl.
5 kHz
random ampl.
18 kHz
random ampl.
Colored
Gaussian
noise:
12−13 kHz
0 5 10 15 20
−0.5
0
0.5
1
Frequency, kHz
Kurtosis value
Averaged spectral kurtosis
2 kHz, kurtosis≈−1 9 kHz, kurtosis≈−1
5 kHz, kurtosis>0 18 kHz
kurtosis>0
Colored
Gaussian
noise: 12−13 kHz
kurtosis≈0
Figure 2: Performance over a set of synthetics, for M=500
realizations.
Once we have expose the main criterion used by
the instrument, we make a brief recall of wavelets
transforms, which are used as a complement in the
following way. First of all, they manage to extract
the impulses buried in noise and other parasitic sig-
nals. Secondly, the successive approximations of the
signals, in the wavelet decomposition tree are sup-
posed to gather all the non-Gaussian features or com-
ponents, while the details are mainly composed by
random signals, with a high entropy. So, the global
SK (averaged SK, over all the frequency components)
will be higher as the decomposition level increases.
4 THE WAVELET TRANSFORM
DECOMPOSITION:
FUNDAMENTALS AND
DECISION CRITERIA
A mother wavelet is a function ψ with finite energy
3
,
and zero average:
Z
+∞
−∞
ψ(t)dt = 0, (4)
This function is normalized
4
, kψk = 1, and is cen-
tered in the neighborhood of t=0.
ψ(t) can be expanded with a scale parameter a,
and translated by b, resulting the daughter functions
3
f ∈ L
2
(ℜ), the space of the finite energy functions,
verifying
R
+∞
−∞
|f(t)|
2
dt < +∞.
4
kfk =
R
+∞
−∞
|f(t)|
2
dt
1/2
= 1.
or wavelet atoms, which remain normalized:
ψ
a,b
(t) =
1
√
a
ψ
t − b
a
; (5)
The CWT can be considered as a correlation between
the signal under study s(t) and the wavelets (daugh-
ters). For a real signal s(t), the definition of CWT
is:
CW T s(a, b) =
1
√
a
Z
+∞
−∞
s(t)ψ
∗
t − b
a
dt; (6)
where ψ
∗
(t) is the complex conjugate of the mother
wavelet ψ(t), s(t) is the signal under study, and a
and b are the scale and the position respectively (a ∈
ℜ
+
− 0, b ∈ ℜ). The scale parameter is proportional
to the reciprocal of the frequency. Eq. (6) establishes
that each coefficient provide numerical information
about the similarity between the signal under study
and the time-shifted frequency-scaled wavelet daugh-
ter.
The Discrete Time Wavelet Transform (DTWT)
is introduced in order to to reduce the computational
cost of calculating all these coefficients. Only a sub-
set of scale and time shifts are chosen in the DTWT.
A tree-structure arrangement of filters allows the sub-
band decomposition of the signal. The original signal
passes through two complementary filters (quadra-
ture mirror filters), and two signals are obtained as
a result of a down-sampling process, corresponding
to the approximation and detail coefficients.
The lengths of the detail and approximation coef-
ficient vectors are slightly more than half the length of
the original signal, s(t). This is the result of the dig-
ital filtering process (convolution) (Angrisani et al.,
1999). The approximations are the high-scale, low-
frequency components of the signal. The details are
the low-scale, high-frequency components.
Daubechies 5 has been selected as most similar
wavelet mother, because of the highest coefficients in
the decomposition tree. Given the wavelet mother, to
show the process of selecting the maximum decom-
position level in the wavelet tree, we have adopted
a criterion based on the calculation of Shannon’s en-
tropy (information entropy), which is a measure of the
uncertainty associated with a random variable X; this
entropy denoted by H(X), and defined by:
H(X) := −
N
X
i=1
p(x
i
) log
10
p(x
i
), (7)
where X is an N-outcome measurement process
{x
i
, i = 1, ··· , N }, and p(x
i
) is the probability den-
sity function of the outcome x
i
.
We show this strategy via the following example,
based on real-life data, presented in Fig. 6 and in Fig.
A HIGHER-ORDER STATISTICS-BASED VIRTUAL INSTRUMENT FOR TERMITE ACTIVITY TARGETING
159
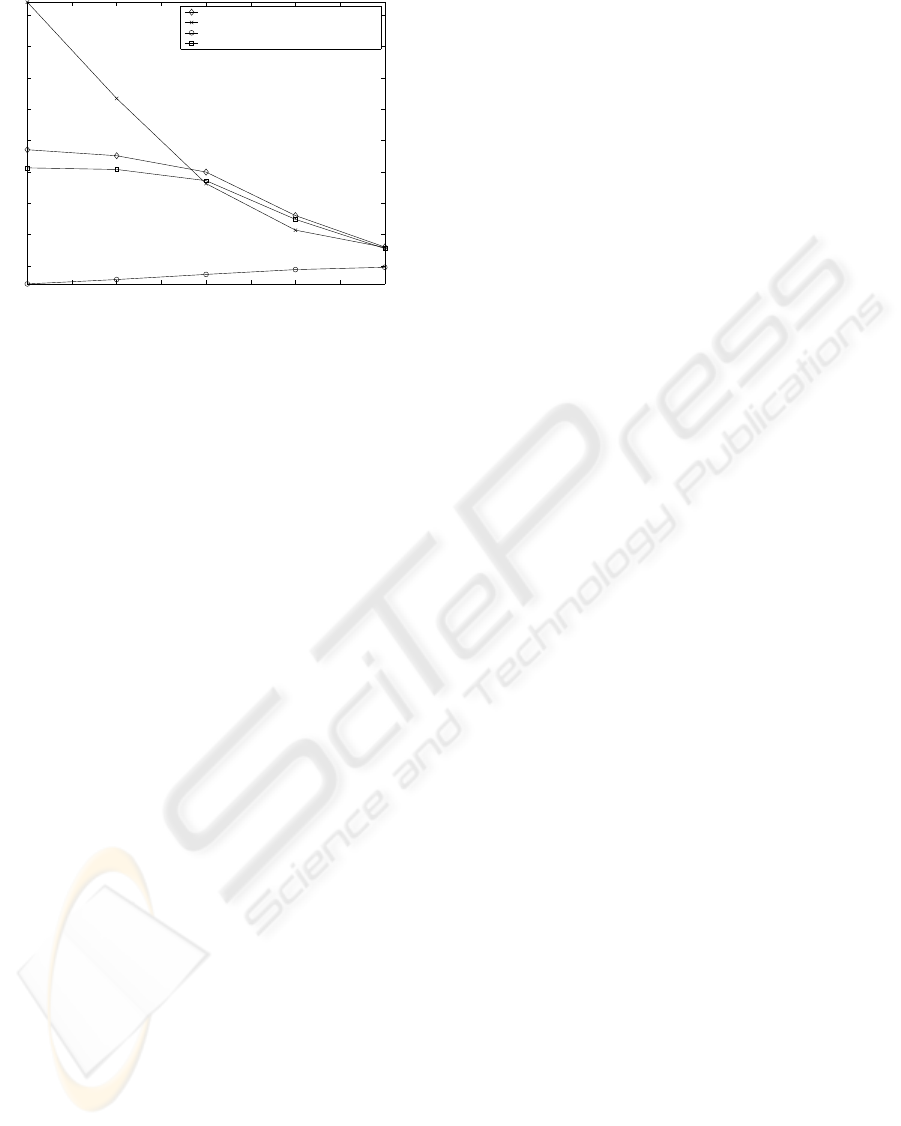
1 2 3 4 5
0
1
2
3
4
5
6
7
8
Entropy evolution (Shannon)
Wavelet decomposition level
Entropy
Details
Approximations
Global difference: eA
i
−(eA
i+1
+eD
i+1
)
Successive approximations differences eA
i
−eA
i+1
Figure 3: Evolution of the entropy.
7, in the results section. The entropy of the approxi-
mations and the details are compared for each level of
comparison and shown in Fig. 3.
By looking at the graph of Fig. 3, at level 4, the
entropy of the approximations is less than the entropy
of the details. So level 4 is in a sense, a point of inver-
sion. No improvement is obtained for level 5, where
the entropies are very similar.
We can also see that the global difference of en-
tropies increases towards zero, at level 5, as a com-
plementary indication that further decomposition will
not suppose progress in de-noising.
5 EXPERIMENTS AND RESULTS
5.1 The Instrument and the
Measurement Procedure
A piezoelectric probe-sensor (model SP-1L from
Acoustic Emission Consulting) is used in the final ver-
sion of the instrument, and was described in detail in
(De la Rosa and Mu˜noz, 2008, ). The sensor is con-
nected to the sound card of a lap-top computer and the
acquisition is driven by MATLAB, via the Graphical
User Interface (GUI).
The user interface was presented in Fig. 1. The
operator can select the acquisition time and the sam-
ple frequency (maximum 44,100 Hz if the sound card
is driven). In the bottom-right corner of Fig. 1, the
spectral kurtosis graph is presented. The user can also
examine the raw data and the spectrum. Automati-
cally, the instrument save the acquired data (labeling
the file with the date). Additionally, the operator can
recall the stored files.
The transducer SP-1L was used to record the data
registers in the field experience, and the ICP unit
(Integrated Circuit Piezoelectric; ICP interface) was
connected to the sound card of a lap-top computer,
configuring an autonomous measurement unit. The
sampling frequency was F
s
=44,100 Hz for all the
registers analyzed in this paper, both in the sliding-
cumulant results as in the spectral kurtosis subsection.
The recording stage took place in a garden with ev-
idence of infestation and the bare waveguide of the
sensor was introduced in the lawn, over the suspicious
zone. Termite sounds from feeding are like sharp pops
and crackles in the audio output.
The key of the spectral kurtosis detection strategy
used in this work lies in the potential enhancement
of the non-Gaussian behavior of the emissions. If
this happens, i.e. if an increase of the non-Gaussian
activity (increase in the kurtosis, peakedness of the
probability distribution) is observed-measured in the
spectral kurtosis graph, there may be infestation in the
surrounding subterranean perimeter, where the trans-
ducer is attached.
Termite emissions are non-stationary, so the in-
strument treats data by ensemble averaging of the
sample registers, following the indications in (Ben-
dat and Piersol, 2000) (pp. 463-465). Each spec-
trum and spectral kurtosis graph presented in this
section is the result of averaging the spectra of the
sample registers, or realizations. As a final remark,
acquired data is normalized according to the norm:
ksk =
P
N
i=1
|s
i
|
2
1/2
.
5.2 Operating Cases
In this subsection we present the possible situations
associated to the measurement cases. We present the
signals out of the instrument display in order to be
analyzed more precisely. A data acquisition time of
5 seconds and a sample frequency of 44,100 Hz have
been selected. So every time the user performs an ac-
quisition (pressing the button ”Go”) 220,500 points
are stored. The software-engine is adjusted to cal-
culate the averaged spectral kurtosis (SK) over a set
of 220 realizations, each of them containing 1,000
points.
Two couples of data registers have been selected
as significant examples, corresponding to typical
measurements situations. For a given couple, first we
present the results without applying wavelets. Then
we explain the information wavelets add.
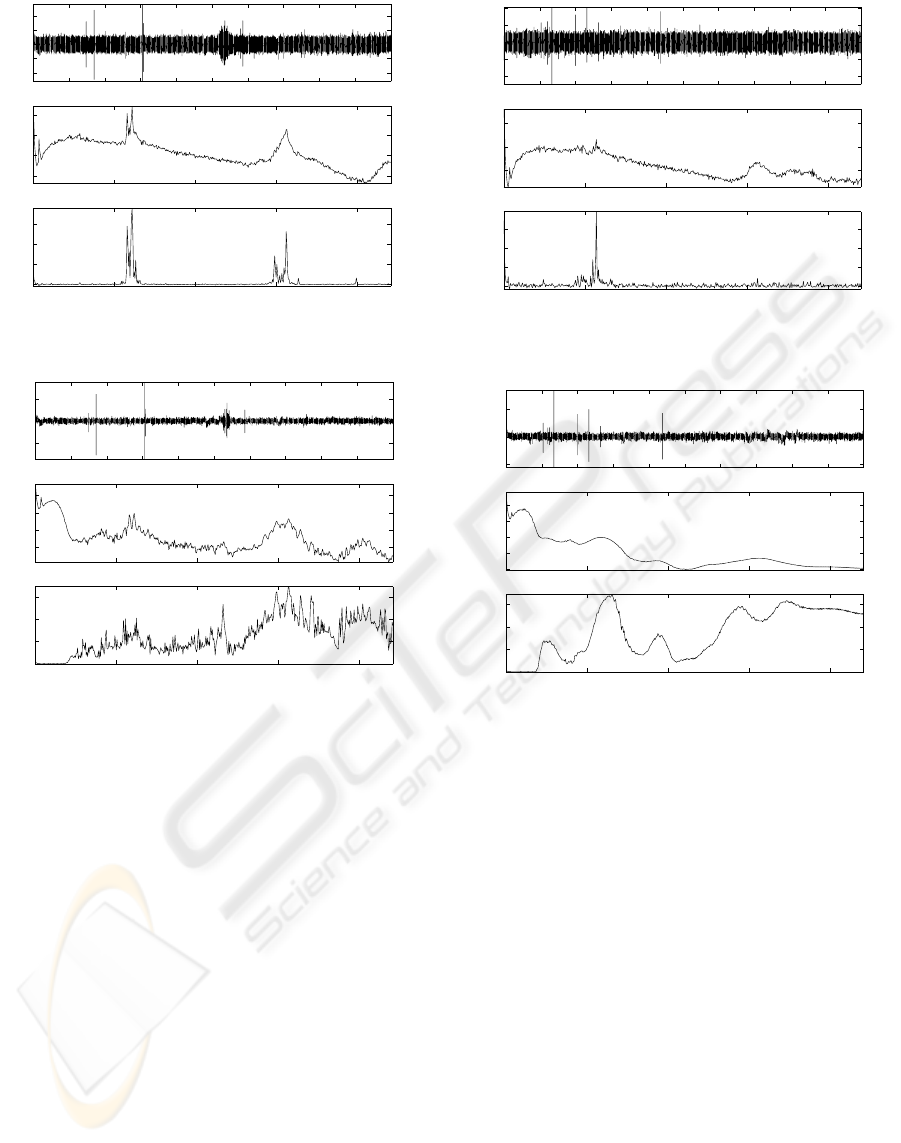
Fig. 4 presents a clear detection case, character-
ized by termite activity signals without alarms. Two
peaks are clearly enhanced in the SK graph (near 5
kHz, and near 15 kHz).
The de-noised data in the time main are shown
in the upper grpah of Fig. 5. Applying the spec-
ICINCO 2008 - International Conference on Informatics in Control, Automation and Robotics
160
0 0.5 1 1.5 2 2.5 3 3.5 4 4.5 5
−0.02
−0.01
0
0.01
0.02
Time, s
0 0.5 1 1.5 2
x 10
4
−60
−50
−40
−30
Frequency, Hz
Amplitude, dB
0 0.5 1 1.5 2
x 10
4
0
10
20
30
Frequency, Hz
Kurtosis value
Figure 4: A clear measurement of activity detection.
0 0.5 1 1.5 2 2.5 3 3.5 4 4.5 5
−0.01
0
0.01
Time, s
0 0.5 1 1.5 2
x 10
4
−100
−80
−60
−40
Frequency, Hz
Amplitude, dB
0 0.5 1 1.5 2
x 10
4
0
50
100
150
Frequency, Hz
Kurtosis value
Figure 5: De-noising results for data in Fig. 4. A general
enhancement of the spectral kurtosis occurs.
tral kurtosis to the de-noised version it is seen that
all the frequency components are enhanced, specially
those ones in the detection band. This fact confirms
the presence of insects, and it is of special value in
doubtful situations, when they are really needed.
In Fig. 6 a doubtful measurement case is pre-
sented. Activity evidence is outlined only near 5 kHz.
Once, the wavelets have been applied (shown in Fig.
7), the enhancement near 5 kHz and 15 kHz confirm
the detection.
Hereinafter, we present the conclusions.
6 CONCLUSIONS AND
ACCOMPLISHMENTS
Assuming the starting hypothesis that the insect emis-
sions may have a more peaked probability distribution
than any other simultaneous source of emission in the
measurement perimeter, we have design a termite de-
0 0.5 1 1.5 2 2.5 3 3.5 4 4.5 5
−0.02
−0.01
0
0.01
0.02
Time, s
0 0.5 1 1.5 2
x 10
4
−50
−40
−30
Frequency, Hz
Amplitude, dB
0 0.5 1 1.5 2
x 10
4
0
2
4
6
Frequency, Hz
Kurtosis value
Figure 6: A doubtful measurement situation.
0 0.5 1 1.5 2 2.5 3 3.5 4 4.5 5
−0.01
0
0.01
Time, s
0 0.5 1 1.5 2
x 10
4
−120
−100
−80
−60
−40
Frequency, Hz
Amplitude, dB
0 0.5 1 1.5 2
x 10
4
0
50
100
150
Frequency, Hz
Kurtosis value
Figure 7: De-noising results of data in Fig. 6.
tection strategy and a virtual instrument based in the
calculation of the 4th-order cumulants for zero time
lags, which are indicativeof the signals’ kurtosis. The
instrument is actually in use by an Spanish company.
An estimator of the spectral kurtosis has been used
to perform a selective analysis of the peakedness of
the signal. It has been shown that new frequency
components gain in relevance in the spectral kurtosis
graphs.
The main goal of this signal-processing method
is to reduce subjectiveness due to visual or listening
inspection of the registers. This means that in a noisy
environment, it may be possible to ignore termite
feeding activity even with an ad hoc sensor because,
despite the fact that the sensor is capable of register
these low-level emissions, the human ear can easily
ignore them (De la Rosa and Mu˜noz, 2008, ).
A HIGHER-ORDER STATISTICS-BASED VIRTUAL INSTRUMENT FOR TERMITE ACTIVITY TARGETING
161

ACKNOWLEDGEMENTS
The authors would like to thank the Spanish Min-
istry of Science and Education for funding the project
DPI2003-00878, where the different noise processes
have been modeled and contrasted; and also for sup-
porting the PETRI project PTR95-0824-OP dealing
with plague detection using higher-order statistics.
Our unforgettable thanks to the trust we have from
the Andalusian Government for funding the excel-
lency project PAI2005-TIC00155,where higher-order
statistics are modeled and applied to plague detection
and power quality analysis.
REFERENCES
Angrisani, L., Daponte, P., and D’Apuzzo, M. (1999). A
method for the automatic detection and measurement
of transients. part I: the measurement method. Mea-
surement, 25(1):19–30.
Antoni, J. (2006a). The spectral kurtosis: a useful tool
for characterising non-stationary signals. Mechan-
ical Systems and Signal Processing (Ed. Elsevier),
20(2):282–307.
Antoni, J. (2006b). The spectral kurtosis: application to
the vibratory surveillance and diagnostics of rotating
machines. Mechanical Systems and Signal Processing
(Ed. Elsevier), 20(2):308–331.
Bendat, J. and Piersol, A. (2000). Random Data Analysis
and Measurement Procedures, volume 1 of Wiley Se-
ries in Probability and Statistics. Wiley Interscience,
3 edition.
Chonavel, T. (2003). Statistical Signal Processing. Mod-
elling and Estimation, volume 1 of Advanced Text-
books in Control and Signal Processing. Springer,
London, 1 edition.
Iturrospe, A., Dornfeld, D., Atxa, V., and Abete, J. M.
(2005). Bicepstrum based blind identification of the
acoustic emission (AE) signal in precision turning.
Mechanical Systems and Signal Processing (Ed. El-
sevier), 19(1):447–466.
Mankin, R. W. and Fisher, J. R. (2002). Current and po-
tential uses of acoustic systems for detection of soil
insects infestations. In Proceedings of the Fourth Sym-
posium on Agroacoustic, pages 152–158.
Mendel, J. M. (1991). Tutorial on higher-order statistics
(spectra) in signal processing and system theory: The-
oretical results and some applications. Proceedings of
the IEEE, 79(3):278–305.
Miralles, R., Vergara, L., and Gosalbez, J. (2004). Material
grain noise analysis by using higher-order statistics.
Signal Processing (Ed. Elsevier), 84(1):197–205.
Nikias, C. L. and Mendel, J. M. (1993). Signal process-
ing with higher-order spectra. IEEE Signal Processing
Magazine, pages 10–37.
Robbins, W. P., Mueller, R. K., Schaal, T., and Ebeling, T.
(1991). Characteristics of acoustic emission signals
generated by termite activity in wood. In Proceedings
of the IEEE Ultrasonic Symposium, pages 1047–1051.
De la Rosa, J. J. G., Lloret, I., Moreno, A., Puntonet, C. G.,
and G´orriz, J. M. (2006). Wavelets and wavelet pack-
ets applied to detect and characterize transient alarm
signals from termites. Measurement (Ed. Elsevier),
39(6):553–564. Available online 10 January 2006.
De la Rosa, J. J. G., Lloret, I., Puntonet, C. G., Piotrkowski,
R., and Moreno, A. (2007a). Higher-order spectra
measurement techniques of termite emissions. a char-
acterization framework. Measurement (Ed. Elsevier),
In Press:–. Available online 13 October 2006.
De la Rosa, J. J. G. and Mu˜noz, A. M. (2008). Higher-order
cumulants and spectral kurtosis for early detection of
subterranean termites. Mechanical Systems and Sig-
nal Processing (Ed. Elsevier), 22(Issue 1):279–294.
Available online 1 September 2007.
De la Rosa, J. J. G., Piotrkowski, R., and Ruzzante, J.
(2007b). Third-order spectral characterization of
acoustic emission signals in ring-type samples from
steel pipes for the oil industry. Mechanical Sys-
tems and Signal Processing (Ed. Elsevier), 21(Issue
4):1917–1926. Available online 10 October 2006.
De la Rosa, J. J. G., Puntonet, C. G., and Lloret, I. (2005).
An application of the independent component analy-
sis to monitor acoustic emission signals generated by
termite activity in wood. Measurement (Ed. Elsevier),
37(1):63–76. Available online 12 October 2004.
Vrabie, V., Granjon, P., and Serviere, C. (2003). Spectral
kurtosis: from definition to application. In IEEE, edi-
tor, IEEE-EURASIP International Workshop on Non-
linear Signal and Image Processing (NSIP’2003), vol-
ume 1, pages 1–5.
ICINCO 2008 - International Conference on Informatics in Control, Automation and Robotics
162
