
A GENETIC ALGORITHM APPLIED TO THE POWER SYSTEM
RESTORATION PLANNING PROBLEM
A Metaheuristic Approach for a Large Combinatorial Problem
Adelmo Cechin, José Vicente Canto dos Santos, Arthur Tórgo Gómez and Carlos Mendel
Pipca - UnisinoS, Av. Unisinos 950, São Leopoldo, Rio Grande do Sul, Brazil
Keywords: Genetic Algorithms, Electric Power Systems, Power System Restoration Planning Problem.
Abstract: This work reports the use of a Genetic Algorithm (GA) to solve the Power System Restoration Planning
Problem (PSRP). The solution to the PSRP is described by a series of operations or a plan to be used by the
Power System operator immediately on the occurrence of a blackout in the electrical power supply. Our GA
uses new initialization and crossover operators based on the electrical power network, which are able to
generate and maintain the plans feasible along GA runs. This releases the Power Flow program, which
represents the most computer demanding component, from computing the fitness function of unfeasible
individuals. Results for three different electrical power networks are shown: IEEE 14-Bus, IEEE 30-Bus
and a large realistic system.
1 INTRODUCTION
The Power System Restoration Planning Problem
(PSRP) can be defined as the search for an optimal
sequence of control actions leading a faulty
electrical power system from a restoration state of
operation to a secure state. The secure state is
defined by a normal energy supply with all
operational limits observed. The transition of one
state to the other is performed through a series of
commands sent by the power system operator to the
power system. Each faulty situation demands a
specific sequence of commands to bring, as fast as
possible, the power system back to the secure state.
These operations include the connection and
disconnection of line sections without overloading
the electrical system components.
Further, the PSRP is a multistage problem, being
the objective of each stage the reestablishment of the
service to a group of priority loads. The solution
must obey additional constraints such as those
placed by a priority chain in the energy supply. For
instance, first hospitals must be attended, then public
services, and so on, if distribution context is
considered.
However, the main constraint is the time gap
while consumers are without energy, which must be
kept as small as possible.
The Power System Restoration Planning may be
carried out off or on-line. Off-line plans are typically
based on previous operator experiences in restoring
a faulty system. The efficiency of this process rests
on the ability of the restoration program (or
operator) in finding a similar network state and in
applying the corresponding plan. However, if a new
contingency occurs, a new plan (on-line) has to be
generated. In the simplest case, this can be achieved
by shooting down some part of the network and
bringing it back to a known state, for which a plan
exists. The other solution, certainly better, starts
directly from the actual network state.
Two main classes of algorithms have been used
to solve this problem: deterministic and stochastic
ones. One of the first efforts for treatment of the
PSRP with deterministic techniques was the work of
(Sakaguchi and Matsumoto, 1983), who had created
a Knowledge Based System (KBS) based on the
knowledge of the power system operator. This was
followed by other works using an expert system
approach, such as (Komai et al, 1988) and Kojima et
al (1989). As the size and complexity of electrical
power systems surpassed the capacity of human
control and therefore of rules based on human
knowledge, other methods were developed, such as
(Aoki et al, 1987) using the classical integer
programming approach, (Huang et al, 1991) using
optimization techniques (Nagata et al, 1995) using a
100
Cechin A., Vicente Canto dos Santos J., Tórgo Gómez A. and Mendel C. (2008).
A GENETIC ALGORITHM APPLIED TO THE POWER SYSTEM RESTORATION PLANNING PROBLEM - A Metaheuristic Approach for a Large
Combinatorial Problem.
In Proceedings of the Fifth International Conference on Informatics in Control, Automation and Robotics - ICSO, pages 100-107
DOI: 10.5220/0001480201000107
Copyright
c
SciTePress
hybrid system of rules and mathematical
programming. For a review on these methods, see
(Curcic et al, 1997). Even for these methods, the
determination of hundreds of discrete variables in
time is a complex task. Therefore, stochastic
methods combined with power flow simulation tools
became an interesting alternative to the deterministic
approaches (Matos et al, 2004).
Stochastic approaches such as Neural Networks
(Hsu and Huang, 1995) (Bretas, 2003) and Genetic
Algorithms (Bretas, 1998) (Luan et al, 2002) are
relatively new and have received some criticisms
such as that they typically use a fixed length string
to represent the solution plan, high computing times
and the low confidence of the power system operator
on the generated plans (Susheela, 2000). In order to
solve these problems, we propose a variable length
solution representation (chromosome) with new
mutation and crossover operators. In relation to the
computing time, first, only feasible solutions are
generated and second, our crossover operator
maintains the feasibility of the plan. This spares time
because the computation of the power flow along the
plan represented in the chromosome does not end in
an unfeasible solution and therefore must not be
immediately discarded. A plan in the population
may have a low score but is rarely discarded because
of unfeasibility. The crossover cut occurs only at
network states in each plan submitted to the
crossover operator.
The third criticism, the confidence of the power
system operator on the obtained solution, can be
partially solved by exhaustively testing and by
carrying out demonstrations on previous cases with
the planner and power flow simulator. However, we
propose in this work that sound solutions may be
obtained if this aspect is considered in the fitness
function already, for instance, by requiring a good
quality solution along the plan and not just at the last
stage of the restoration. Finally, the increase in
computer performance will certainly turn those
methods now just used for the composition of a
restoration plan into on-line solutions with a
response time from seconds to minutes.
This paper is organized as follows: after the
introduction, section 2 presents the restoration
system and its components. Section 3 shows the
Genetic Algorithm component with a description of
the GA operators and section 4 presents results for
three different power systems, the IEEE 14-Bus
system and IEEE 30-Bus (Freris and Sasson, 1968)
and finally the CEEE 146-Bus. Section 5 presents
our conclusions.
2 THE RESTORATION SYSTEM
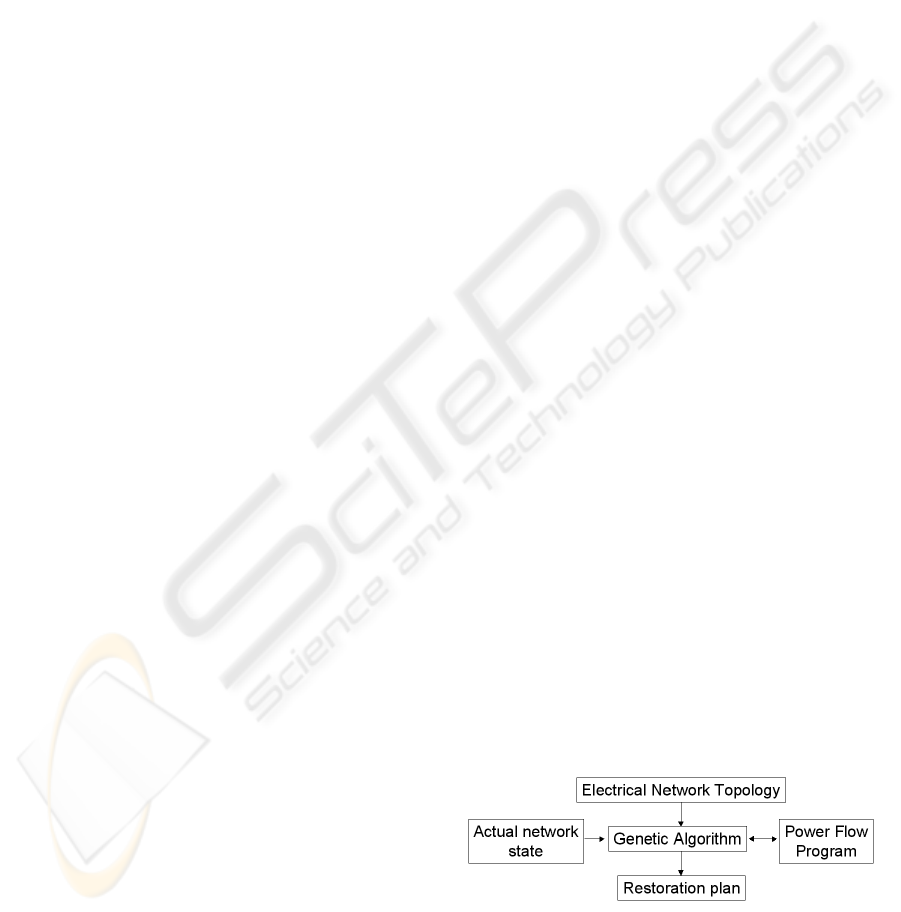
The main components of the restoration system are
shown in Figure 1. The GA component obtains
information about the network topology by reading
the Electrical Network Topology file. This file
describes the buses with their connected generators
and loads as well the transmission lines among
buses. As an illustration, the upper part of Figure 3
shows a schematic view of the IEEE 14-Bus
topology file. The topology and the actual network
state are used to create an initial population of
feasible solutions. The actual state of the electrical
network is defined by the actual pattern of
connections and activity/inactivity of buses and must
be read from the real network through sensors and
state observers.
Then, during a GA generation, each
chromosome (restoration plan) is used to drive the
whole power system through a series of states, from
the actual state to an end state, hopefully with all
loads restored. Further, the intermediate states of the
network must obey the component limits and
available power for the loads. Each such state is
computed by the Power Flow Program (PFP), whose
results are turn back to the GA. Then, the fitness
function is used to evaluate the restoration plan.
The PFP is called many times for the evaluation
of a chromosome. If the plan in the chromosome is
composed of N stages, then the PFP is called N
times. For example, if a GA needs a population of
size 25 and 25 generations to find a good plan, then
the PFP will be executed 25×25×N times. Our work
spares this time by generating and processing
feasible solutions and leaving a small margin for
unfeasible solutions only in the case of mutated
chromosomes, and only for intermediate solutions
(before the last generation).
The PFP implements the classical fast decoupled
Power Flow method of Stott and (Alsaç, 1974) and
was developed by (Canto dos Santos et al, 2006) In
that work, another approach to the .problem, based
on Linear Programming, was presented.
Figure 1: Restoration system components.
A GENETIC ALGORITHM APPLIED TO THE POWER SYSTEM RESTORATION PLANNING PROBLEM - A
Metaheuristic Approach for a Large Combinatorial Problem
101

3 GENETIC ALGORITHM
COMPONENT
The design of the chromosome format is crucial in
quickly finding an optimal solution. First, the
mutation operator must have a small impact on the
chromosome performance (big random jumps should
be avoided) and second, the crossover operator
should transfer whole functional blocks avoiding
any rough breaking of these functional blocks. In
this work, the time axis is mapped on the linear
chromosome structure.
3.1 Chromosome Representation
Different of the classical GA approach (Goldberg,
1989), the new chromosome representation has a
variable size, consisting of a sequence of stages,
each containing a group of commands sent to the
electrical power system. As the commands are sent,
lines and buses change their state. As will be shown
in the next section, these states are used to define the
crossover points.
For this new proposed representation, each
chromosome codes a sequence of operations or
stages and has a variable size. Not only the whole
sequence has a variable size, but also each stage is
composed of a variable number of operations, which
are executed simultaneously during the restoration
process. Further, the different chromosome sizes and
the requirement for feasibility of the restoration
plans demanded a new crossover operator different
from the classical ones.
Figure 2 shows two different illustrative
representations of the chromosomes. The stages are
shown as discrete elements (white boxes) inside
each chromosome and they contain a group of
operations. Each operation in turn is represented by
a pair of identifiers using the format “<address>:
<operation>”. The operations are divided into two
groups: operations on lines and operations on buses.
The <address> identifies the bus or line on which
the <operation> will be executed. If the operation is
executed on a bus n, its <address> is expressed as
Bn. If it is executed on a transmission line n, its
<address> is Ln. The other identifier represents the
operation. Operations on transmission lines include
the connection of one of its end points (the origin
point or operation O+ and destiny point or operation
D+). Operations on buses may be a load connection
to the bus (operation L+), connection of the power
supply (operation Ger) and the connection of
synchronous compensators to the bus (operation
C+). The system was designed so as to enable
simple additions of other operations as well new
equipment types.
For instance, the second stage in Figure 2
represents the connection of the origins of
transmission line L1 and L2 at the same time.
Figure 2: Chromosome representation as a vector of stages
with discrete operations. The operations are indicated by
mnemonic and numeric codes. The first line shows a
chromosome in a mnemonic format and the second line, in
a numeric format.
3.2 Genome Initialization
The highly flexible representation of the
chromosome demanded the inclusion of specific
program modules for the generation of feasible
chromosome initializations.
In order to obtain feasible initializations, first a
graph is generated in which buses are represented by
nodes and transmission lines by edges. Also, the
buses associated with black start generators (capable
of restarting with no external power source) are at
the root of the graph and are connected with other
buses in a tree-like way. The graph represents the
topology of the power system.
Then, a Random Search (RS) is carried out on
the graph from the root nodes where components
attached to buses are randomly selected. For each
selected component an operation is chosen. Since
many components may be chosen at the same stage,
not only an operation is created, but a whole
operation set may be created and added to the
current chromosome. This way, different operation
sequences are placed in the initial population.
An example of the genome initialization process
is shown in Figure 3 for the IEEE 14-Bus power
system topology composed of 14 buses, 18
transmission lines, 2 generators and 11 loads
(arrows). In this example, the objective is to find a
sequence of operation sets, which should lead the
power system from an initial state characterized by
total blackout to a final state with all loads supplied.
The nodes in the topology graph represent the buses
and the links the transmission lines. In the real
operation, these data are obtained from a supervisory
system. In the first step (topology graph (1)), only
the bus 1 (node 1) is activated, fed by the generator
ICINCO 2008 - International Conference on Informatics in Control, Automation and Robotics
102
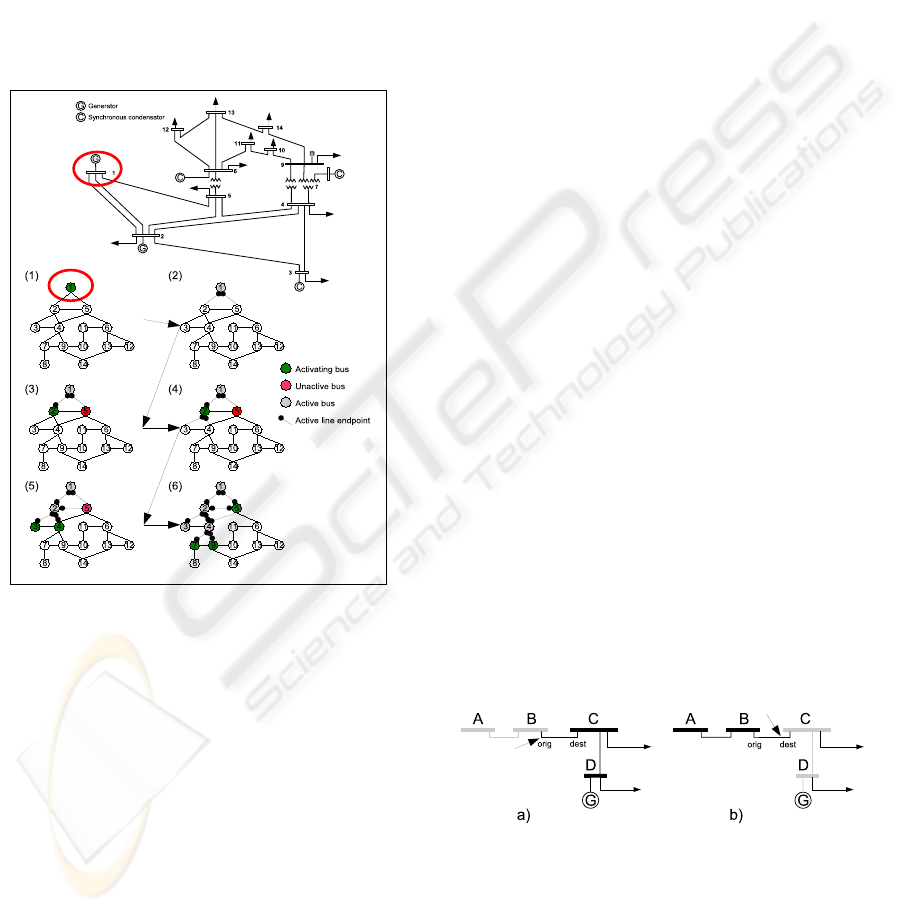
(black start capable generator) connected to the bus.
Then (graph (2)), the algorithm computes which are
the nodes linked to already activated nodes such as
in a Random Search. From the nodes allowed to be
activated, the algorithm chooses randomly if they
shall be activated or not generating different
individuals. In the next steps, the algorithm proceeds
considering all the nodes directly linked to the
already activated nodes and determines if and which
ones shall be activated. Note that the algorithm may
activate more than one bus at the same time. For
instance, from graph (4) to graph (5), both buses 3
and 4 (nodes 3 and 4) were activated simultaneously.
Figure 3: Demonstration of the genome initialization
process for the IEEE 14-Bus system. The graph is
searched and the corresponding buses are randomly
activated. At each step, inactive buses have a renewed
opportunity to be activated by the algorithm. Buses are
indicated by numbers, transmission lines by solid lines and
loads by arrows.
The resulting activations during these steps are
accordingly indexed in the genome in the form of
operations, and the initialization process continues
until all the nodes are connected to active buses and
the number of inactive nodes reaches a previously
chosen random limit. Therefore, different solutions
are generated, all of them considering possible
pathways described in the topology graph. For
instance, there is no sense in connecting bus 14
before bus 9 or bus 13 is activated. The randomness
of the bus activation creates chromosomes with
diverse solution strategies ensuring a good coverage
of the solution space.
3.3 Crossover Operator
Due to the more flexible representation of the
chromosome, a new crossover operator was
developed, which avoids improper operations, such
as the connection of a load or generator (not the
black start capable generator) to a bus without
power.
The classical GA crossover cuts two
chromosomes at the same position because there is
an exact correspondence between both left and right
sides of the chromosomes. However, the flexibility
of the operation positioning inside the variable size
chromosome demands the computation of
synchronization states in the parents’ chromosomes.
Each stage in a chromosome is associated with a
network state, which is used by the crossover
operator. This state is the result of all operations of
all stages to the left side (before) of the respective
chromosome stage and of the operations in the stage.
Lines may be in one of four states:
• not connected;
• origin point connected;
• end point connected;
• totally connected.
Each end of a transmission line was modeled by a
different connection for two reasons: first, this is
more realistic, resulting in solutions that can be
readily understood by the system operator and
second, if the line model had included just one
connection, then the activation of the line would
automatically activate both connected buses at the
same time.
Figure 4 shows an example how a line is
activated, depending on the sequence of bus
activation and end connections.
Figure 4: Example of how a line may be activated from
different sides. In case a) the line is activated by the bus B
if it is activated and the “orig” end of the line is connected.
In the case b), the line is activated if the bus C is activated
and the “dest” end is connected.
A GENETIC ALGORITHM APPLIED TO THE POWER SYSTEM RESTORATION PLANNING PROBLEM - A
Metaheuristic Approach for a Large Combinatorial Problem
103
For the buses, the allowed states are:
• inactive bus (disconnected);
• bus activated - when the bus has power from a
transmission line or generator;
• generator connected;
• load connected;
• synchronous compensator connected.
The states of the buses in both chromosomes are
compared, and if the network state is the same, they
are equivalent.
All the equivalent state pairs are stored in a list,
and a position in the list is randomly chosen, which
represents the stage at which the two sequences will
be cut and where the crossover occurs.
A consequence of the use of this operator is that
the resulting sequences (children) have a different
number of operations reaching the same state, which
means that some of them will be smaller and,
possibly, more efficient than the others.
This process is illustrated in Figure 5. In this
case, a new chromosome generated by crossover of
the left side of the upper chromosome and the right
side of the lower chromosome may be better than
both parent chromosomes in terms of number of
stages. The left side of the upper chromosome takes
a smaller number of stages to reach the same state
than the lower chromosome and it will be
transmitted to the children chromosome.
Figure 5: Determination of equivalent stages in two
chromosomes of the genome. Different pairs of equivalent
stages are stored in a list and one of them (the white one,
for instance) is randomly chosen. Dotted lines show the
stages in the chromosomes where the two sequences are
divided for the crossover operation.
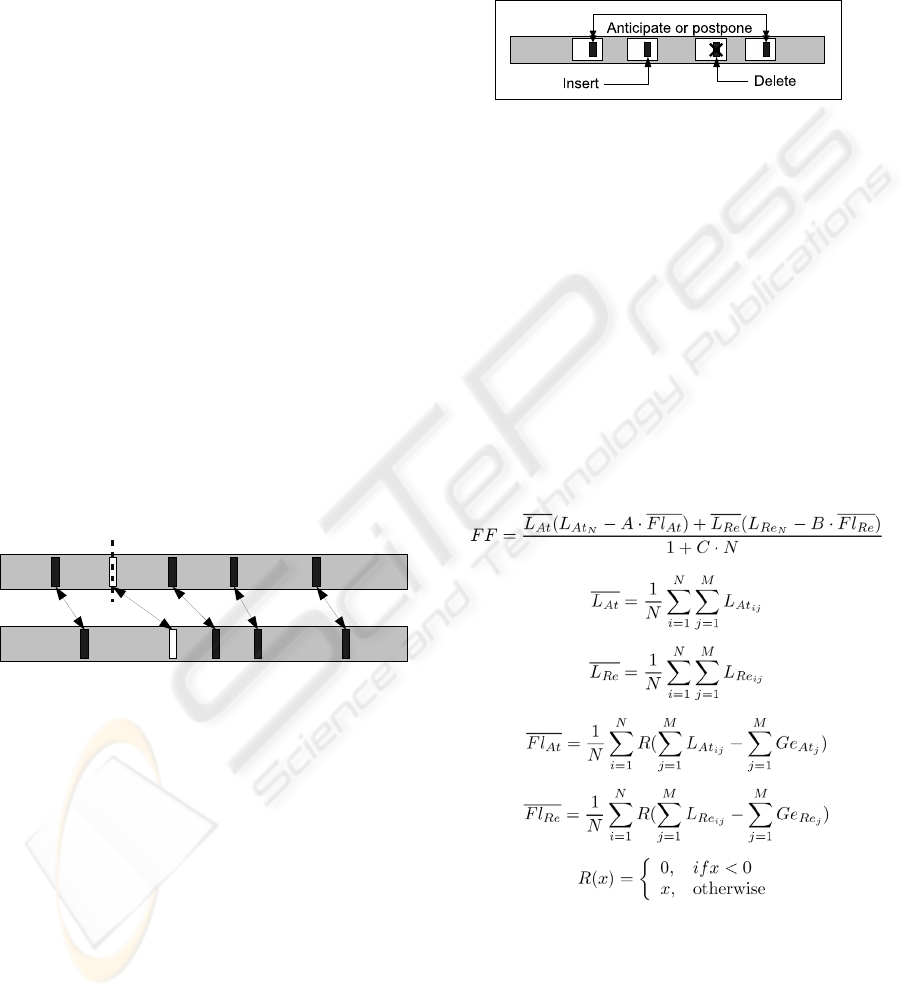
3.4 Mutation Operator
There are three types of mutations: inclusion and
exclusion of an operation in one stage and
permutation of operations in two stages. As an
illustration of the steps performed by the mutation
operator, see Figure 6. Because these are
unrestricted operations on the chromosome, these
may generate unfeasible solutions with respect to the
delivered and consumed power. Unfeasible solutions
are tolerated only at intermediate generations of the
GA and intermediate stages of the chromosome
because this increases the diversity of solutions and
helps the GA to escape local minima. For instance, a
certain load requiring more power than available
may be connected during intermediate generations.
However, only feasible plans are considered in the
end generation.
Figure 6: Representation of possible mutations. The white
rectangles represent stages and the black ones, possible
operations in the stages. The operations can be included,
excluded or transferred from one stage to another by the
mutation operator.
3.5 Fitness Function
In order to compute the fitness function, the
operations described in the chromosome are used by
the PFP to compute the power flow at each stage.
In this work, the flexibility of the fitness function
was maintained by the use of parameters (A, B and C
in the following equations) allowing a detailed
analysis of the influence of each system variable on
the solution obtained by the GA. The fitness
function FF is defined by:
where M is the number of buses in the power
system, N is the number of stages, L
At
and L
Re
are the
active and reactive loads respectively, Ge
At
and Ge
Re
are the generated active and reactive power
respectively, and A, B and C are trimming constants.
i and j denote the stage and bus respectively and
R(x) is the ramp function.
ICINCO 2008 - International Conference on Informatics in Control, Automation and Robotics
104
The main component of the fitness function is the
supplied active and reactive loads at the last stage N,
L
At
N
and L
Re
N
. However, tests with just these
variables presented solutions which were not
balanced along the stages and are difficult to be
accepted by the system operator. The inclusion of
the mean of the loads along the stages intends to
meet, at each stage, the highest possible number of
active and reactive loads, a good distribution of
supplied loads along the stages and a sound solution
to the system operator.
Parameters A and B decrease the fitness function
of individuals in case the generated power is lower
than the total load of the system and therefore help
to discard any unfeasible solution generated during
the GA runs by the mutation operator. The inclusion
of the supply power failure in the fitness function
intends to obtain solutions whose power generation
is sufficient to attend all the connected loads. The
parameters A and B control how tolerant is the GA
to unfeasible solutions during runs. This allows
suboptimal solutions to remain in the population and
thus contributing to maintain the diversity of the
population. Both parameters may be increased in the
last few generations leaving only feasible solutions
in the population.
Since the quick evaluation of the PFP is the main
concern for a practical use of the GA, the PFP needs
only to compute the state of the connected part of
the network. Then, as the restoration program goes
through each stage in the chromosome, only the
buses and lines necessary to the execution of the
current stage are transferred to the PFP, reducing the
number of nodes and edges the PFP has to consider
during the calculations. As the electrical network
gets more and more connected with each new stage,
its size increases and the computations in the PFP
become harder to carry out.
Other fitness functions were designed. However,
the previous fitness function resulted in the best
solution plans, with a quick attendance of the needed
power while maintaining the power generation
restrictions.
4 RESULTS
In this section, results of experiments performed
with three different power systems, the IEEE 14-Bus
system, IEEE 30-Bus and finally the CEEE 146-Bus,
three power systems with increasing degree of
complexity are shown. Each experiment used a
different population initialization and all electrical
parameters of the systems were monitored, such as
the active and reactive powers of the best genome in
each generation. After running each experiment, the
best genome in the population is shown in a graphic
representation. As each stage corresponds to a group
of operations executed on the power system and the
execution of each such operation spends time, a
correspondence can be made between the
consecutive execution of those stages and the
restoration elapsed time. It will be assumed that each
stage takes one unit of time to be executed.
It was considered the occurrence of a general
blackout in the IEEE 14-Bus (Freris and Sasson,
1968) system and that only the generator at bus 1 is
black start able. Also, all the 20 branches are
available for the restoration.
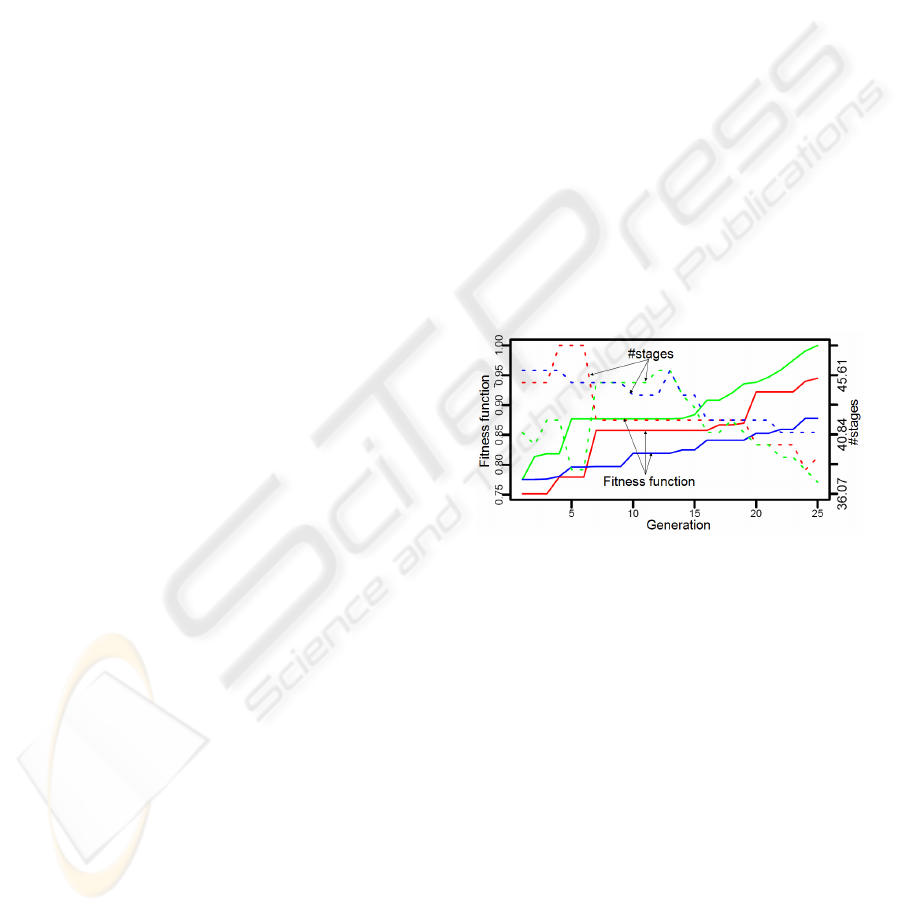
In Figure 7, the evolution of the GA with three
different initializations is presented. Typically, the
GA starts with 40-50 stages (dashed lines) and a
fitness function of 0.75 (solid lines) of the maximum
value, showing that many solutions generated by our
method have a high fitness function (and feasible) at
the GA initialization already. As the GA computes
new solutions, the fitness function increases and the
number of stages needed to reach it decreases.
Figure 7: Three GA runs for the IEEE 14-Bus System,
with a population size=25 chromosomes and fitness
function FF with parameters A=1, B=5 and C=1. Solid
lines represent the value of the normalized fitness function
for the three runs (scale at the left side of the graph) while
dashed lines represent the number of stages (scale at the
right side of the graph) of the best solution in the
population.
Figure 8 shows the corresponding plan obtained.
The generated and delivered power of the best
individual in the population is shown along the
restoration stages. Results for the power system
IEEE 30-Bus using the same GA parameters are
shown in Figure 9. It can be observed that the GA
obtained an efficient solution in terms of used
power. For instance, once the difference between
generated and consumed reactive power reaches
zero, there is an increase in the power generated so
as to supply the new loads. Afterwards, the loads are
connected to the system until that margin reaches
A GENETIC ALGORITHM APPLIED TO THE POWER SYSTEM RESTORATION PLANNING PROBLEM - A
Metaheuristic Approach for a Large Combinatorial Problem
105
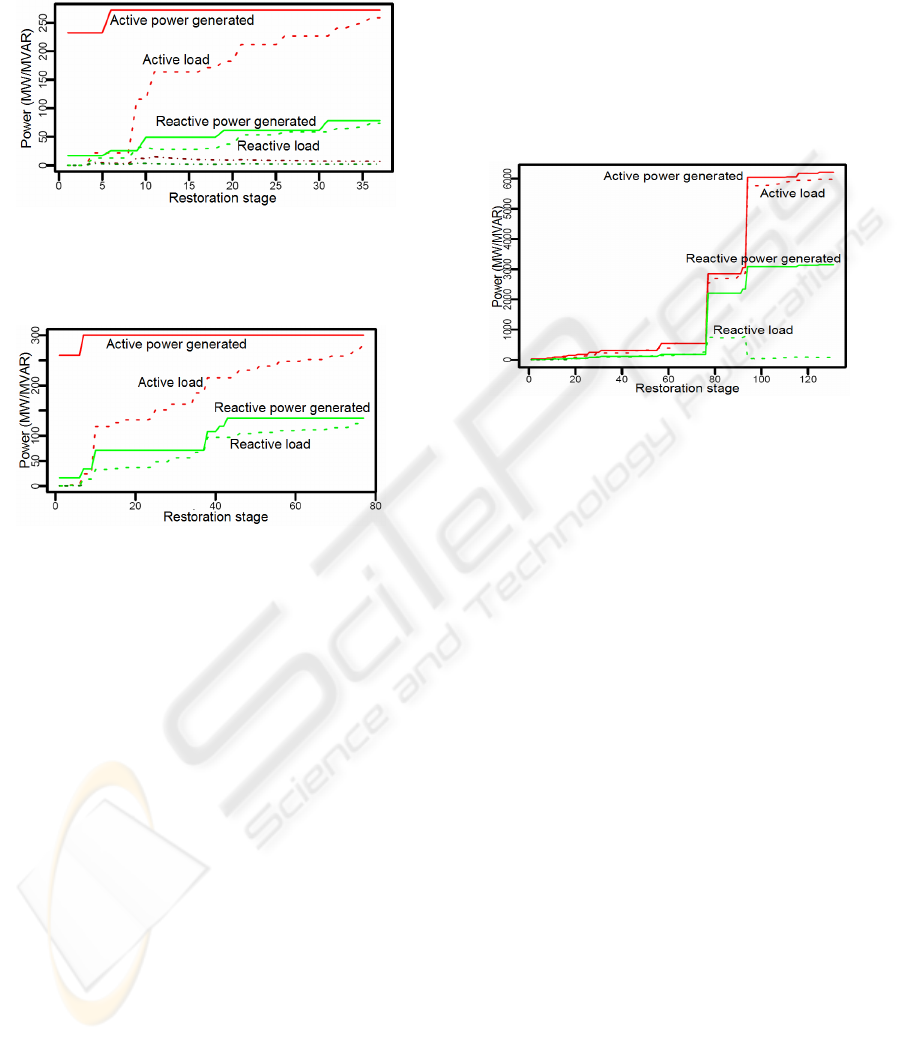
zero again, and so on. Further, as expected, the plan
for a larger power system such as the IEEE 30-Bus
demands more stages, for instance, 37 for the IEEE
14-Bus and 78 for the IEEE 30-Bus .
Figure 8: Restoration of the IEEE 14-Bus. Solid lines
represent the active and reactive power generated while
the dashed ones represent the power consumed or the total
loads.
Figure 9: Restoration of the IEEE 30-Bus power system.
Solid lines represent the active and reactive power
generated while the dashed ones represent total loads.
Finally, we tested the GA algorithm with the CEEE
(a real life Brazilian system) power system
composed of 146 buses and 196 transmission lines
in south Brazil. Figure 10 shows one of the obtained
plans. Approximately 130 stages are needed to
restore the full system from a complete blackout.
Certainly, the set of experiments presented in
this section represents only part of all test performed
with our approach. Other tests varying the number of
generations, population size, fitness function and
parameters were performed too.
5 CONCLUSIONS
The objective of this work was to show a restoration
system based on a GA that presents efficient plans to
the power system operator when a blackout or any
other serious lacks occurs. The use of GA for the
generation of operation sequences, or strategies is
only possible with the careful codification of the
operation sequences in the chromosome taking into
account the electrical power network topology. If the
task of determining the feasibility of the solutions is
entirely left to the PFP, then the GA generates many
unfeasible solutions with a direct impact on the
performance of the GA. Also, there must be a limit
on the number of allowed generations if the system
is to be used in an on-line modus. For example, in
this work, this number was set to 25 generations. All
this enable the GA to quickly find a solution without
wasting of time computing the power flow for
unfeasible individuals.
Figure 10: Power system restoration plan for the CEEE
System, obtained with a GA with a population size=25,
number of generations=25, and parameters A=1, B=5 e
C=1.
The choice of the fitness function is important to
define the quality of the obtained solution. In this
work, a parameterized function was chosen as a
good compromise among user priorities, flexibility
and complexity of the function. Also, a good
distribution of connection operations along the plan
represents a sound solution for the operator. In this
respect, we observe that there are no works
considering the quality of operation stages along the
plan in terms of soundness for the system operator,
as proposed in this article. Certainly, this is one of
the causes for the low confidence level of system
operators on solutions obtained by stochastic
algorithms.
However, some care must be kept in relation to a
solution found by stochastic algorithms. A GA may
find a good solution in terms of fitness function but
it may be unfeasible. The stochastic freedom of GA
solutions may be kept at the intermediate
generations with the risk of reaching the last
generation with unfeasible plans in the whole
population. For example, if the best individual is
good but unfeasible, its genes may propagate along
the population making all of them unfeasible. This is
called lost of diversity in the GA area. Therefore,
there must be a compromise between keeping all the
time all the solutions feasible (for example, making
ICINCO 2008 - International Conference on Informatics in Control, Automation and Robotics
106

the parameters A and B very high) and maybe
loosing a good solution, and leaving the GA
completely free to generate and process any solution
plan. We think that in this respect we could attain a
good compromise by allowing only the mutation
operator to generate unfeasible solutions at
intermediate generations and also by considering
only feasible end solutions in the last generation.
Finally, researches in progress point out to the
need of inclusion of more complex and realistic
simulations, such as the dynamical behavior of the
electrical power system. For example, the simulation
of voltage and current overshooting during
switching operations, which can cause the breaking
of lines by limiting current and voltage devices,
could preview an instable system reaction leading
the power system to a complete blackout. Since this
analysis increases the processing time of the PFP,
any such addition makes the feasibility analysis
presented in this work even more important.
Currently, the use of other metaheuristics,
specifically Tabu Search, is being studied and will
be published in the future.
REFERENCES
Aoki, K., Kuwabara, H., Satoh, T., Kanezashi, M. (1987)
Outage state optimal load allocation by automatic
sectionalizing switches operation in distribution
systems. IEEE Trans. Power Delivery PWRD-2:
pp.1177-1185.
Bretas, N., Delben, A. and Carvalho, A. (1998) Optimal
energy restoration for general distribution systems by
genetic algorithm. In Power System Technology, 1998
International Conference on, volume 1, pages 43–47.
Bretas, A. and Phadke, G. (2003) Artificial neural
networks in Power System Restoration. IEEE
Transactions on Power Delivery, 18(4):1181–1186 .
Canto dos Santos, J., Gómez, A., Rodrigues, A. (2006) An
optimization algorithm to improve security of
electrical energy systems. In ICINCO 2006 - 3rd Int.
Conf. on Informatics in Control, Automation &
Robotics. Setubal - Portugal. INSTICC Press.
Curcic, S., Ozveren, C.S., Lo, K.L. (1997) Computer-
based strategy for the restoration problem in electric
power distribution systems. Inst. Electr. Eng. Proc.
144: 389-398.
Freris, L., Sasson, A. (1968) Investigation of the Load
Flow Problem, Proceedings of IEE, 115(10): 1459-
1470.
Goldberg, David E. (1989) Genetic Algorithms in search,
optimization, and machine learning. Addison Wesley
Longman Inc.
Hsu, Y. and Huang, H. (1995) Distribution systems
service restoration using the artificial neural network
approach and pattern recognition method. In IEE
Proceeding on Generation, Transmission and
Distribution, volume 142, pages 251–256.
Huang, J.. Galiana, F. and Vuong, G. (1991) Power
system restoration incorporating interactive graphics
and optimization. In Power Industry Computer
Application Conference, 1991. Conference
Proceedings, pages 216–222, Baltimore.
Komai, K., Matsumoto, K. and Sakaguchi, T. (1988)
Analysis and evaluation of expert’s knowledge for
Power System Restoration by mathematical
programming method. IEEE International Symposium
on Circuits and Systems, 2(1):1895–1898.
Kojima, Y., Warashina, Nakamura, S. and K. Matsumoto,
K. (1989) The development of power system
restoration method for a bulk power system by
applying knowledge engineering techniques. IEEE
Transactions on Power Systems, 4(2):1228–1235.
Luan, W., Irving, M. and Daniel, J. (2002) Genetic
algorithm for supply restoration and optimal load
shedding in power system distribution networks. In
IEE Proceeding on Generation, Transmission and
Distribution, volume 149, pages 145–151.
Matos, M., Ponce de Leão, M., Saraiva, T., Fidalgo, J.,
Miranda, V., Lopes, J., Ferreira, R., Pereira, J., Proença,
M., Pinto, J., (2004). Metaheuristics applied to power
systems in Metaheuristics: computer decision-making,
Kluwer Academic Publishers, Norwell, MA, USA
Nagata, T., Sasaki, H. and Yokoyama, R. (1995) Power
System Restoration by joint usage of expert system
and mathematical programming approach. IEEE
Transactions on Power Systems, 10(3):1473–1479.
Sakaguchi, T. and Matsumoto, K. (1983) Development of
a knowledge based system for Power System
Restoration. IEEE Transactions on Power Apparatus
and Systems, PAS-102(2):320–329.
Stott, B., Alsac, O. (1974) Fast Decoupled Load Flow.
IEEE Transactions Power Apparatus and Systems,
Vol 93, May / June 1974, pp. 859-869.
Susheela, D.V. and Murty M.N. (2000) Stochastic search
techniques for post-fault restoration of electrical
distribution systems. Sadhana, vol. 25, Part 1,
February 2000, pp. 45-56.
Wu, F. and Monticelli, (1988) A. Analytical tools for
Power System Restoration - conceptual design. IEEE
Transactions on Power Systems, 3(1):10–16.
A GENETIC ALGORITHM APPLIED TO THE POWER SYSTEM RESTORATION PLANNING PROBLEM - A
Metaheuristic Approach for a Large Combinatorial Problem
107
