
HIERARCHICAL EVALUATION MODEL FOR 3D FACE
RECOGNITION
S´ıdnei A. Drovetto Jr., Luciano Silva and Olga R. P. Bellon
IMAGO Research Group, Universidade Federal do Paran´a, Curitiba - PR, Brazil
Keywords:
Face recognition, Simulated Annealing, 3D image registration, Surface Interpenetration Measure.
Abstract:
In this paper we propose to perform 3D face matching based on alignments obtained using Simulated
Annealing (SA) algorithm guided by the Mean Squared Error (MSE) with M-estimator Sample Consensus
(MSAC) and the Surface Interpenetration Measure (SIM). The matching score is obtained by calculation of
the SIM after the registration process. Since the SIM is a sensitive measure, it needs a good alignment to give
relevance to its value. Our registration approach tends to reach a near global solution and, therefore, produces
the necessary precise alignments. By analyzing the matching score, the system can identify if the input images
come from the same subject or not. In a verification scenario, we use a hierarchical evaluation model which
maximizes the results and reduces the computing time. Extensive experiments were performed on the well-
known Face Recognition Grand Challenge (FRGC) v2.0 3D face database using five different facial regions:
three regions of the nose; the region of the eyes; and the face itself. Compared to state-of-the-art works, our
approach has achieved a high rank-one recognition rate and a high verification rate.
1 INTRODUCTION
Recently, some approaches for 3D face recognition
have used image registration to measure the similar-
ity between faces, often based on MSE or Root Mean
Squared Error (RMSE) (Chang et al., 2006; Chang
et al., 2005; Lu and Jain, 2005; Lu et al., 2006). In
all these approaches, Iterative Closest Point (ICP) is
traditionally applied as the registration method. How-
ever, ICP demands good initial pre-alignment to be
successfully applied, which is not adequate for an
automatic approach. Also, ICP is guided by the
MSE but it was proved (Silva et al., 2005a) that this
measure could allow imprecise local convergence for
range image registration, even when improved ICP-
based approaches are used (Rusinkiewicz and Levoy,
2001; Gelfand et al., 2003). In addition, in (Silva
et al., 2005a) the authors suggest that MSE is a good
measure for starting the image registration process,
but SIM could be more suitable to be used at “the end
of the game” to assess the quality of the registration.
To surpass these limitations, we developed an
approach for 3D face registration that uses the
SIM (Silva et al., 2005a) to measure the similarity
between facial regions. Also, since SIM is a sensi-
tive measure, a good final alignment is required for it
to produce a reliable value. Then, this precise align-
ment is achieved using a SA based approachfor image
registration. In the last stage of the registration pro-
cess, the goal of SA is to maximize SIM and, there-
fore, the similarity between the faces can be reliably
calculated. Very extensive results and comparisons
between ICP and SIM-based registration approaches
can be found in (Silva et al., 2005b).
The two main functionalities of biometric systems
are handled in different ways in our approach. First,
for the verification scenario, we employ a hierarchi-
cal evaluation model that analyzes, separately, only
the segmentation results that are relevant to make the
correct decision. Then, for the recognition scenario,
the matching score is calculated for each segmenta-
tion result and after that, all of them are combined
into one score that is used for identification.
Extensive experiments were performed on the
well-known FRGC v2.0 3D face database. The ex-
perimental results showed that our approach pro-
duces good results for both recognition and verifi-
cation scenarios when compared to state-of-the-art
works (Chang et al., 2006; Chang et al., 2005; Lu and
Jain, 2005; Lu et al., 2006).
This paper is organized as follows. First, in sec-
tion 2, we review some related works. Next, we in-
troduce our 3D face matching approach in section 3.
For a verification scenario, we have adopted a hi-
67
A. Drovetto Jr. S., Silva L. and R. P. Bellon O. (2008).
HIERARCHICAL EVALUATION MODEL FOR 3D FACE RECOGNITION.
In Proceedings of the Third International Conference on Computer Vision Theory and Applications, pages 67-74
DOI: 10.5220/0001087900670074
Copyright
c
SciTePress

erarchical evaluation model that is described in sec-
tion 4. The experimental results summarizing the ob-
tained rates for recognition and verification problems
are presented in section 5, followed by the final re-
marks in section 6.
2 RELATED WORKS
In (Chang et al., 2006; Chang et al., 2005) the authors
propose the use of three overlapping regions around
the nose — circular nose region, elliptical nose region
and nose region — to overcome the facial expression
problem, since these regions are approximately rigid
across expression variation. The matching score for
each region are combined to improve the accuracy.
The steps involved in this approach are: (1) face ex-
traction: using skin detection applied to the 2D image;
(2) curvature based segmentation and landmark detec-
tion; (3) pose correction: the extracted face is aligned,
using ICP, to a generic 3D face model; (4) extraction
of nose regions based on the landmarks; (5) registra-
tion of surfaces: the registration is accomplished by
ICP and the matching score is the resulting RMSE.
Combining the three nose regions, this approach
achieved a rank-one recognition rate of 97.1% and
a Equal Error Rate (EER) of approximately 0.12%
using only neutral expression images (Chang et al.,
2006). The neutral expression database used in the
experiments consists of 2,798 images of 546 subjects.
The images were divided into one gallery, with 449
images, and nine probe sets totalizing 2,349 images.
In (Lu and Jain, 2005; Lu et al., 2006) the 2D
and 3D images are used to perform face recogni-
tion. ICP is used to match the 3D data and Linear
Discriminant Analysis (LDA) employed to match the
2D images. The combination of the values is done
using the weighted sum rule (Kittler et al., 1998).
This approach is composed by three steps: (1) coarse
alignment based on feature points (obtained manu-
ally); (2) fine alignment: using a modified version
of ICP which alternates point-to-point distance (Besl
and McKay, 1992) and point-to-plane distance (Chen
and Medioni, 1992); (3) LDA match on a dynamically
generated gallery; (4) integration. The matching score
for the 3D data is the RMSE of the point-to-plane dis-
tance provided by ICP.
By integrating ICP and LDA matching scores, this
approach obtained a rank-one recognition rate of 99%
using only neutral expression frontal face views. The
gallery is composed by 200 3D face models and the
probe has 99 neutral expression frontal images.
As we can see, both approaches are based on
RMSE values provided by ICP and achieve a high
rank-one recognition rate. Also, both approaches
have performed experiments using images contain-
ing facial expressions, but their best results, presented
above, were obtained using only neutral expression
images.
3 3D FACE MATCHING
We propose to perform 3D face matching by combin-
ing a precise registration technique and the SIM (Bel-
lon et al., 2006) to evaluate different facial regions.
The registration is obtained by a SA based approach,
which have two important advantages: (1) it tends to
find a near global solution; (2) it can be easily inte-
grated with different kinds of estimators. We use two
robust measures in our SA approach. First the MSAC
is combined with the MSE for a coarse alignment and
latter SIM is applied to achieve a fine registration. The
matching score is given by the SIM value of the fi-
nal alignment for the two images. The SIM is used
as matching score because it produces a better range
for discrimination between faces, when compared to
other metrics.
3.1 The Surface Interpenetration
Measure
The SIM was developed by analyzing visual results
of two aligned surfaces, each rendered in a different
color, crossing over each other repeatedly in the over-
lapping area (Silva et al., 2005b). The interpenetra-
tion effect results from the nature of real range data,
which presents slightly rough surfaces with small lo-
cal distortions caused by limitations of the acquiring
system. Because of this, even flat surfaces present a
“roughness” in range images. With this, we can as-
sume that independently of the shape of the surfaces
the interpenetration will always occur. It was also ob-
served that two images acquired from the same object
surface using the same scanner position and parame-
ters provide two different range images.
By quantifying interpenetration, one can evaluate
more precisely the registration results and provide a
highly robust control (Silva et al., 2005a). To do
this it was developed the following measure based on
the surface normal vector, computed by a local least
squares planar fit, at each point. After the alignment
of two images, A and B, it is identified the set of in-
terpenetrating points in A with respect to B. For each
point p ∈ A it is defined a neighborhoodN
p
as a small
n× n window centered on p. With q denoting a point
in the neighborhood N
p
, c the corresponding point of
p in image B and~n
c
the local surface normal at c, the
VISAPP 2008 - International Conference on Computer Vision Theory and Applications
68
set of interpenetrating points is defined as:
C
(A,B)
= {p ∈ A | [(
−−−→
q
i
− c)·~n
c
][(
−−−→
q
j
− c)·~n
c
] < 0} (1)
where q
i
,q
j
∈ N
p
and i 6= j. This set comprises those
points in A whose neighborhoods include at least one
pair of points separated by the local tangent plane,
computed at their correspondents in B, as can be seen
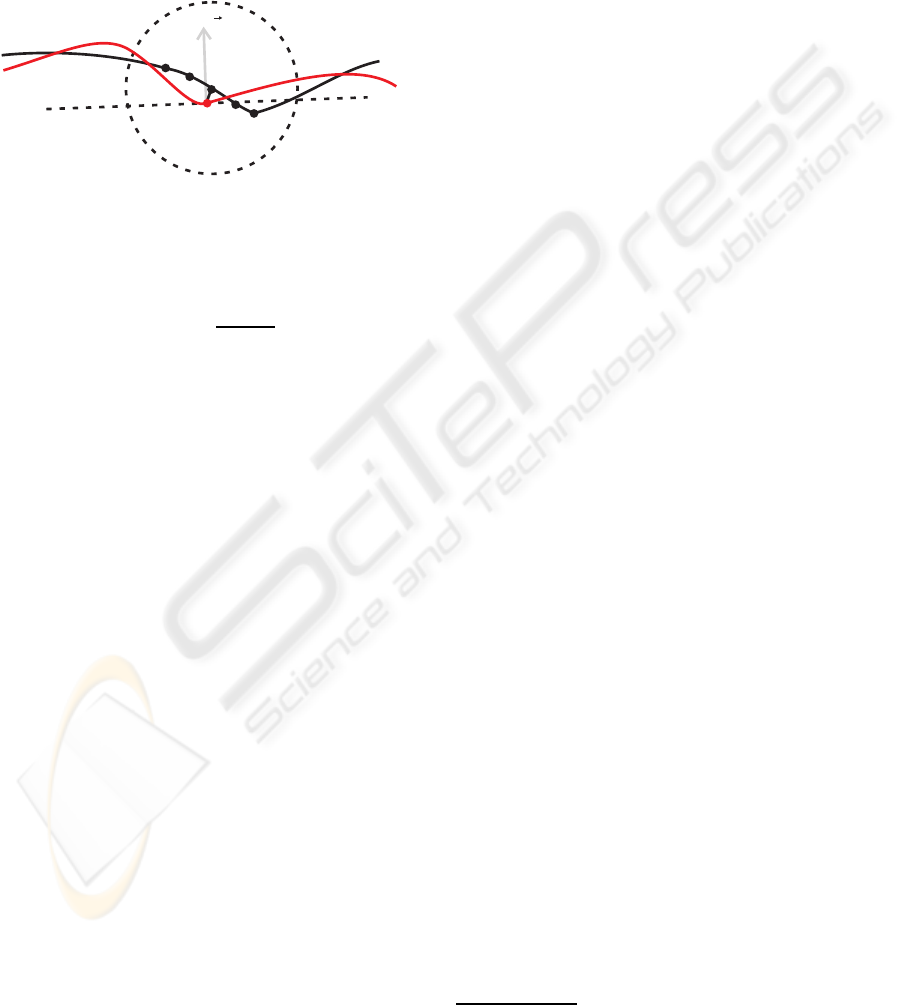
in the diagram of Figure 1.
A
B
N
p
q
i
q
j
p
c
n
c
Figure 1: Interpenetrating point p in A with respect to B.
With this, the SIM is defined as the fraction of in-
terpenetrating points in A:
SIM
(A,B)
=
|C
(A,B)
|
|A|
(2)
In this paper some constraints were applied to the
SIM as suggested in (Silva et al., 2005b) to avoid in-
correct corresponding points, and to obtain more pre-
cise alignments. It was included the constraint m = 5
as the maximum angle allowed between the normal
vectors at c and p, ~n
c
and ~n
p
, respectively. Then,
we have p ∈ C only if cos
−1
(~n
c
·~n
p
) ≤ m. Also, it
was used a constraint to eliminate the corresponding
points on the surfaces boundaries. In this case, p ∈ C
if c /∈ D, where D is the set of boundary points in B,
and the thickness of the boundary defined as s = 1;
Registrations of two range images presenting
good interpenetration have high SIM values. The
experimental results show that erroneous alignments
produce low SIM values and that small differences in
MSE can yield significant differences in SIM. Fur-
thermore, alignments with high SIM present a very
low interpoint distance between the two surfaces.
That is, SIM is a far more sensitive indicator of align-
ment quality when comparing “reasonable” align-
ments (Silva et al., 2005a; Bellon et al., 2005).
3.2 SA-Based Registration
SA (Kirkpatrick et al., 1983) is a stochastic algorithm
for local search in which, from an initial candidate so-
lution, it generates iterative movements to a neighbor
solution that represents a better solution to the prob-
lem as compared to the current one. The main dif-
ference between SA and other local search algorithm,
e.g. Hill Climbing, is that SA can accept a worse solu-
tion than the current candidate in the iterative process.
Then, SA does not remain “tied” to local minima and
because of this it has better chances to reach its goal,
which is a solution close enough to the global one.
In order to apply SA on registration of two range
images, six parameters (three parameters each for ro-
tation and translation relative to a 3D coordinate sys-
tem) are needed to define the candidate solutions as
a “transformation vector” that, when applied to one
image, can align it with the other.
Our SA-based approach was developed using the
GSL Library
1
adopting a coarse-to-fine strategy and
has three main stages: (1) pre-alignment; (2) coarse
alignment; (3) fine alignment.
3.2.1 Pre-Alignment
Before starting the registration process, an initial so-
lution is required. Instead of using a random solution
to start our method, we choose the best one among
three pre-alignments, which are: (a) center of mass;
(b) nose tip; (c) bounding box center — to avoid in-
correct nose tip localization due to noise points, this
landmark is defined as the center of the closest 3 × 3
window to the sensor. In order to evaluate the conver-
gence behavior of each pre-alignment, few iterations
of the SA, only 75 based on our experiments, are per-
formed, using the cost function of the coarse align-
ment stage to guide the evaluation process. This eval-
uation is done to find the pre-alignment that has the
fastest convergence. The selected pre-alignment rep-
resents a good starting point for the algorithm, which
can lead to a faster and better convergence.
3.2.2 Coarse Alignment
In this stage the SA-based searching procedure uses
MSAC (Torr and Zisserman, 2000) combined with
MSE of corresponding points between two images as
the cost function to obtain a coarse alignment. The
nearest-neighbor criterion is used to establish cor-
respondence between points of each image — the
search is performed using a KD-tree structure.
Based on a threshold applied on the associated er-
ror of corresponding points — in our case MSE is the
error measure — the MSAC classifies corresponding
points either as inliers or outliers. The error associ-
ated to outliers is a fixed penalty and to the inliers is
the error measure itself, squared. That means, they are
scored on how well they fit the data (Torr and Zisser-
1
GNU Scientific Library - http://www.gnu.org/
software/gsl
HIERARCHICAL EVALUATION MODEL FOR 3D FACE RECOGNITION
69

man, 2000). The MSAC definition is given by Eq. 3.
ρ
2
(e
2
) =
e
2
e
2
< T
2
T
2
e
2
≥ T
2
(3)
where e is the error of corresponding points and T is
the threshold.
By reducing the error associated to the outliers, we
minimize their influence on the registration process
and, therefore, a better alignment can be obtained.
In order to speed up this stage, only 3% of the
valid points are used. Our experiments have shown
that this sampling rate does not risk the coarse align-
ment.
The initial solution of this stage is the best so-
lution found in the iterations performed on the pre-
alignments of the previous stage. The “temperature”
of SA is reduced very slowly and only one itera-
tion is performed for each allowed “temperature” as
suggested by (Lundy and Mees, 1986). This stage
ends when no better solution is found within 350
consecutive iterations of SA, based on our experi-
ments this condition is a compromise between a good
coarse alignment and a small computing time. The
movements to neighbor solutions across each itera-
tion is done by the introduction of small random val-
ues within [−1,1] to each element of the transforma-
tion vector. The initial “temperature” was defined as
t
0
= 0.002. At this “temperature” and using MSAC
as the cost function, approximately 60% of worse so-
lutions are accepted. According to (Rayward-Smith
et al., 1996) it is a criterion that should be met for
the initial “temperature”. The threshold value for
MSAC was empirically defined as T = 0.7, which
represents an inlier boundary distance for the corre-
sponding points between images.
3.2.3 Fine Alignment
In this stage the cost function for the SA-based
searching procedure is the SIM calculated over 9% of
the image valid points. Our experiments, see Fig. 2,
have shown that SIM at this sampling rate, compar-
ing to SIM using all points, presents an average vari-
ation of approximately 2%. Therefore, the increase
of speed compensates the small inaccuracy. We have
used 200 face alignments to produce Fig. 2. For each
alignment it was calculated the relative error of SIM
using sampling rates varying from 1% to 99%, when
compared to SIM using all points.
The initial solution of this stage is the best solu-
tion found on the previous stage. Again, the cool-
ing schedule proposed by (Lundy and Mees, 1986)
was used. In an attempt to move to a better neigh-
bor solution, random values within [−0.0667,0.0667]
are introduced to each element of the transformation
0
2
4
6
8
10
12
14
16
0 10 20 30 40 50 60 70 80 90 100
DifferenceintheSIMvalue(%)
RelativeError
SamplingRate(%)
Figure 2: Relative error of SIM using a sampling rate when
compared to SIM using all points.
vector. These values are smaller than the ones in the
previous stage because a good alignment has already
been achieved and we only want to make minor move-
ments in order to improveit. The initial “temperature”
was defined as t
0
= 0.15, again we have employed the
method suggested by (Rayward-Smith et al., 1996).
This stage ends when the solution is not improved
in 40 consecutive iterations of SA, as in the previ-
ous stage. This condition is a compromise between a
precise alignment and a small computing time.
4 HIERARCHICAL EVALUATION
MODEL AND FACIAL
REGIONS
We have used five facial regions (Fig. 3) in our hier-
archical evaluation model: nose region (NR), ellipti-
cal nose region (NE), circular nose region (NC), eyes
region (ER) and face region (FA). The three nose re-
gions were suggested in (Chang et al., 2006; Chang
et al., 2005) and are described to be relatively insensi-
tive to facial expressions. These three regions are also
important when using only neutral expression faces
because, even if a subject is asked to make a neutral
expression at two different times, the 3D face shape
will still be different by some amount (Chang et al.,
2006).
The hierarchical evaluation model, see Fig. 4, is
used in a verification scenario. This model consists in
analyzing one region only when the matching score of
a previously analyzed one was not sufficient to deter-
mine whether the images belong to the same subject
or not. The classification of the images is based on
two thresholds: (1) a recognition threshold; (2) a re-
jection threshold. If the matching score is higher then
the recognition threshold, the images are assumed to
belong to the same subject (client), however if it is
VISAPP 2008 - International Conference on Computer Vision Theory and Applications
70
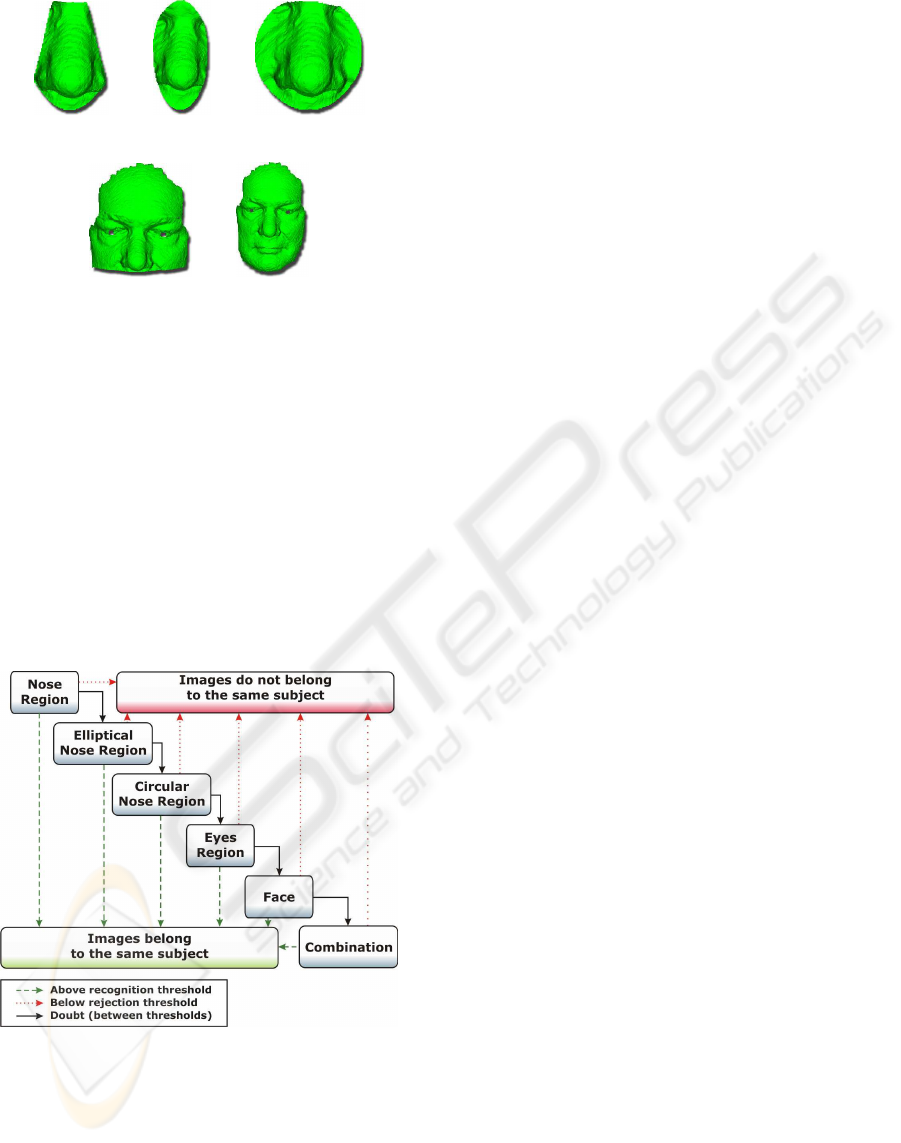
(a) NR (b) NE (c) NC
(d) ER (e) FA
Figure 3: Facial regions used in our evaluation model.
lower than the rejection threshold the images are la-
beled as belonging to different subjects (impostor).
In case the matching score lies between the thresh-
olds, no affirmation can be made and the next region
of the hierarchy is used in another attempt to classify
the images. After obtaining all the matching scores,
the thresholds are automatically defined in a way that
no client score is below the rejection threshold and
no impostor score is above the recognition threshold.
This model has two purposes: (1) achieve high verifi-
cation rates; (2) keep a small execution time.
Figure 4: Proposed Hierarchical Evaluation Model.
Since the regions vary greatly in size, the order in
which they are evaluated plays a very important role
in keeping execution time as small as possible. The
execution goes from the smallest region, NR, to the
largest one, FA. By doing this, the average execution
time of the algorithm tends to be near the time neces-
sary to match the smaller regions. In the last level of
the hierarchy, the combination, which is a weighted
mean of the matching scores of previous levels, is
compared against a single threshold and the pair of
images is classified as client or impostor.
This model increases the verification rate because
sometimes one single region can lead to the correct
result while the combination of all the regions cannot.
This particular situation can happen if one of the im-
ages has hair occlusion, noisy regions or expression.
5 EXPERIMENTAL RESULTS
The experiments were performed using 978 images
from the well-known FRGC v2.0 database (Phillips
et al., 2005). Each image of the database, acquired by
a Minolta Vivid 900/910 series sensor, has 640× 480
pixels and was divided according to the presence of
noise and expression. We have applied our approach
in the group that satisfies two criteria: (1) neutral
or minor expression; (2) little or no noise perturba-
tion from the acquisition process. This group con-
tains 978 images and it was used to establish a base-
line for our approach in a controlled environment.
We matched each image against all others, totalizing
477, 753 combinations (475, 091 from different sub-
jects and 2, 262 from the same subject). Using the
method proposed in (Segundo et al., 2007), each im-
age was automatically segmented into the five used
regions.
Fig. 5 presents five face matching where each im-
age was rendered using different colors to show the
interpenetrating areas. We can observe some partic-
ular cases, as in Fig. 5 (a) where the forehead is par-
tially occluded due to hair, or in Fig. 5 (p) where the
subject was using a bandannathat was not removedby
the segmentation algorithm. However, in both cases,
the SIM value for the alignment was enough for a cor-
rect classification of the images.
By using the hierarchical evaluation model we
have achieved a verification rate of 99.77% at a False
Acceptance Rate (FAR) of 0% which means that in
a verification system, no impostor would be accepted
as a client. Table 1 presents the number of combina-
tions, rejection and recognition thresholds regarding
the execution of our evaluation model for the used
dataset. After the last threshold is applied, only 6
combinations out of 477,753 are misclassified and,
since we are using a FAR of 0%, the 6 combinations
are all false rejection cases. In Fig. 5 (u) – (y) it
is presented one case where the matching score was
not high enough for a correct classification. Fig. 6
shows the variation of FAR and False Rejection Rate
(FRR) according to threshold variations. By analyz-
HIERARCHICAL EVALUATION MODEL FOR 3D FACE RECOGNITION
71
(a) A1 (b) A2 (c) A3 (d) A4 (e) A5
(f) B1 (g) B2 (h) B3 (i) B4 (j) B5
(k) C1 (l) C2 (m) C3 (n) C4 (o) C5
(p) D1 (q) D2 (r) D3 (s) D4 (t) D5
(u) E1 (v) E2 (w) E3 (x) E4 (y) E5
Figure 5: Examples of facial alignments obtained by our registration method: X1 and X2 are raw images from the database;
X3 is the rendered face segmentation of X1; X4 is the rendered face segmentation of X2; X5 is the alignment of X3 and X4;
(e) final SIM value 41.38%; (j) final SIM value 45.34%; (o) final SIM value 47.11%; (t) final SIM value 22.34%; (y) final
SIM value 8.54%.
ing this figure we can see that the overlapping area of
the curves is very small, indicating that the scores of
clients and impostors are rarely mixed up.
Fig. 7 shows the Receiver Operating
Characteristic (ROC) curve, which demonstrates
the trade-off between the FAR and the FRR. We can
see that with such rates, in a verification scenario the
system would have either secure (small FAR) and
convenient (small FRR) behavior. In Figs. 6 (b) and 7
we can see the point at which FAR equals FRR, this
point is called EER and, it is approximately 0.033%
for our approach.
For the assessment of the algorithm in a recogni-
tion scenario, the images were randomly divided into
three sets: one gallery and two probes. The gallery
set contains 256 images, one for each subject in the
VISAPP 2008 - International Conference on Computer Vision Theory and Applications
72
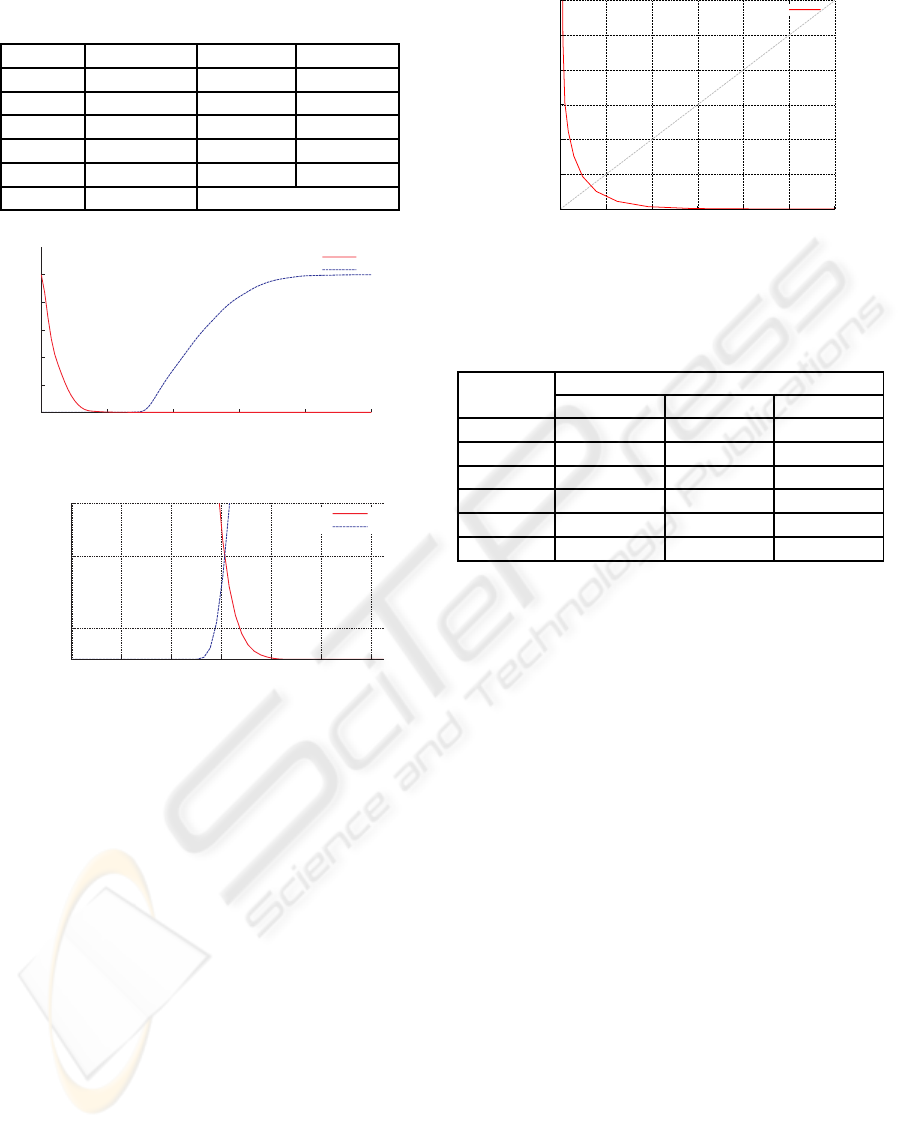
Table 1: Hierarchical evaluation using the five segmenta-
tions and their combination.
Region Nr. Comb. Rejec. T. Recog. T.
NR 477, 753 1.32% 29.60%
NE 427, 505 0.82% 24.43%
NC 412, 398 2.73% 23.31%
ER 253, 642 5.94% 14.10%
FA 11,469 4.48% 10.09%
Comb. 5,102 11.71%
0.0
0.2
0.4
0.6
0.8
1.0
0 20 40 60 80 100
Threshold
FAR
FRR
(a)
0.00010
0.00033
0.00050
0 8 16 24 32 40 48
Threshold
FAR
FRR
(b)
Figure 6: FAR and FRR curves: (a) FAR and FRR curves
for all possible thresholds; (b) approximation of the cross-
ing region.
database, and each probe set contains 361 images. By
combining the results for each region, in the same
way it was done for the verification scenario, we have
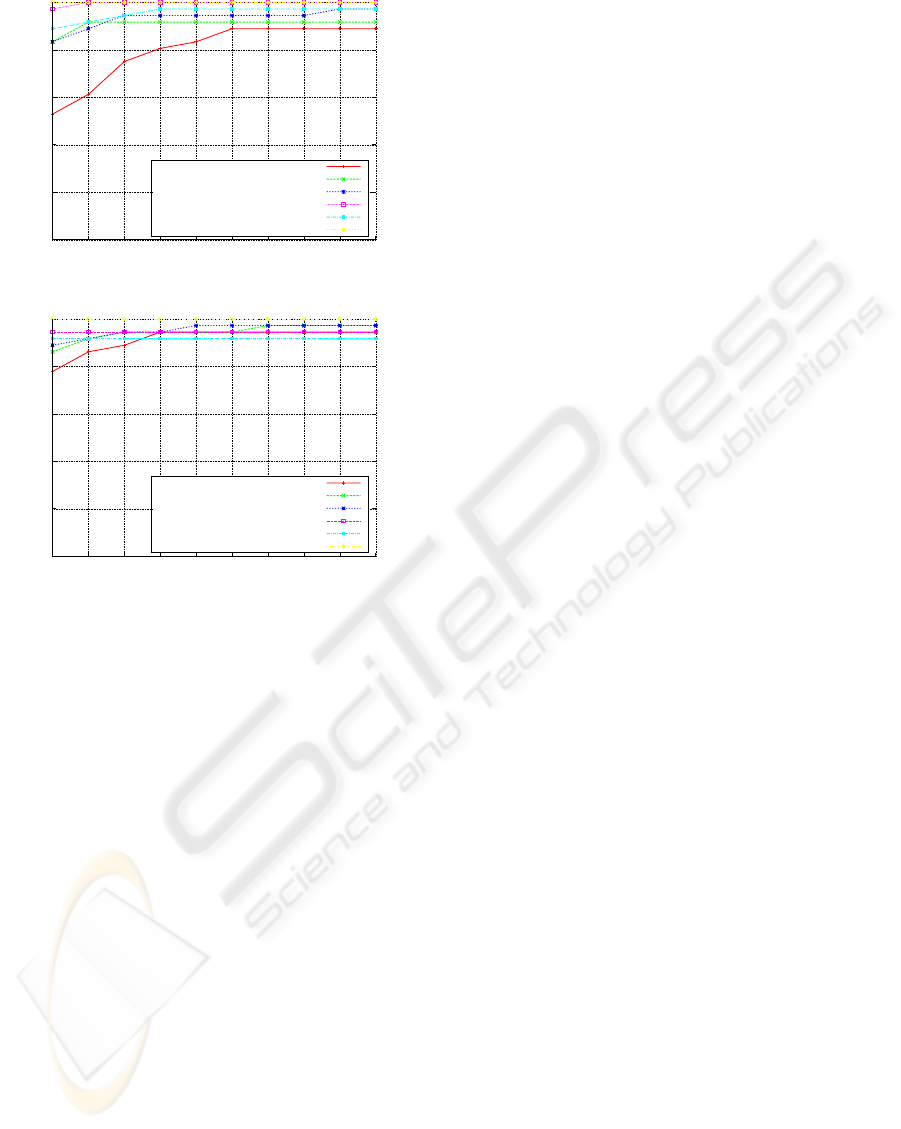
reached a rank-one recognition rate of 100%. The
rank-one recognition rate and the Cumulative Match
Characteristic (CMC) curves for each facial region
and their combination are given in Table 2 and Fig. 8,
respectively.
6 CONCLUSIONS AND FUTURE
WORK
We have presented a robust approach for 3D face
matching based on SA, SIM and a hierarchical eval-
uation model. We propose the use of a precise reg-
0.0000
0.0005
0.0010
0.0015
0.0020
0.0025
0.0030
0.0000 0.0005 0.0010 0.0015 0.0020 0.0025 0.0030
FRR
FAR
ROC
Figure 7: Receiver Operating Characteristic curve.
Table 2: Rank-one recognition rate for each individual re-
gion and their combination.
Region
Rank-One Recognition Rate
Probe 1 Probe 2 Average
NR 95.29% 97.78% 96.53%
NE 98.33% 98.61% 98.47%
NC 98.33% 98.89% 98.61%
ER 99.72% 99.44% 99.58%
FA 98.89% 99.16% 99.03%
Comb. 100.00% 100.00% 100.00%
istration method and the SIM as a matching score to
verify similarity between face regions. The registra-
tion follows a coarse-to-fine strategy, first employing
the MSE constrained by the MSAC as the cost func-
tion of SA and then, the SIM as the cost function in
order to obtain a refined alignment. The adopted eval-
uation model aims to minimize the execution time and
to maximize the verification rate.
The experimental results have shown the effec-
tiveness of our approach for both recognition and
verification scenarios. For the recognition problem,
our approach achieved a rank-one recognition rate of
100%. The rates for the verification scenario are also
very high, 99.77% for the verification rate at a FAR
of 0% and approximately 0.033% for the EER.
As a future work we plan to study the effects of
facial expressions on the proposed approach and, if
necessary, employ techniques that minimize them.
ACKNOWLEDGEMENTS
The authors would like to thank Dr. Jonathon Phillips
and Dr. Patrick Flynn for allowing us to use the
images; and Conselho Nacional de Desenvolvimento
Cient´ıfico e Tecnol´ogico (CNPq) for financial sup-
port.
HIERARCHICAL EVALUATION MODEL FOR 3D FACE RECOGNITION
73
0.90
0.92
0.94
0.96
0.98
1.00
1 2 3 4 5 6 7 8 9 10
Nose Region
Elliptical Nose Region
Circular Nose Region
Eyes Region
Face
Combination
(a) CMC curves for probe 1
0.90
0.92
0.94
0.96
0.98
1.00
1 2 3 4 5 6 7 8 9 10
Nose Region
Elliptical Nose Region
Circular Nose Region
Eyes Region
Face
Combination
(b) CMC curves for probe 2
Figure 8: Cumulative Match Characteristic curves for each
region and their combination: (a) for probe set 1; (b) for
probe set 2.
REFERENCES
Bellon, O. R. P., Silva, L., Queirolo, C., Drovetto, S., and
Pamplona, M. (2006). 3d face image registration for
face matching guided by the surface interpenetration
measure. In ICIP, pages 2661–2664. IEEE.
Bellon, O. R. P., Silva, L., and Queirolo, C. C. (2005). 3D
face matching using the surface interpenetration mea-
sure. In Lecture Notes in Computer Science, volume
3617, pages 1051–1058. Springer-Verlag.
Besl, P. J. and McKay, N. D. (1992). A method for registra-
tion of 3-D shapes. IEEE Trans. Pattern Analysis and
Machine Intelligence, 14(2):239–256.
Chang, K. I., Bowyer, K. W., and Flynn, P. J. (2005). Adap-
tive rigid multi-region selection for handling expres-
sion variation in 3D face recognition. In Proc. of IEEE
Conf. CVPR, volume 3, pages 157–164.
Chang, K. I., Bowyer, K. W., and Flynn, P. J. (2006). Multi-
ple nose region matching for 3d face recognition under
varying facial expression. IEEE Trans. Pattern Anal-
ysis and Machine Intelligence, 28(10):1695–1700.
Chen, Y. and Medioni, G. (1992). Object modelling by reg-
istration of multiple range images. Image Vision Com-
puting, 10(3):145–155.
Gelfand, N., Ikemoto, L., Rusinkiewicz, S., and Levoy, M.
(2003). Geometrically stable sampling for the ICP
algorithm. In Proc. of 4th Intl. Conf. on 3D Digital
Imaging and Modeling, pages 260–267.
Kirkpatrick, S., Gelatt, C. D., and Vecchi, M. P. (1983).
Optimization by simulated annealing. Science,
220(4598):671–680.
Kittler, J., Hatef, M., Duin, R. P. W., and Matas, J. (1998).
On combining classifiers. IEEE Trans. Pattern Analy-
sis and Machine Intelligence, 20(3):226–239.
Lu, X. and Jain, A. K. (2005). Integrating range and texture
information for 3d face recognition. In Proc. of 7th
IEEE Workshop on Applications of Computer Vision,
pages 156–163.
Lu, X., Jain, A. K., and Colbry, D. (2006). Matching 2.5D
face scans to 3D models. IEEE Trans. Pattern Analy-
sis and Machine Intelligence, 28(1):31–43.
Lundy, M. and Mees, A. (1986). Convergence of an anneal-
ing algorithm. Mathematical Programming: Series A
and B, 34(1):111–124.
Phillips, P. J., Flynn, P. J., Scruggs, W. T., Bowyer, K. W.,
Chang, J., Hoffman, K., Marques, J., Min, J., and
Worek, W. J. (2005). Overview of the face recogni-
tion grand challenge. In Proc. of IEEE CVPR, pages
947–954.
Rayward-Smith, V. J., Osman, I. H., Reeves, C. R., and
Smith, G. D. (1996). Modern Heuristic Search Meth-
ods. John Wiley & Sons Ltd.
Rusinkiewicz, S. and Levoy, M. (2001). Efficient variants
of the ICP algorithm. In Proc. of 3rd Intl. Conf. on 3D
Digital Imaging and Modeling, pages 145–152.
Segundo, M. P., Queirolo, C. C., Bellon, O. R. P., and Silva,
L. (2007). Automatic 3d facial segmentation and land-
mark detection. XIV Intl. Conf. on Image Analysis and
Processing, pages 431–436.
Silva, L., Bellon, O. R. P., and Boyer, K. L. (2005a). Pre-
cision range image registration using a robust surface
interpenetration measure and enhanced genetic algo-
rithms. IEEE Trans. Pattern Analysis and Machine
Intelligence, 27:762–776.
Silva, L., Bellon, O. R. P., and Boyer, K. L. (2005b). Ro-
bust Range Image Registration Using Genetic Algo-
rithms and the Surface Interpenetration Measure, vol-
ume 60 of Machine Perception and Artificial Intelli-
gence. World Scientific Publishing.
Torr, P. H. S. and Zisserman, A. (2000). MLESAC: A new
robust estimator with application to estimating image
geometry. CVIU, 78:138–156.
VISAPP 2008 - International Conference on Computer Vision Theory and Applications
74
