DRIVING WARNING SYSTEM BASED ON VISUAL
PERCEPTION OF ROAD SIGNS
Juan Pablo Carrasco, Arturo de la Escalera and José María Armingol
Intelligent Systems Lab. Universidad Carlos III de Madrid, c/Butarque 15, 28911 Leganés, Spain
Keywords: Road Sign Detection, Image Processing, Advanced Driver Assistance System, Road Sign Recognition, GPS
Data, Tracking.
Abstract: Advanced Driver Assistance Systems are used to increase the security of vehicles. Computer Vision is one
of the main technologies used for this aim. Lane marks recognition, pedestrian detection, driver drowsiness
or road sign detection and recognition are examples of these systems. The last one is the goal of this paper.
A system that can detect and recognize road signs based on color and shape features is presented in this
article. It will be focused on detection, especially the color space used, investigating on the case of road
signs under shadows. The system, also tracks the road sign once it has been detected. It warns the driver in
case of anomalous speed for the recognized road sign using the information from a GPS.
1 INTRODUCTION
Security in vehicles is one of the areas of research
where industry is investing more money.
Governments are also very aware of the problem
because of monetary and human reasons.
One way to deal with this problem is the
implementation in vehicles of Advanced Driver
Assistance Systems (ADAS), which increase safety
in vehicles in several ways: adaptive cruise control,
automatic parking, and those based on Computer
Vision: pedestrian detection, drowsiness detection,
lane mark detection or road sign detection and
recognition (RSR). In this paper, a RSR system is
presented. It will be able to detect and recognize
yield, danger and prohibition road signs in real
environments, warning the driver in case of
inadequate speed for the recognized road sign. This
will allow the driver to concentrate more on driving
itself, increasing safety.
Detection of road signs is usually based on shape
and colour features. In this case, yield, danger and
prohibition road signs are red bordered, so first, the
goal will be enhancement of the typical red color of
these road signs in the image while filtering the
others, obtaining a greyscale image where only the
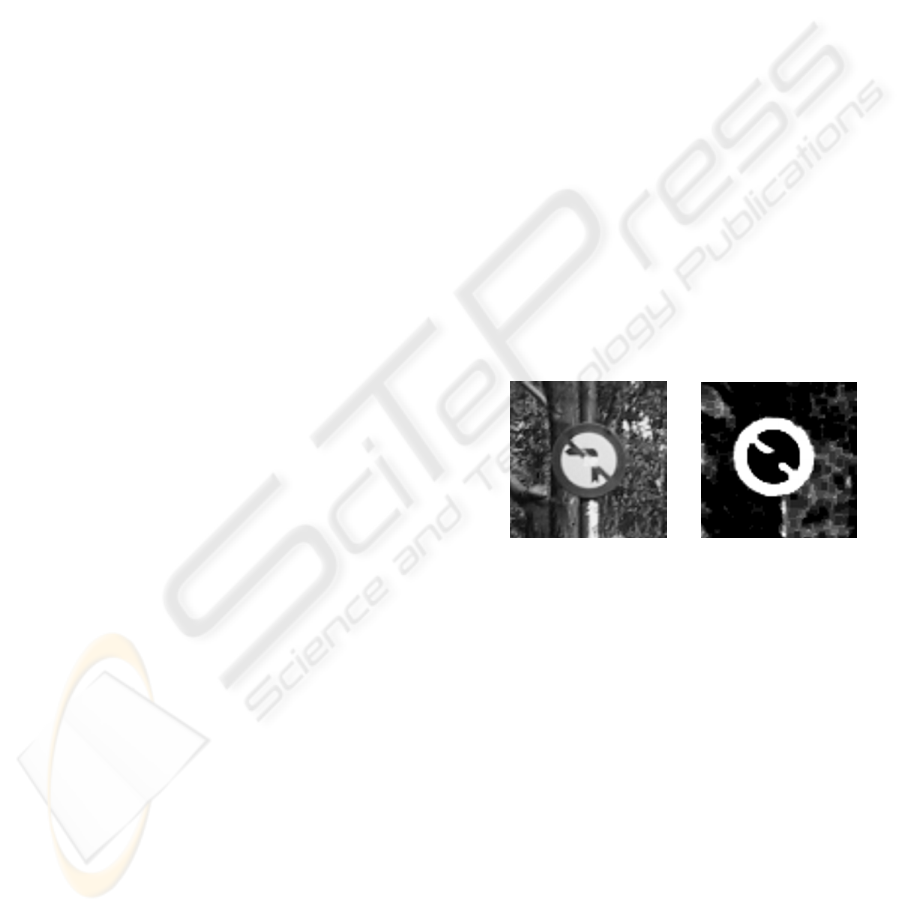
border of the road sign will appear. Fig. 1. Color
information depends on the aging of the road sign,
distance to it, weather conditions, shadows,
occlusions and camera limitations, so it is a difficult
problem to deal with.
Figure 1: Left: RGB image of a road sign. Right: greyscale
image where red pixels belonging to the border have been
enhanced.
Different colour spaces can be used in this aim:
RGB (Bahlmann et al 2005) is easily implemented
but is very dependent of lighting changes. HSI, HSL,
HSV (de la Escalera et al 2004), (Fleyeh 2004),
(Vitabile et al 2004), are very similar and commonly
used since the Hue component does not vary too
much under distance or illumination changes. Some
authors do not find colour segmentation reliable so
prefer to use greyscale since it is invariant to the
illumination changes and shadows (Soetedjo and
Yamada 2005).
Once the road sign is detected, it must be
recognized. In this stage, neural networks (Garcia-
Garrido et al 2006) are used because of their
flexibility, since they can deal with occlusions,
rotations or road sign aging; but they have the
disadvantage of a high computational cost.
54
Pablo Carrasco J., de la Escalera A. and María Armingol J. (2008).
DRIVING WARNING SYSTEM BASED ON VISUAL PERCEPTION OF ROAD SIGNS.
In Proceedings of the Third International Conference on Computer Vision Theory and Applications, pages 54-60
DOI: 10.5220/0001076800540060
Copyright
c
SciTePress
Normalized correlation (de la Escalera et al 2004),
(Betke and Makris 2001) allows fast algorithms
implementation, obtaining high scores in detection
and recognition. The drawback is that it depends too
much on the models used to correlate in the image
and on the image quality.
When the road sign is detected and recognized, it
is a further step to track it. Although it supposes an
increase in time (Maldonado-Bascon et al 2007) it
allows to ensure the recognition since a data base
with the number of recognitions and frames without
(not in every frame the road sign is detected, due to
the problems commented above), allows to store the
state of the road signs recognitions. Kalman Filter
has been the basic tool to perform this task
(Maldonado-Bascon et al 2007) although it needs a
linear model to converge to a good solution.
To provide useful information is one of the most
important goals in the research of ADAS. In this
way, the RSR systems should not only be able to
recognize the different road signs but to filter the
information useful for the driver, for example using
the speed as one important data to limit the warning
messages to the driver.
This paper is organized as follows: section 2
presents the system architecture; section 3 describes
the research in detection; section 4 presents the
recognition stage and in 5 the tracking. Finally,
results will be given in section 6 and conclusions in
7.
2 SYSTEM ARCHITECTURE
The system presented in this paper fulfils the
requirements of an ADAS in order to get a real time
RSR system (Carrasco et al 2007).
It is able to detect, recognize and track red border
road signs. It deals with one of the major problems
in detection: the change in color when the road sign
is under shadows, and a parallel study of the color of
bricks is done in order to avoid them from the
enhanced image. They are usually an error source
due to their color similarity to road signs.
While the recognition application is working,
another module gets information from the GPS to be
used in the tracking stage and in the warning stage
Fig.2. In this last case, if real speed of the vehicle,
obtained from the GPS is inadequate for the
recognized road sign, a message will be sent to the
driver in order to reduce the velocity.
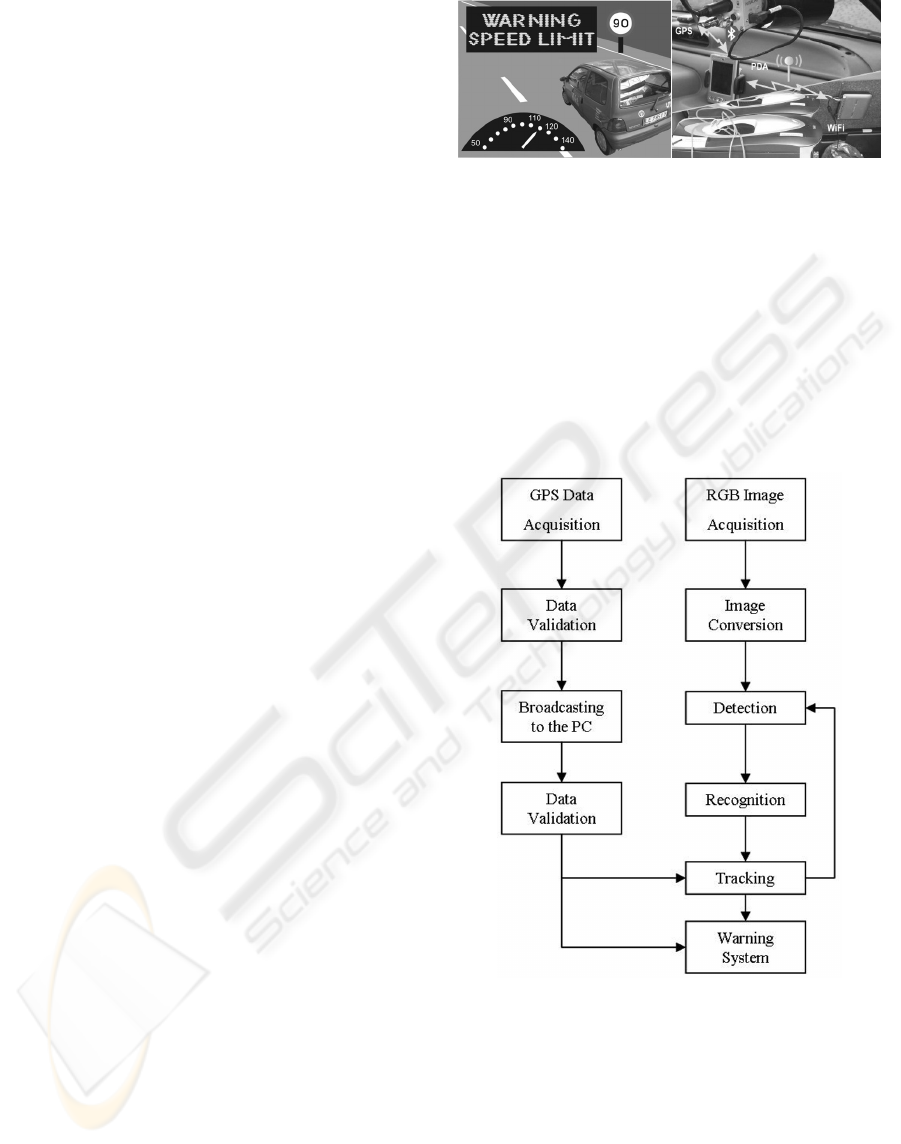
Figure 2: Left: GPS-RSR System. The system compares
speed and road sign and warns the driver when necessary.
Right: GPS Data acquisition module. A GPS device, a
PDA and a PC with Wireless connection.
Fig 3. depicts the flow chart of the applications.
It has two threads: The first one is in charge of
getting data from the GPS. It is stored, validated and
finally broadcasted to the PC. The other thread is the
Computer Vision application. It acquires images,
converts the image to adapt it to the requirements of
the normalized correlation and finally, detects,
recognizes and emits a message if necessary.
Figure 3: Flow chart of the GPS-RSR application. One
thread communicates to the GPS to obtain and send data.
The other is the Computer Vision application.
GPS data acquisition allows obtaining
information that will be used in tracking and
warning stages. The GPS device sends data by
bluetooth connection to a PDA where an algorithm
obtains it, validates it and broadcasts it to the PC
(where the vision application is running) via WiFi.
DRIVING WARNING SYSTEM BASED ON VISUAL PERCEPTION OF ROAD SIGNS
55
GPS data follows the National Marine
Electronics Association (NMEA) (NMEA 2007),
based on several messages that contain different
information. The PDA stores data from the different
messages till there is validated information to form a
string that will be sent to the PC. Validation is based
on the number of satellites available, the information
stored belongs to the same time and all the fields are
filled with no null data. There, data is checked so no
data is lost in the transmission.
From the whole information that can be taken
from the GPS messages, speed, course and time are
the ones used in the tracking stage and speed also in
the warning stage.
3 ROAD SIGN DETECTION
In the detection stage, the system uses normalized
correlation to find the possible road signs. This
technique needs models of the road signs to correlate
in an adequate image Fig. 4. This image is converted
to greyscale through enhancement of the red color of
the road signs to obtain a greyscale image (pure red
is given the value 255=white, and absence of red is
given the value 0=black). On this image, it will be
possible to find the shape of the road sign as seen in
Fig. 1.
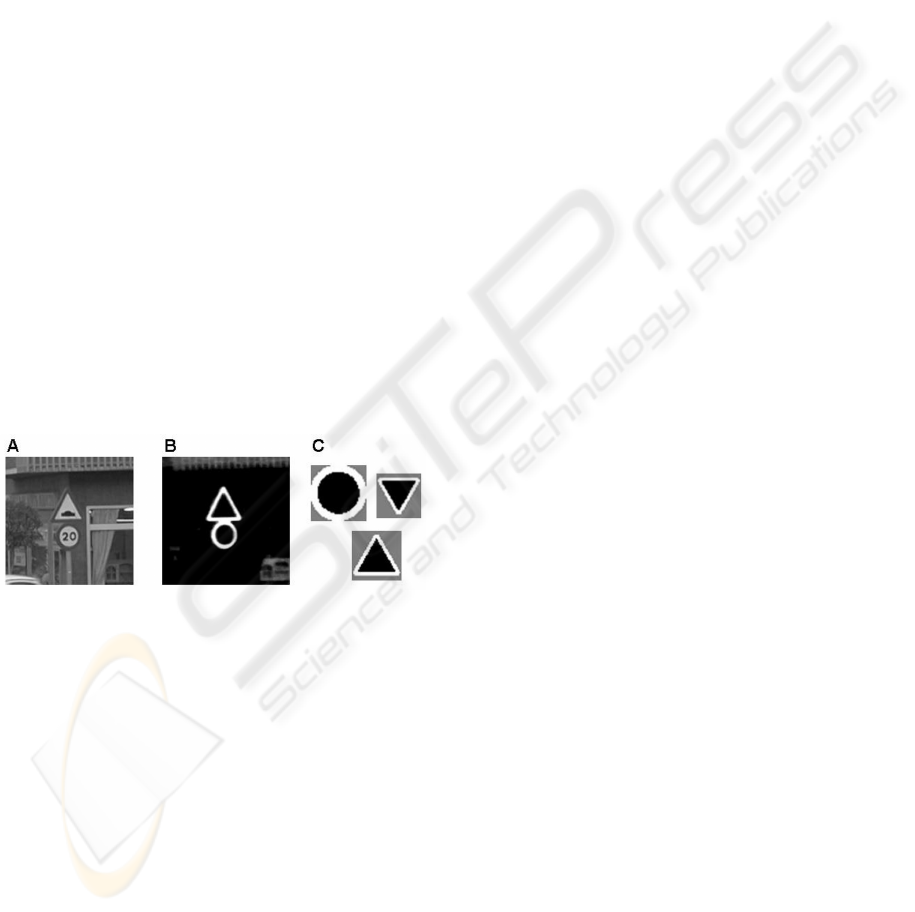
Figure 4: A) RGB image. B) Greyscale image after
enhancement operation. C) Samples of models used in
correlation over iamge B).
Danger, yield and prohibition road signs are red
bordered, but due to aging, weather conditions or
shadows, these borders may be not as red as they
should. A data base of borders under real conditions
has been used to model the behaviour of the color
borders under sun or shadow, and the spectra of
building bricks has been included, to study the
possibility of avoiding them from appearing in the
greyscale image. If in it there are only pixels
belonging to the road signs, it is easier to find them
and no confusion between them and bricks occur.
To achieve this goal, several images containing
road signs have been stored. They have been
separated into two groups: road signs under sun and
under shadow. The reason is that the red color under
shadows changes considerably, enlarging its spectra
to blue and green. So it is better to study sun and
shadow effects separately.
Although this separation is arbitrary in uncertain
cases, it will be proved that does not affect the final
results of the study.
Conversion from RGB to HSL is then applied in
order to decrease the effect of illumination changes
in the road signs. Once they have been converted,
the borders are manually cut off in order to work
only with them. After this operation, for each pixel
of the border, a statistical study of its H and S
component values was performed Fig.5 and 6.
Enhancement is then solved in two ways: using
the information of the components H and S together
and using H and S separately.
The same work was done in the case of bricks,
cutting of walls of red brick buildings in order to
have a considerable data base of them for the
experiments.
In the case of the two components, Hue and
Saturation are used to obtain the probability of a
pixel belonging to a pair (H, S). Fig. 5 shows the
regions where borders under shadows, sun, and the
case of bricks can be found. The experiment has
been done under the premise that every border has to
be found, so low probability H, S cases are also
included. Results for the case of using H separately
from S are in Fig. 6.
It can be seen in the Fig.5 that the regions
overlap covering in part each other, so it is not
possible to use these regions separately to isolate
borders from bricks.
In the case of using H separately from S (Fig. 6),
it can be seen for saturation, that shadows and bricks
have nearly the same behaviour, while the sun gets it
maximum in mid to mid-high saturation values.
Then, it is not possible to separate bricks and
borders only with this condition. Using only hue,
shadows cover the sun region, and for low hue
values the probability of red is very low while the
one related to bricks is very high, so it behaves as a
filter. Therefore, bricks are not going to get high
grey values (255), part of the bricks are going to be
avoided while no shadow or sun borders are going to
be missed.
VISAPP 2008 - International Conference on Computer Vision Theory and Applications
56
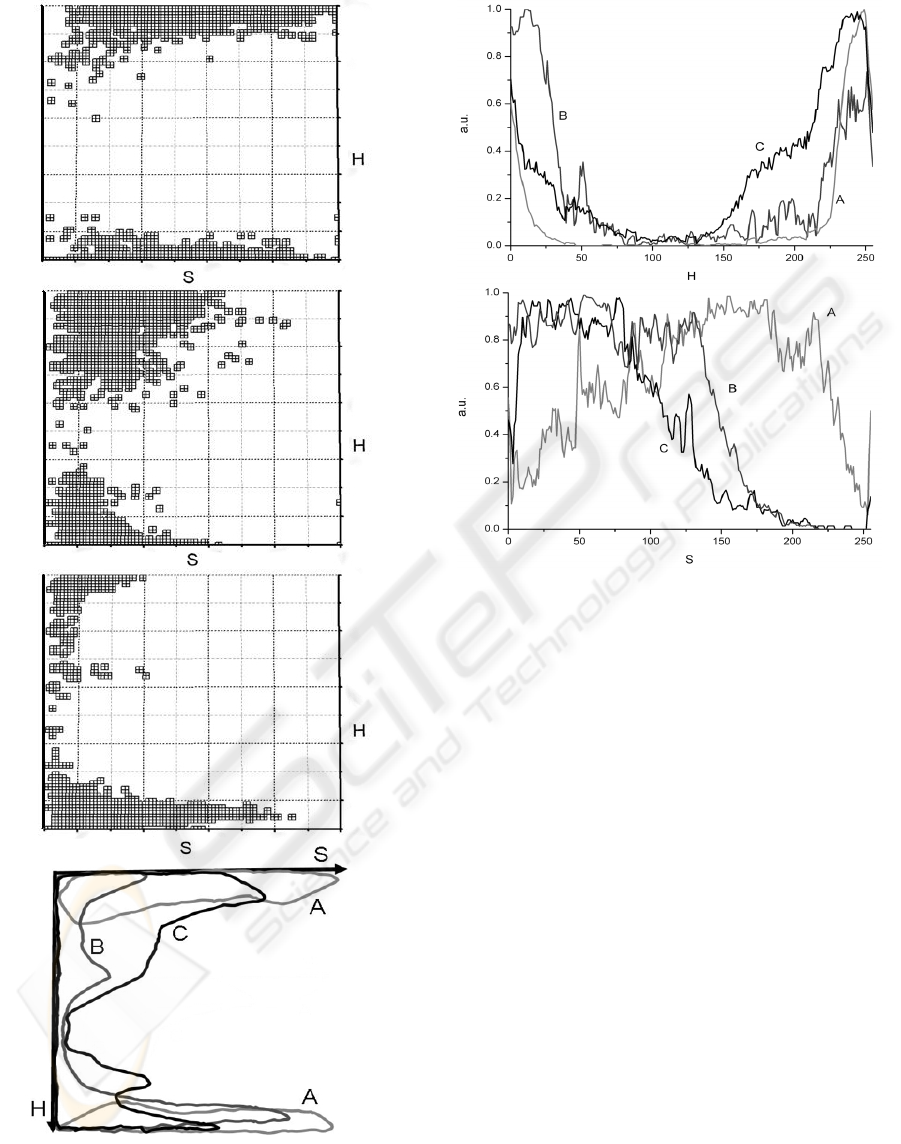
Figure 5: from top to bottom: (H, S) graphs for borders
under sun, borders under shadows and bricks. The last one
depicts the overlapping of the three. Line A stands for sun,
B for bricks and C for shadows.
Figure 6: Hue and Saturation Graphs. Line A corresponds
to borders under sun, B to bricks and C to borders under
shadows.
4 RECOGNITION AND
WARNING SYSTEM
In the recognition stage (Fig. 7), road sign
candidates are converted to grayscale to partly help
avoid illumination changes. After this, a resize
operation is applied to obtain models of the same
size that will be used to correlate over a template
that contains all possible road signs. Each class
(Yield, Danger and Prohibition) has its own road
sign class template in order to reduce the false
recognitions and decrease time of execution.
Normalized correlation is used again and road signs
with a score over a determined threshold will be
considered as positives recognitions. Once the vision
system recognizes a road sign, the warning system
takes the speed given by the GPS and decides
whether it is necessary to send a message to the
driver or not.
The system warns the driver in the following
cases: 1) A speed limit road sign is recognized and
the speed is over the limit. 2) A danger or yield road
sign is recognized and the speed is over a threshold
set by the user. In these cases a written message
DRIVING WARNING SYSTEM BASED ON VISUAL PERCEPTION OF ROAD SIGNS
57
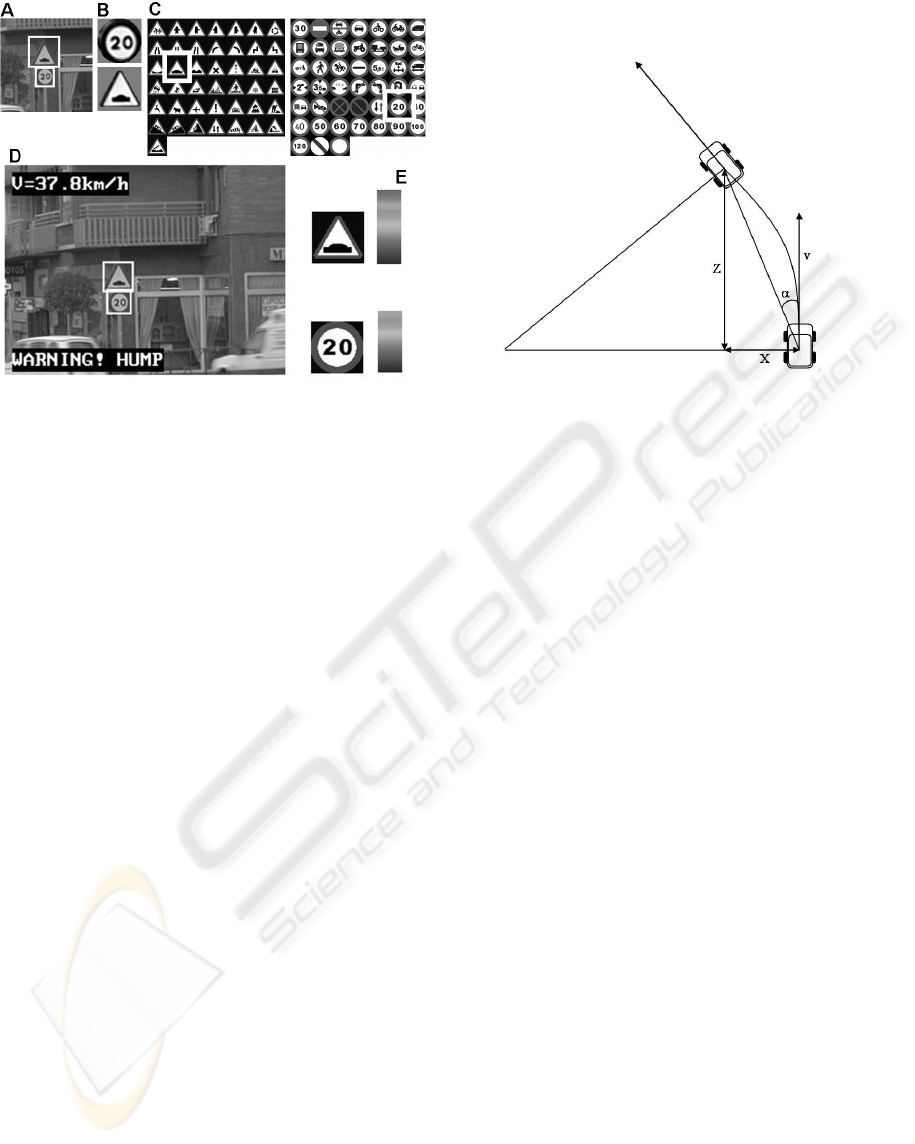
Figure 7: Recognition and Warning Stages. A) Detected
road signs. B) Candidates to road signs. C) Recognition
over the template. D) Output of the RSR system: shows
the road image, the recognized road signs and E) its
reliability level.
appears on the screen and a warning message is
broadcasted by the vehicles’ loudspeakers. A deeper
explanation of these stages can be found in
(Carrasco et al 2007).
5 TRACKING
Tracking is one of the last tasks incorporated to the
recognition systems. It allows prediction of the
position of the road sign frame by frame. This will
be used to assure the positive recognition and avoid
multiple successive warnings to the driver, fact that
could cause disturbance to the driver instead of help.
In this stage, information of the GPS is also used. It
provides data as course, real speed and time that will
be used to predict the position of the next detection
of a previously recognized road sign. Knowing the
size of the real road sign (norma 2000) an estimation
of the next placement of the road sign on the image
can be done. This allows taking into account the
number of recognitions of a road sign, knowing that
it corresponds to a single road sign. It may happen
that in a frame there is no detection; the system
would wait a fixed number of times to consider that
the road sign is not going to appear again. If it
finally appears, it can be taken as the same detection
as before and not as a new one. Fig. 8 depicts the
movement of the vehicle and the magnitudes
involved in the tracking. In the appendix, equations
used for the estimation of the points of the world
location and the screen are presented.
Figure 8: Movement of the vehicle. X stands for the
change of distance in the X axis between two frames, once
a road sign is recognized. Z is the distance covered by the
vehicle between two frames. v is the linear speed given by
the GPS, and α the change in the course angle between
one position and the next.
6 RESULTS
In the detection experiments, ROC curves have been
used (Fig.9) as well as different sequences of images
modelled with the two detection configurations (H,
S) and H. In the two cases the balance between false
positives and true positives is quite good: the area
under the ROC curve for the case of two
components is 0.86 and for Hue-shadows 0.84,
being 1 the ideal value. But in the case of the use of
the single H in the shadow configuration, 9% more
of positive detections is achieved. Better results
could be obtained filtering situations of very low
likelihood since they amplify the spectra of color,
provoking an increase of the enhanced pixels that
with high probability will not belong to an object of
interest.
Through tracking equations, a region of interest
is established allowing useful data to be obtained for
the warning system. The main drawbacks are the
low acquisition data given by the GPS (1 Hz), the
need of a great number of models to correlate in the
image in order to rise accuracy, and the problem of
tracking in curve courses. Fig. 10 depicts a sequence
in which it can be seen that fewer models are needed
in the estimated region, because of the information
predicted.
VISAPP 2008 - International Conference on Computer Vision Theory and Applications
58
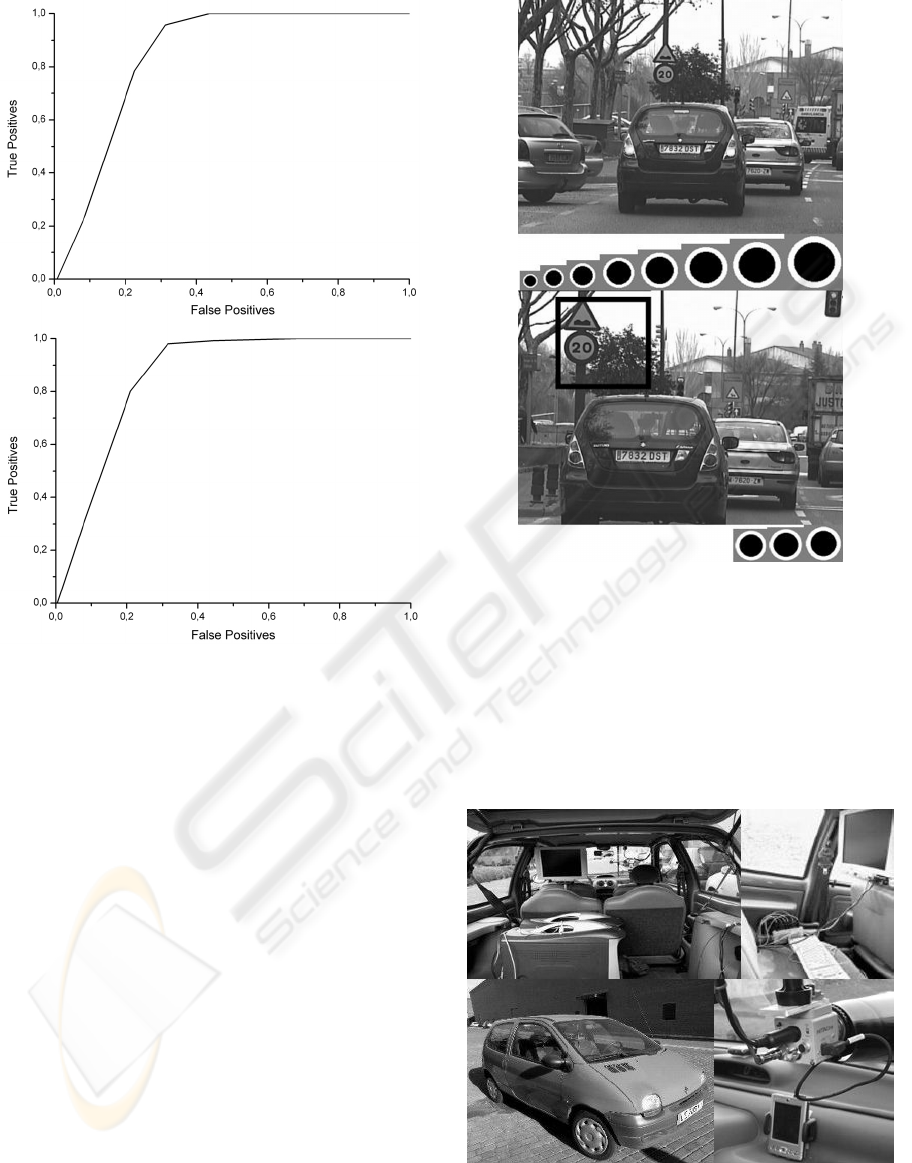
Figure 9: ROC curves for the two components (H, S) and
H for shadows, from top to bottom
.
The warning system gives useful information to
the driver, filtered by the tracking stage, so it fulfils
the requirements of an ADAS, limiting the useful
data to that the driver needs to keeps a safety
driving.
7 CONCLUSIONS
A RSR system has been presented which deals with
the main tasks a system of this kind must fulfil. It
has been shown that a priori it is not necessary to
use two components for red color enhancement. A
first approximation to the tracking of a road sign
through GPS data has been shown. The method uses
information from a GPS to predict the position of a
road sign in subsequent frames after recognition.
This system has been implemented and tested in
the experimental platform IVVI (islab 2007).
Figure 10: Example of tracking. In the first frame all the
model are used. In the second, after prediction, only a few
models in a little region are needed to detect the road sign.
(Intelligent Vehicle based on Visual Information)
(fig. 11). This vehicle allows testing under real
conditions, which validates the results. IVVI is also
equipped with a driver tracking system, lane marks
detection and classification system and a pedestrian
detector system.
Figure 11: From left to right: CPU’s where ADAS
algorithms run. Keyboard and control screen.
Experimental platform IVVI. Color camera, GPS and
PDA.
DRIVING WARNING SYSTEM BASED ON VISUAL PERCEPTION OF ROAD SIGNS
59

ACKNOWLEDGEMENTS
This project is supported by the Spanish
Government through the project TRA2004-07441-
C03-01.
REFERENCES
Bahlmann, C., Zhu, Y., Visvanathan, R., Pellkofer, M.,
Koehler, T., 2005. A system for traffic sign detection,
tracking, and recognition using color, shape, and
motion information. Proceedings of the Intelligent
Vehicles Symposium. 255 – 260.
Betke, M., Makris, N., 2001 Recognition, Resolution, and
Complexity of Objects Subject to Affine
Transformations. International Journal of Computer
Vision. 44(1). 5 – 40.
Carrasco, J.P., de la Escalera, A., Armingol, J.Mª., 2007
Speed supervisor for intelligent vehicles. 11th Int.
Conf. On Computer Aided Systems Theory,
EUROCAST 2007, LNCS 4739, 1175 – 1182.
de la Escalera, A., Armingol, J.M., Pastor, J.M.,
Rodriguez, F.J., 2004. Visual sign information
extraction and identification by deformable models for
intelligent vehicles. , IEEE Transactions on Intelligent
Transportation Systems. Volume 5, Issue 2, 57 – 68
Fleyeh, H.: 2004. Color detection and segmentation for
road and traffic signs. IEEE Conference on
Cybernetics and Intelligent Systems, Volume 2. 809 –
814.
Garcia-Garrido, M.A., Sotelo, M.A., Martin-Gorostiza, E.,
2006. Fast traffic sign detection and recognition under
changing lighting conditions. Proceedings of the IEEE
Intelligent Transportation Systems Conference. 811 –
816.
islab. www.uc3m.es/islab september 2007.
Maldonado-Bascon, S., Lafuente-Arroyo, S., Gil-Jimenez,
P., Gomez-Moreno, H., Lopez-Ferreras, F., 2007.
Road-Sign Detection and Recognition Based on
Support Vector Machines. IEEE Transactions on
Intelligent Transportation Systems, VOL. 5, Issue 2,
264 – 278.
NMEA. www.nmea.org september 2007.
norma 2000. Señalización vertical: Instrucción de
carreteras Norma 8.1-IC. Dirección General de
Carreteras. Ministerio de Fomento.
Soetedjo, A., Yamada, K., 2005. Traffic Sign
Classification Using Ring Partitioned Method. IEICE
Transactions on Fundamentals of Electronics,
Communications and Computer Sciences, VOL. E 88-
A, NO.9 2419 – 2426.
Vitabile, S., Gentile, A., Siniscalchi, S.M., Sorbello, F.,
2004. Efficient Rapid Prototyping of Image and Video
Processing Algorithms. Euromicro Symposium on
Digital System Design. 452 – 458.
APPENDIX
Taking into account the model given in Fig. 6,
equations for tracking based on GPS information are
the following:
RSmo
d
RSfF
Z
w
w
⋅⋅
=
(1)
fF
)x(xZ
X
0iw
w
⋅
−
=
(2)
w
0iw
w
C
fF
)y(yZ
Y +
⋅
−
=
(3)
Where Z
w
, X
w
and Y
w
are the usual coordinates
of the world in the euclidean space for the real road
sign. F is the factor conversion px-mm of the CCD; f
is the focal length, RS
w
the size of the real road sign,
RSmod the size of the road sign on the screen, x
i
and
y
i
coordinates of the screen; x
0
and y
0
the center
points of the screen and C
w
the height of the camera
from the ground.
Once α, differential course angle; v, speed and t,
lapse between two frames are obtained, it can be
calculated:
)sin(2
2α
vt
d
z
α
=
(4)
))cos(2-(1
2α
vt
d
x
α
=
(5)
Therefore, estimation is:
zwe
dZZ
−
=
(6)
xwe
dXX
−
=
(7)
Where the sign of d
x
will depend on the course of
the vehicle. Y
e
is not estimated now since it is
supposed to be a constant independent of distance or
vehicle movement under the assumption of flat
ground condition and movement by the y axis is
negligible.
VISAPP 2008 - International Conference on Computer Vision Theory and Applications
60
