
EFFECT OF FACIAL EXPRESSIONS ON FEATURE-BASED
LANDMARK LOCALIZATION IN STATIC GREY SCALE
IMAGES
Yulia Gizatdinova and Veikko Surakka
Research Group for Emotions, Sociality, and Computing, Tampere Unit for Computer-Human Interaction (TAUCHI)
University of Tampere, Kanslerinnrinne 1, 33014, Tampere, Finland
Keywords: Image processing and computer vision, segmentation, edge detection, facial landmark localization, facial
expressions, action units.
Abstract: The present aim was to examine the effect of facial expressions on the feature-based landmark localization
in static grey scale images. In the method, local oriented edges were extracted and edge maps of the image
were constructed at two levels of resolution. Regions of connected edges represented landmark candidates
and were further verified by matching against the edge orientation model. The method was tested on a large
database of expressive faces coded in terms of action units. Action units described single and conjoint facial
muscle activations in upper and lower face. As results demonstrated, eye regions were located with high
rates in both neutral and expressive datasets. Nose and mouth localization was more attenuated by variations
in facial expressions. The present results specified some of the critical facial behaviours that should be taken
into consideration while improving automatic landmark detectors which rely on the low-level edge and
intensity information.
1 INTRODUCTION
Facial expressions result from contractions and/or
relaxations of facial muscles. These non-rigid facial
movements result in considerable changes of facial
landmark shapes and their location on the face,
presence/absence of teeth, out-of-plan changes
(showing the tongue), and self-occlusions (bitted
lips). The best known and most commonly referred
linguistic description of facial expressions is the
Facial Action Coding System (FACS) (Ekman and
Friesen, 1978; Ekman,
Friesen, and Hager, 2002).
The FACS codes an expressive face in terms of
action units (AUs). The numerical AU code
describes single and conjoint facial muscle
activations. It is anatomically-based and therefore
represents facial expressions as a result of muscle
activity without referring to emotional or otherwise
cognitive state of a person on the image.
It was suggested that structural changes in the
regions of facial landmarks (eyebrows, eyes, nose,
and mouth) are important and in many cases
sufficient for AU recognition. In automatic AU
recognition, manual preprocessing is typically
needed to select a set of fiducial points (for example,
eye centres and mouth corners) in static image or
initial frame of the video sequence. Fiducial points
are further used to track changes in the face resulted
from its expressive behaviour or to align an input
image with a standard face model. Currently, there is
a need for a system that can automatically locate
facial landmarks in the image prior to the following
steps of the automatic facial expression analysis.
In static facial image, there is no temporal
information on facial movements available. Facial
landmark localization in this case is generally
addressed by modelling a local texture in the regions
of landmarks and by modelling a spatial
arrangement of the found landmark candidates
(Hjelmas and Low, 2001; Pantic and Rothkrantz,
2000; Yang, Kriegman, and Ahuaja, 2002). The
main challenge is to find a representation of the
landmarks that efficiently characterizes a face and
remains robust with respect to facial deformations
brought about by facial expressions.
Addressing the problem of expression invariant
localization of facial landmarks in static grey scale
images, the feature-based method was introduced
(Gizatdinova and Surakka, 2006). In the method,
259
Gizatdinova Y. and Surakka V. (2008).
EFFECT OF FACIAL EXPRESSIONS ON FEATURE-BASED LANDMARK LOCALIZATION IN STATIC GREY SCALE IMAGES.
In Proceedings of the Third International Conference on Computer Vision Theory and Applications, pages 259-266
DOI: 10.5220/0001072602590266
Copyright
c
SciTePress

edge representation of the face was taken at ten edge
orientations and two resolution levels to locate
regions of eyes (including eyebrows), lower nose,
and mouth. The resulted edge map of the image
consisted of regions of connected local oriented
edges presumed to contain facial landmarks. To
verify the existence of a landmark on the image, the
extracted landmark candidates were matched against
the edge orientation model. Figure 1 illustrates the
main steps of the method. The description of edge
detection, edge grouping, and edge orientation
matching steps is given in more detail in Appendixes
A and B.
A degradation in the landmark localization rates
was reported for expressive dataset as compared to
neutral dataset. The further analysis (Guizatdinova
and Surakka, 2005) suggested that there were certain
AUs which significantly deteriorated the
performance of the method. It was assumed that
AUs activated during happiness (AU12), disgust
(AU 9 and 10), and sadness (AU 1 and 4) would be
such central AUs. Having such a ground, the main
motivation for the present study was the fact that
although a degradation in the landmark localization
rates due to expression variations is generally
appreciated in the computer vision society; however,
a little attempt has been done to analyze what
muscle activations cause the degradation. To
estimate more accurately what facial muscular
activity affects the feature-based landmark
localization, a more detailed study was needed.
The present aim was to evaluate the developed
method on a larger AU-coded database of expressive
images and investigate the impact of single AUs and
AU combinations on the facial landmark localization
in static facial images.
2 DATABASE
The Cohn-Kanade AU-Coded Facial Expression
Database (Kanade, Cohn, and Tian, 2000) was used
to test the method. The database consists of image
sequences taken from 97 subjects of both gender
(65% female) with ages varying from 18 to 30 years.
The database represents subjects with different
ethnic background (81% Caucasian, 13% African-
American, and 6% Asian or Latino). There were no
images with eye glasses and strong facial hair.
Each image sequence starts with a neutral face
that gradually transforms to an expressive one.
Expressions from different sequences can differ in
levels of intensity. Expressive images are labelled in
terms of AUs, and AUs occur both alone and in
combinations. The AU descriptors taken from the
FACS manual (Ekman,
Friesen, and Hager, 2002)
are as follows. Upper face AUs: 1 - inner eyebrow
raiser, 2 - outer eyebrow raiser, 4 - eyebrow lowerer,
5 - upper lid raiser, 6 - cheek raiser and lid
compressor, 7 - lid tightener, 43 - eye closure, and
45 - blink. Lower face AUs: 9 - nose wrinkler, 10 -
upper lip raiser, 11 - chin raiser, 12 - lip corner
depressor, 14 - lips part, 15 - jaw drop, 16 - mouth
stretch, 17 - lower lip depressor, 18 - lip pucker, 20 -
lip tightener, 23 - lip presser, 24 - nasolabial furrow
deepener, 25 - lip corner puller, 26 - lip stretcher,
and 27 – dimpler.
From each image sequence, the first and the last
frames were selected which corresponded to neutral
and expressive faces, respectively. A total of 468
neutral and 468 expressive images were selected. All
images were scaled to approximately 300 by 230
pixel arrays. No face alignment was performed.
Image indexes were masked by white boxes.
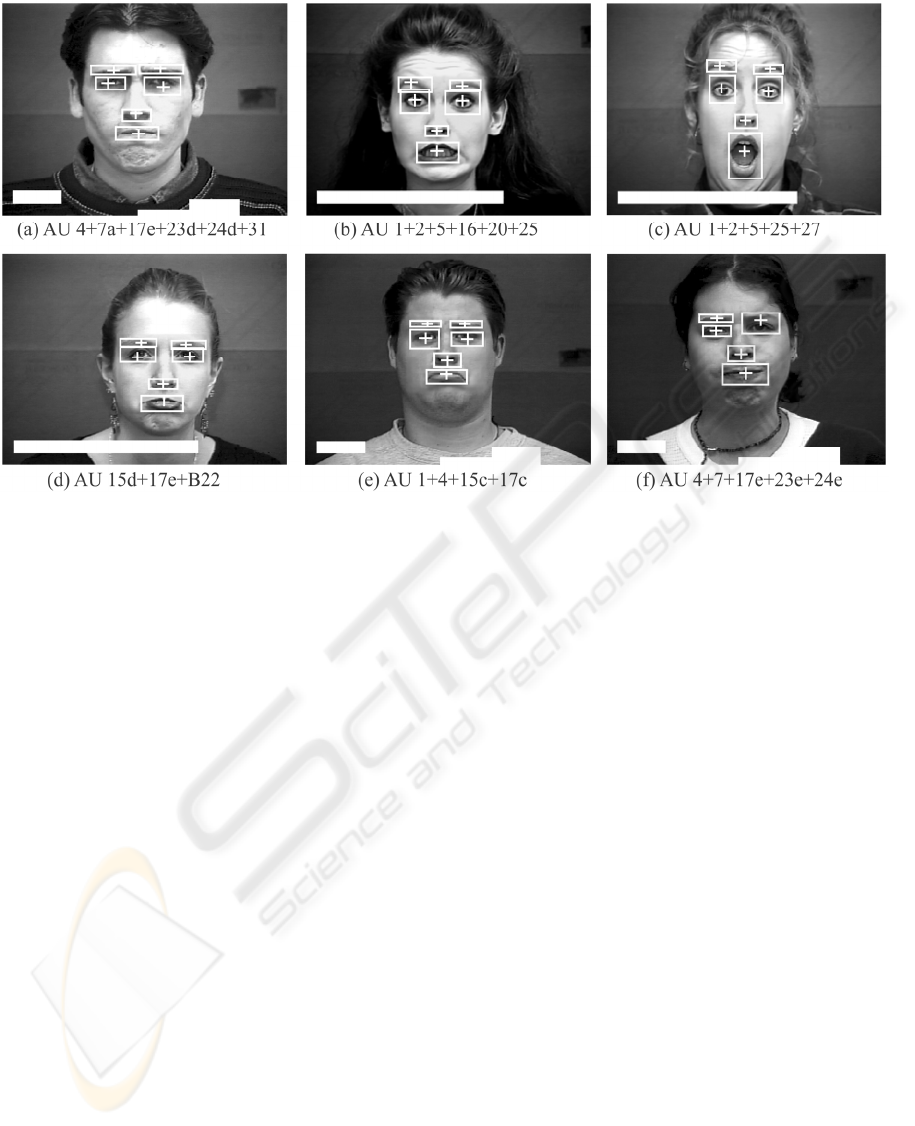
Figure 1: Facial landmark localization: (a) original image, (b) parts of the image located as regions of connected edges; (c)
landmark candidates; (d) final localization result after edge orientation matching. Bounding boxes indicate locations an
d
crosses define mass centres of the found regions. Image indexes are masked by white boxes. Images are courtesy of the
Cohn-Kanade AU-Coded Facial Expression Database (Kanade, Cohn, and Tian, 2000). Reprinted with permission.
VISAPP 2008 - International Conference on Computer Vision Theory and Applications
260
3 LANDMARK LOCALIZATION
All the localization results were checked manually
and classified into one of the following groups:
correct, wrong, and false localization. Different from
systems in which a point defines the localization
result, in this study the localization result was
defined as a rectangular bounding box placed over
the located region. The mass centre of the located
region indicated an estimate of the centre of the
landmark.
A correct landmark localization was considered
if the bounding box overlapped approximately more
than a half of the visible landmark and enclosed the
area surrounding a landmark less than the actual area
of the landmark (Figure 2). Eye localization was
counted correct if the bounding box included both
eye and eyebrow, or eye and eyebrow were located
separately. In case if eyebrow was located as a
separate region, it was obligatory that a
corresponding eye was also found.
A wrong landmark localization was considered
if the bounding box covered several neighbouring
facial landmarks. Wrong landmark localization was
observed in 0.54 cases per image. For this type of
localization error, the failure in nose and mouth
localization was mainly due to the effect of lower
face AUs 9, 10 and 12. These AUs, occurring alone
or in combinations, produced the erroneous grouping
of nose and mouth into one region. AUs 4, 6, 7, and
their combinations with other AUs sometimes
caused the merging of the eye regions.
A false landmark localization was considered if
the bounding box included some non-landmark
regions as, for example, elements of clothing, hair or
face parts like wrinkles, shadows, ears, and
eyebrows located without a corresponding eye. The
procedure of orientation matching reduced the
average number of candidates per image into almost
a half for neutral (from 6.57 to 3.49) and expressive
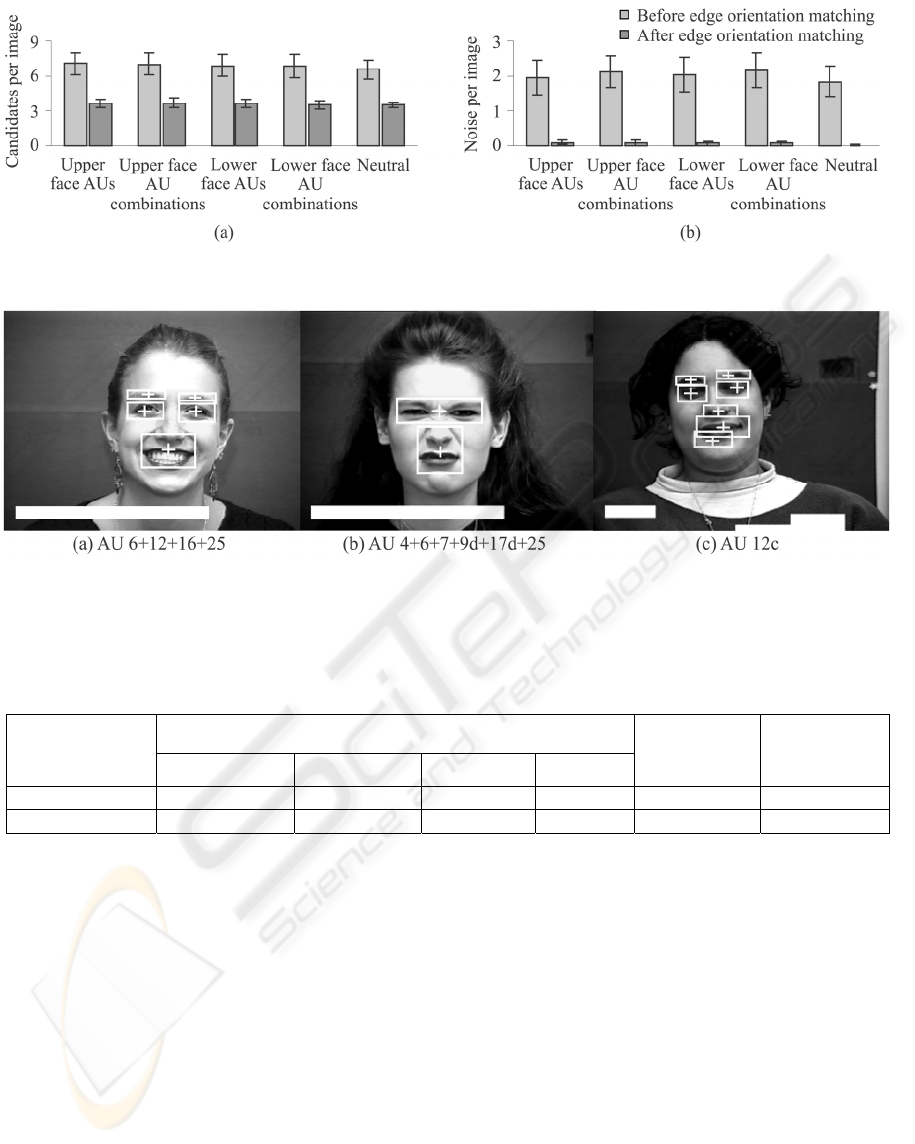
(from 6.97 to 3.60) images, see Figure 3,a.
Accordingly, the average number of false
localizations per image was reduced from 1.84 to
0.01 for neutral and from 2.07 to 0.08 expressive
images, see Figure 3,b. Figure 4 shows some
examples of the localization errors.
Table 1 summarizes the performance of the method.
For each landmark, a rate of its localization was
defined as a ratio between the total number of
correctly located landmarks and the total number of
images used in testing (as there was one landmark
per image). A false positive was defined as a number
of false localizations.
Figure 2: Examples of correctly located facial landmarks. Bounding boxes indicate locations and crosses define mass
centres of the found regions. Image indexes are masked by white boxes. Images are courtesy of the Cohn-Kanade AU-
Coded Facial Expression Database (Kanade, Cohn, and Tian, 2000). Reprinted with permission.
EFFECT OF FACIAL EXPRESSIONS ON FEATURE-BASED LANDMARK LOCALIZATION IN STATIC GREY
SCALE IMAGES
261
The method achieved average localization rate
of 84% in finding all facial landmarks. On the
whole, localization rates were better for neutral than
for expressive images. Thus, eye regions were
located with high rates in both neutral and
expressive datasets. However, nose and mouth
localization rates were considerably better for
neutral than for expressive images. In the next
sections, the effect of single AUs and AU
combinations on the landmark localization rates will
be considered.
3.1 Effect of Facial Expressions on
Landmark Localization Rates
The results of the previous section demonstrated the
degradation of the landmark localization rates in
case of expressive dataset. The same results can be
interpreted in a way that specifies what facial
behaviours caused the degradation. At this point we
aimed to analyze the effect of upper and lower face
AUs on the landmark localization rates. To do that
the localization results were classified systematically
using the following approach. The results were
combined into four AU groups according to AUs
presented in the test image, see Table 2. Thus, if
image label included single AU, the localization
result was classified into group I or II. If image label
included a combination of two AUs, the localization
result was classified into group III or IV. AU43 (eye
closure) and AU45 (blink) were combined together
because they both have the same visual effect on the
facial appearance and different durations of these
AUs can not be measured from the static images.
Figure 3: Average number of landmark candidates per image before and after the procedure of orientation matching. The
error bars show plus/minus one standard deviation from the mean values.
Figure 4: Examples of errors in facial landmark localization: (a) nose and mouth wrong localization; (b) eye region wrong
localization and nose and mouth wrong localization; (c) false localization. Bounding boxes indicate locations and crosses
define mass centres of the found regions. Image indexes are masked by white boxes. Images are courtesy of the Cohn-
Kanade AU-Coded Facial Expression Database (Kanade, Cohn, and Tian, 2000). Reprinted with permission.
Table 1: Performance of the method on neutral and expressive datasets.
Dataset
Rates of landmark localization
Total False positive
R eye region L eye region Nose Mouth
Neutral
98% 99% 93% 91%
95% 9
Expressive
93% 93% 55% 55%
74% 55
VISAPP 2008 - International Conference on Computer Vision Theory and Applications
262

Due to the fact that some AUs were not presented in
the database or the number of images was too few
(less than 6), only a limited number of AUs and AU
combinations was used. The classification allowed
the results to belong to more than one group. On the
next step, average landmark localization rates were
calculated for each AU subgroup. Tables 3 and 4
illustrate the effect of chosen AU groups on the
landmark localization rates. In the tables, AUs and
AU combinations were defined as having no or
slight effect if average localization rates were in the
range of 90-100%, as medium if localization rates
were in the range of 80-89%, and strong if
localization rates were below 79%. Table 3
demonstrates that eye region localization was
consistently good in the context of the presented AU
groups. Among all the facial behaviours, upper face
AU9 and AU combinations 4+6, 9+25, and 10+17
had the most deteriorating effect on the eye region
localization. Lower face AU 9 and AU combinations
4+6, 9+17, 12+20, 12+16 had the most deteriorating
effect on the nose and mouth localization in Table 4.
In the tables, bold font defines AUs and AU
combinations which had the strongest effect on both
upper and lower face landmark localization.
4 DISCUSSION
The effect of facial expressions on the feature-based
localization of facial landmarks in static facial
images was evaluated. In this section, the impact of
upper and lower face AUs and AU combinations on
the landmark localization rates will be analyzed and
discussed.
4.1 Effect of Upper Face AUs on Eye
Region Localization Rates
On the average, the results demonstrated that eye
region localization was robust in some extent with
Table 2: AU groups for analysis of the effect of upper and lower face AUs on the method performance.
AU groups AU subgroups
I. Upper face AUs 1, 2, 4, 5, 6, 7, 43&45
II. Lower face AUs 9, 10, 11, 12, 14, 15, 16, 17, 18, 20, 23, 24, 25, 26, 27
III. Upper face AU combinations 1+2, 1+4, 1+5, 1+6, 1+7, 2+4, 2+5,4+5, 4+6, 4+7, 4+45, 6+7
IV. Lower face AU combinations
9+17, 9+23, 9+25, 10+17, 10+20, 10+25 11+20, 11+25, 12+16, 12+20,
12+25, 15+17, 15+24, 16+20, 16+25, 17+23, 17+24, 17+25, 18+23, 20+25,
23+24, 25+26
Table 3: Effect of upper and lower face AUs and AU combinations on the eye region localization rates.
Effect
I. Upper
face AUs
II. Lower face
AUs
III. Upper face AU
combinations
IV. Lower face AU combinations
No or
Slight
1, 2, 5
11, 12, 14, 15, 16,
20, 25, 26, 27
1+2, 1+4, 1+5, 1+6,
1+7, 2+4, 2+5, 4+5
10+20, 10+25, 11+20, 11+25, 12+16, 12+20,
12+25, 15+17, 15+24, 20+25, 25+26, 25+27
Medium
4, 6,
43&45
17, 18, 23, 24 - 9+23, 16+20, 16+25, 17+24, 17+25, 18+23
Strong 7 9, 10, 4+6, 4+7, 4+45, 6+7 9+17, 9+25, 10+17, 17+23, 23+24
Table 4: Effect of upper and lower face AUs and AU combinations on the nose and mouth localization rates.
Effect
I. Upper
face AUs
II. Lower face
AUs
III. Upper face AU
combinations
IV. Lower face AU combinations
No or
Slight
- - - -
Medium 2m 27
(1+2)m, (1+5)m,
(2+5)m
15+24, 25+27
Strong
1, 2n, 4, 5,
6, 7,
43&45
9, 10, 11, 12, 14,
15, 16, 17, 18, 20,
23, 24, 25, 26
(1+2)n, 1+4, (1+5)n,
1+6, 1+7, 2+4,
(2+5)n, 4+5, 4+6,
4+7, 4+45, 6+7
9+17, 9+23, 9+25, 10+17, 10+20, 10+25,
11+20, 11+25, 12+16, 12+20, 12+25, 15+17,
16+20, 16+25, 17+23, 17+24, 17+25, 18+23,
20+25, 23+24, 25+26
Note: Letters n and m indicate different localization results for nose and mouth localization.
EFFECT OF FACIAL EXPRESSIONS ON FEATURE-BASED LANDMARK LOCALIZATION IN STATIC GREY
SCALE IMAGES
263

respect to facial expressions. Thus, upper face AUs
(1, 2 and 5) and AU combinations (1+2, 1+4, 1+5,
1+6, 1+7, 2+4, 2+5, 4+5) which result in raising of
eyebrows and widening of eyelids had a slight or no
effect on the eye region localization. The
degradation in the eye region localization rates was
mainly caused by activation of upper face AUs (4, 6,
7, and 43/45) and AU combinations (4+6, 4+7,
4+45, and 6+7) which typically narrow down a
space between the eyelids and/or cause the eyebrows
to draw down together. These facial behaviours were
the main reasons for wrong eye region localization
error.
Recently, studies on the feature-based AU
recognition, which performance depends on the
features used, reported similar results. In (Lien,
Kanade, Cohn, and Li, 2000), first-order derivative
filters of different orientations (horizontal, vertical,
and diagonal) were utilized to detect transient facial
features (wrinkles and furrows) for the purpose of
AU recognition. They reported AU recognition rate
of 86% for AU 1+2, 80% for AU1+4, and 96% for
AU4. In (Tian, Kanade, and Cohn,
2002), the
authors reported a decrease in performance of the
feature-based AU recognition for nearly all the same
AUs (AU 4, 5, 6, 7, 41, 43, 45, and 46) which
created difficulties in landmark localization in the
present study. Among all the upper face AUs, they
found AUs 5, 6, 7, 41, and 43 as the most difficult to
process with feature-based AU recognition method.
4.2 Effect of Lower Face AUs on Nose
and Mouth Localization Rates
The results demonstrated that nose and mouth
localization was significantly affected by facial
expressions in both upper and lower face. As it was
suggested in (Guizatdinova and Surakka, 2005),
AUs 9, 10, 11, and 12 were found to cause a poor
localization performance of the method.
There are certain changes in the face when the
listed AUs are activated. In particular, when AU12
is activated, it pulls the lips back and obliquely
upwards. Further, the activation of AUs 9 and 10 lift
the centre of the upper lip upwards making the shape
of the mouth resemble an upside down curve. AUs
9, 10, 11, and 12 all result in deepening of the
nasolabial furrow and pulling it laterally upwards.
Although, there are marked differences in the shape
of the nasolabial deepening and mouth shaping for
these AUs, it can be summed up that these AUs
generally make the gap between nose and mouth
smaller. These changes in the facial appearance
typically caused wrong nose and mouth localization
errors.
Especially, lower face AU 9 and AU
combinations 4+6, 9+17, 12+20, 12+16 caused
strong degradation in nose and mouth localization
rates. Similarly, in (Lien, Kanade, Cohn, and Li,
2000), degradation in the feature-based recognition
of the lower face AU combinations 12+25 and 9+17
was observed (84% and 77%, respectively).
However, regardless of considerable deterioration of
nose and mouth localization by the listed AUs,
mouth could be found regardless of whether the
mouth was open or closed and whether the teeth or
tongue were visible or not (Figure 2).
4.3 General Discussion
So far we discussed the effect of upper face AUs on
the eye region localization and the effect of lower
face AUs on the nose and mouth localization.
However, the results also revealed that expressions
in the upper face noticeably deteriorated nose and
mouth localization and some changes in the lower
face affected eye region localization. It is due to the
fact that occurring singly or in combinations, AUs
may produce strong skin deformations to be in a far
neighbourhood from those AUs. In the current
database, upper face AUs were usually represented
in conjunction with lower face AUs, and their joint
activation caused changes in both upper and lower
parts of the face. Because of this, the effect of single
AU or AU combinations was difficult to bring into
the light. The present study investigated only the
indirect effect of AUs and AU combinations on the
landmark localization.
The overall performance of the method can be
improved in several respects. First, the results
demonstrated that a majority of the errors was
caused by those facial behaviours which resulted in
the decrease of space between neighbouring
landmarks. Thus, wrong localization errors occurred
already on the stage of edge map construction. The
reason for that was that a distance between edges
extracted from neighbouring landmarks became less
than a fixed threshold and edges belonging to
different landmarks were erroneously grouped
together. To fix this problem, adaptive thresholds are
needed for edge grouping. To facilitate landmark
localization further, the merged landmarks can be
analyzed according to edge density inside the
merged regions. The results showed that the regions
of merged landmarks have non-uniform edge
density. Such regions can be processed subsequently
and separated into several regions of strong edge
VISAPP 2008 - International Conference on Computer Vision Theory and Applications
264

concentration. Second, it is widely accepted that
analysis of spatial semantics among neighbouring
facial features helps in detecting and inferring
missed or occluded facial landmarks. To improve
the performance of the method, a constellation of
landmark candidates can be analyzed according to
face geometry at the stage of orientation matching.
As the results showed, eye regions were localized
robustly regardless of facial expression. It gives a
possibility to use eye region locations and overall
face geometry as a guide for localization of other
landmarks which were missed (occluded). It can also
decrease a false localization rate.
In summary, the method was effective in
localization of facial landmarks in neutral images. In
this case, the localization rates were higher than 90%
for all facial landmarks. In case of expressive faces,
the present results specified some of the critical
facial behaviours that caused the degradation of the
landmark localization rates. We believe that these
results can be generalized in some extent to other
methods of landmark detection which rely on the
low-level edge and intensity information. Further,
using only grey level information contained in the
image, the method was invariant with respect to
different skin colour. The edge orientation model
appeared to be effective in noise reduction. Thus the
method was able to locate landmarks in images with
hair and shoulders. Emphasizing simplicity and low
computation cost of the method, we conclude that it
can be used in the preliminary localization of
regions of facial landmarks for their subsequent
processing where coarse landmark localization is
following by fine feature detection.
ACKNOWLEDGEMENTS
This work was financially supported by the Finnish
Academy (project number 177857), the University
of Tampere, and the Tampere Graduate School in
Information Science and Engineering. The authors
thank the creators of the Cohn-Kanade AU-Coded
Facial Expression Database for the permission to
reprint the examples of expressive images.
REFERENCES
Ekman, P., Friesen, W., 1978. Facial Action Coding
System (FACS): A Technique for the Measurement of
Facial Action, Consulting Psychologists Press, Inc.
Palo Alto, California.
Ekman, P., Friesen, W., Hager, J., 2002. Facial Action
Coding System (FACS), A Human Face. Salt Lake
City, Utah.
Gizatdinova, Y., Surakka, V., 2006. Feature-Based
Detection of Facial Landmarks from Neutral and
Expressive Facial Images. In IEEE Transactions on
Pattern Analysis and Machine Intelligence, 28 (1), pp.
135-139.
Guizatdinova, I., Surakka, V., 2005. Detection of Facial
Landmarks from Neutral, Happy, and Disgust Facial
Images. In Proceedings of 13th Int. Conf. Central
Europe on Computer Graphics, Visualization and
Computer Vision, pp. 55-62.
Hjelmas, E.
Low, B., 2001. Face Detection: A Survey. In
Computer Vision and Image Understanding, 83, pp.
235–274.
Kanade, T.,
Cohn, J., Tian, Y., 2000. Comprehensive
Database for Facial Expression Analysis. In
Proceedings of 4th IEEE Int. Conf. Automatic Face
and Gesture Recognition, pp. 46-53.
Lien, J., Kanade, T., Cohn, J., Li, C., 2000. Detection,
Tracking, and Classification of Action Units in Facial
Expression. In J. Robotics and Autonomous Systems,
31, pp. 131-146.
Pantic, M., Rothkrantz, J., 2000. Automatic Analysis of
Facial Expressions: The State of the Art. In IEEE
Trans. Pattern Analysis and Machine Intelligence, 22
(12), pp. 1424–1445.
Tian, Y.-L., Kanade, T., Cohn, J., 2002. Evaluation of
Gabor Wavelet-Based Facial Action Unit Recognition
in Image Sequences of Increasing Complexity. In
Proceedings of 5th IEEE Int. Conf. Automatic Face
and Gesture Recognition, pp. 229-234.
Yang, M., Kriegman, D., Ahuaja, N., 2002. Detecting
Face in Images: A Survey. In IEEE Trans. Pattern
Analysis and Image Understanding, 24, pp. 34-58.
APPENDIX A: EDGE DETECTION
AND GROUPPING
The grey scale image representation was considered
as a two dimensional array
}{
ij
bI =
of the
Y
X
×
size. Each
ij
b
element of the array
represented b intensity of the
},{ ji image pixel. If
there was a colour image, it was first transformed
into the grey scale representation by averaging of the
three RGB components. This allowed the method to
be robust with respect to small illumination
variations and skin colour. The high frequencies
were removed by convolving the image with a
Gaussian filter to eliminate noise and small details
(Equation 1).
EFFECT OF FACIAL EXPRESSIONS ON FEATURE-BASED LANDMARK LOCALIZATION IN STATIC GREY
SCALE IMAGES
265

∑
−
=
qp
l
pq
l
ij
ij
bab
,
1
)(
,
ij
ij
bb =
)1(
(1)
where
pq
a
is a coefficient of the Gaussian
convolution; p and q define the size of a filter,
2 2, ÷−=qp ; 10
−
÷= Xi ; 10 −÷= Yj ; 2,1
=
l
define the level of image resolution.
The smoothed images were further used to
detect regions of image which were more likely to
contain facial landmarks. The original, high
resolution images were used to analyse the
candidates for facial landmarks in more detail. In
that way, the amount of information that was
processed at high resolution level was significantly
reduced.
Further, local oriented edges were extracted by
convolving the image with a set of ten convolution
kernels resulting from differences of two oriented
Gaussians (Equations 2-5).
2
22
2
)sin()cos(
2
2
1
σ
ϕσϕσ
ϕ
πσ
kk
k
qp
eG
−+−
−
−
=
(2)
2
22
2
)sin()cos(
2
e
2
1
σ
ϕσϕσ
ϕ
πσ
kk
k
qp
G
+++
−
+
=
(3)
)(
1
+−
−=
k
kk
GG
Z
G
ϕ
ϕϕ
(4)
∑
+−
−= )(
k
k
GGZ
ϕ
ϕ
,
0>−
+−
k
k
GG
ϕ
ϕ
(5)
where
2.1=
σ
is a root mean square deviation of
the Gaussian distribution;
k
ϕ
was an angle of the
Gaussian rotation,
°
⋅
= 5.22k
k
ϕ
; 1410,62
÷
÷=k ;
3 3, ÷−=qp .
The maximum response of all 10 kernels
defined the contrast magnitude of a local edge at its
pixel location (Equation 6). The orientation of a
local edge was estimated with orientation of a kernel
that gave the maximum response.
∑
−−
=
qp
l
qjpi
ij
kk
Gbg
,
)(
,
ϕϕ
(6)
After the local oriented edges were extracted,
they were thresholded, and then grouped into the
regions of interest representing candidates for facial
landmarks. The threshold for contrast filtering of the
extracted edges was defined as an average contrast
of the smoothed image. Edge grouping was based on
the neighbourhood distances between edge points
and was limited by a number of possible neighbours
for each edge point. Regions with small number of
edge points were removed. The optimal thresholds
for edge grouping were determined using a small
image set randomly selected from the database.
To get more detailed description of the
extracted edge regions, the steps of edge extraction
and edge grouping were applied to high resolution
image (
1
=
l ) within the limits of these regions. In
this case, the threshold for contrast filtering was
determined as a double average contrast of the high
resolution image.
APPENDIX B: EDGE
ORIENTATION MATCHING
The procedure of edge orientation matching was
applied to verify the existence of a landmark on the
image. To do that, the detected regions were
matched against the edge orientation model. The
orientation model defined a specific distribution of
the local oriented edges inside the detected regions.
The following rules defined the edge
orientation model: 1) horizontal orientations are
represented by the greatest number of the extracted
edges; 2) a number of edges corresponding to each
of horizontal orientations is more than 50% greater
than a number of edges corresponding to any other
orientations; and 3) orientations cannot be
represented by zero number of edges.
The regions of facial landmarks had the specific
distribution of the oriented edges. On the other hand,
non-landmark regions like, for example, elements of
clothing and hair, usually had an arbitrary
distribution of the oriented edges and were discarded
by the orientation model.
VISAPP 2008 - International Conference on Computer Vision Theory and Applications
266
