
ON-CHIP FLUORESCENCE LIFETIME EXTRACTION USING
SYNCHRONOUS GATING SCHEME
Theoretical Error Analysis and Practical Implementation
Day-Uei Li, Bruce Rae, David Renshaw, Robert Henderson
Institute for Integrated Micro and Nano Systems, The University of Edinburgh, The King’s Buildings
Mayfield Rd., Edinburgh EH9 3JL, UK
Eleanor Bonnist
School of Chemistry and the Collaborative Optical SpectroscopyMicromanipulation and Imaging Centre (COSMIC)
University of Edinburgh, West Mains Rd., Edinburgh EH9 3JJ, UK
Keywords: Fluorescence lifetime imaging microscopy (FLIM). Error analysis. On-chip implementation. Rapid lifetime
determination (RLD). Single photon avalanche diode (SPAD). Time-correlated single-photon counting
(TCSPC). Data fitting. Pipe-lined RLD. Instrumental response function (IRF).
Abstract: A synchronous gating technique was proposed for fluorescent photon collecting. The two- and multi-gate
rapid lifetime determination (RLD) technique was applied to implement on-chip fluorescence lifetime
extraction. Compared with all available iterative least square method (LSM) or maximum likelihood
estimation (MLE) based general purpose FLIM analysis software, we offer a method for the direct
calculation of lifetime based on the photon counts stored in on-chip memory and deliver faster analysis to
enable real-time applications. Theoretical error analysis of the two-gate RLD technique was derived for
comparison. The performance of the algorithms were tested on a single-exponential histogram obtained
from a CMOS SPAD detector chip using a 468nm laser diode light source with optimized gate width.
Moreover, a multi-exponential pipelined RLD FLIM technique was also proposed and tested on a four-
exponential decay DNA sample containing a single adenine analogue 2-aminopurine.
1 INTRODUCTION
Fluorescence lifetime measurements have been used
widely to study various scientific and practical
applications on optics, chemistry, biology, medicine,
medical diagnosis. A large number of different
techniques including time-domain and frequency-
domain methods have been well developed for
measuring fluorescence lifetime (Apanasovich and
Novikov, 1992). In time-domain methods, the
fluorescence intensity decay is measured through a
time-correlated single photon-counting (TCSPC)
card after excitation with a short pulse of laser light
(Cubeddu et al, 2002), whereas in frequency-domain
methods, the fluorescent sample is illuminated with
a periodic light source to obtain a measured phase
difference between the light source and the
fluorescent emission. Irrespective of the method
used (Jo et al, 2004), the lifetime extraction is done
using computer software. For general purpose time-
domain analysis tools for scientific research
demanding high accuracy down to the picosecond
timescale or for practical medical/clinical diagnostic
applications demanding fast results, a wide range of
faint multi-exponential fluorophores must be
computed with a lifetime resolution better than 50ps
(Becker, 2005). Due to the incapability of the LSM
or MLE to resolve a small lifetime with a coarse
channel width, the number of bits of resolution of
TDCs on photon counting cards is therefore
expected to be larger than 11-bit (Becker, 2005). To
use LSM or MLE properly, the measurement
window is usually set as large as possible otherwise
the software would treat the measured data as having
a DC offset part and therefore the laser pulse
repetition rate is kept low, which further lowers the
photon collection speed. Data therefore can be
gathered in several days. Moreover, because
171
Li D., Rae B., Renshaw D., Henderson R. and Bonnist E. (2008).
ON-CHIP FLUORESCENCE LIFETIME EXTRACTION USING SYNCHRONOUS GATING SCHEME - Theoretical Error Analysis and Practical
Implementation.
In Proceedings of the First International Conference on Bio-inspired Systems and Signal Processing, pages 171-176
DOI: 10.5220/0001061301710176
Copyright
c
SciTePress
fluorescence lifetimes in imaging are determined on
a pixel-by-pixel basis, iterative methods can be quite
time consuming and make real-time image
processing almost impossible. Although one can
drop the requirement for short laser pulses by using
frequency-domain methods, lifetime extraction still
relies on software analysis, which also makes real-
time image processing difficult to achieve. As
process technology advances, integration of high
speed laser drivers and laser diodes on chip is
becoming feasible.
2 THEORETICAL ERROR
ANALYSIS
The recorded fluorescence intensity f(t) is related to
the true decay function I(t) through the integral
()()
0
()
t
f
tItIRFd
τ
ττ
=−
∫
(1)
where IRF(t) is the instrumental response function,
or the convolution of transition spread of the
detector and the pulse function of the laser source.
The true response I(t) could be obtained through an
on-chip digital de-convolution calculation. However,
we need to evaluate whether the enhanced precision
can justify the cost of the extra chip area for digital
de-convolution. Here we assume I(t) = Aexp(-t/
τ),
and the ratio of the full width half maximum
(FWHM) of IRF(t) over the lifetime is denoted as r.
The recorded response f(t) is obtained from (1). As r
is larger than 1, it is difficult to obtain a clear
response because of the effects of noise and it is
inefficient to accumulate enough photon counts for a
certain SNR criteria. The smaller the ratio r, the
more efficiently and accurately the lifetime can be
extracted. Considering the 10ps jitter in the light
source, the 80ps transition spread of our SPAD
structure, and the 30ps jitter of gate transitions, the
overall FWHM is about 100ps. Thus, without on-
chip de-convolution function, the smallest lifetime
that can be obtained is of the order of 200ps. For
first time implementation, we simplify by using
longer-lifetime samples as test cases. The
assumption of f(t) as a single exponential is quite
reasonable. In this paper, we applied the RLD
method for simplicity.
2.1 Theory
The simplest way of calculating fluorescence
lifetime is to use the RLD technique with two
consecutive gates (Ballew and Demas, 1989) called
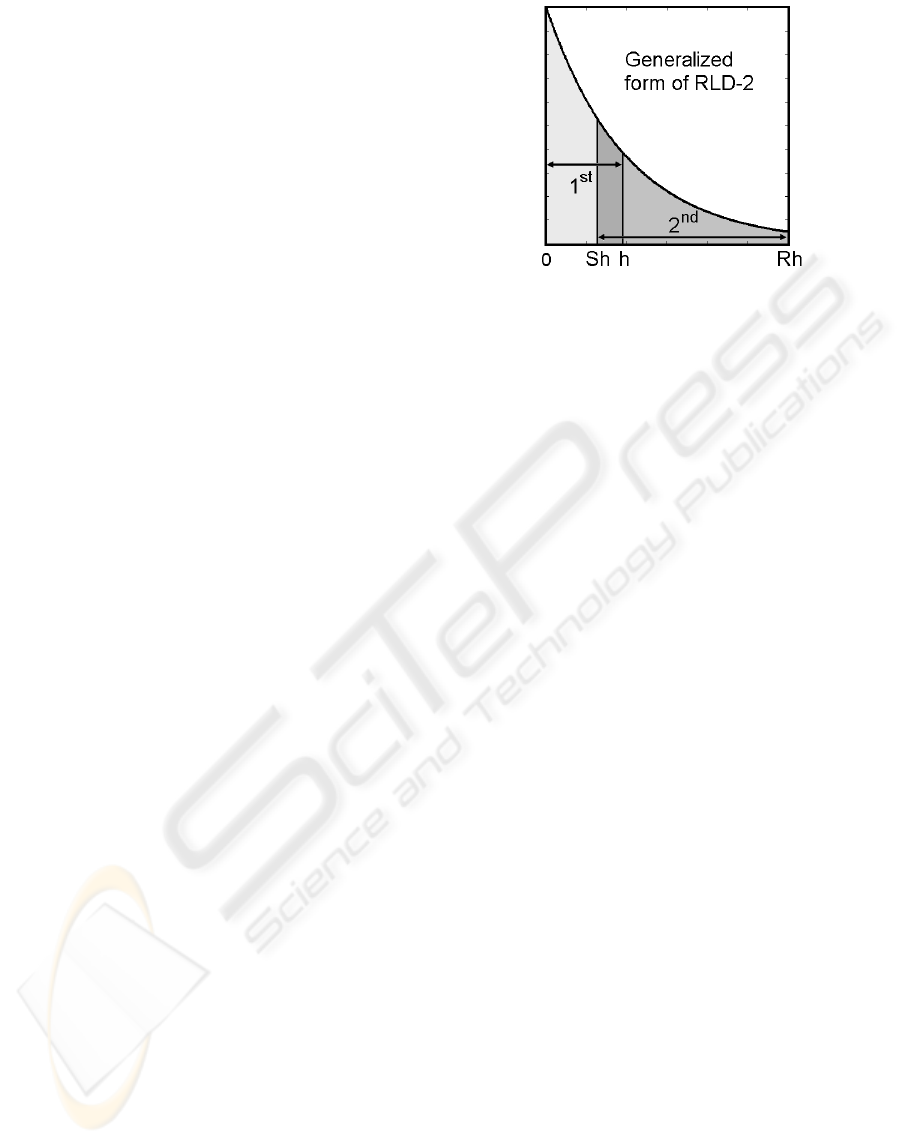
Figure 1: Generalized form of two-gate RLD.
standard RLD. Unlike the LSM or MLE based
methods, it is a direct calculation method. The
disadvantage of standard RLD is its high sensitivity
to the gate width selection. This can be explained by
reasoning that when dealing with a short lifetime,
the photons are mostly located in the first gate, and
the relatively low counts in the second gate becomes
the major source of error. To overcome this problem,
a gate overlap approach was introduced to the
standard RLD (Sharman and Periasamy, 1999)
trying to offer greater insensitivity to the Possion
noise in the second gate. This method did offer
better resolvability for a range of short lifetimes, but
it sacrificed precision for the longer lifetimes.
Another approach called SWRLD is proposed (Chan
et al, 200) using a square wave driven LED as a light
source. SWRLD offers uniform high precision in a
much wider range of gate width. However, this
method does not easily extract lifetimes shorter than
1ns because the 1ns edge speed of the fastest
available LED dictates the minimum lifetime
extraction limit, Thus an example of a long lifetime
of 2ms has been chosen as an illustration. The
second challenge is that SWRLD needs many filters
to separate fluorophore emission from scattered laser
emission (the IRF). Beyond these limits, SWRLD is
indeed a precise method for long lifetime extraction
(>> 10ns). A better approach to achieve better
precision for long lifetimes is make the second gate
wider than the first and therefore tolerate much
higher counts (Moore et al, 2004). This method,
however, needs an iteration method to do lifetime
extraction. Plus for on-chip implementation,
asymmetric gates require the generation of two
synchronized clocks with different pulse widths and
thus increase the circuit complexity. The best
theoretical solution is not necessarily the right one in
terms of cost and feasibility. All the amended
algorithms mentioned require Monte Carlo to do
error analysis. We derive a generalized formula here
BIOSIGNALS 2008 - International Conference on Bio-inspired Systems and Signal Processing
172
for calculating the standard deviation of lifetimes
much more conveniently and therefore facilitate
location of the optimized lifetime region or
measurement window. Figure 1 shows the
generalized form of two-gate RLD. The counts N
1
and N
2
in the two gates are related as
(
)
(
)
21
() 1 0,
SR
gx N x N x x=−− −=
(2)
where x = exp(-h/
τ
) and
()
(
)
()()
111
222
1/1 , ,
/1 , .
R
c
SR R
c
NN x x N N
NNxx x N N
σ
σ
=−− =
=−− =
(3)
with σN
1
and σN
2
being the standard deviations in
N
1
and N
2
, respectively for Poisson noise and N
c
the
total count number. Together with (2), we have
(
)
(
)
,
g
xxgx
σσ
′
=⋅
(4)
()
()
2
2
22
21
1,
SR
gNxNxx
σσ σ
=−+−
(5)
(
)
(
)
11
21
,
SR
gx N NSx Rx
−−
′
=+ −
(6)
2
and .xx h
σ
στ τ
=
(7)
From (2) to (7), we could obtain
()
() ()
()
()
()
()
1
11
2
2
1()
11
() 1 1 .
R
c
SRSR
SR SR
hxkxN
Sx Rx SxRx
kx x x x x x x
τ
στ
τ
−
++
−
=
⎡⎤
−−−−+
⎣⎦
=− − +− −
(8)
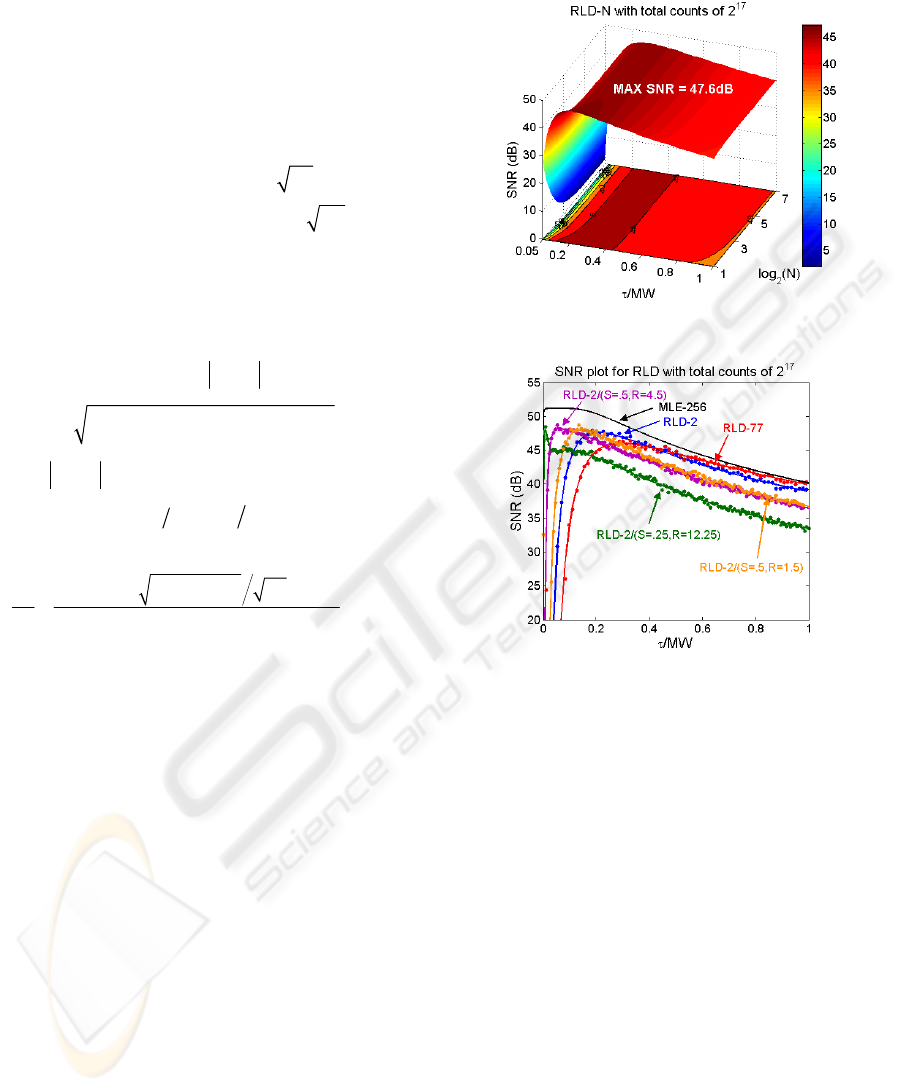
2.2 Comparison of RLD-2s and RLD-N
To demonstrate the ability of different RLD schemes,
we fix the measurement window (MW). First we
compute the standard deviation over the lifetime
SNR = σ
τ
/
τ
in dB. Figure 2 shows the SNR in the
range of
τ
/MW within 0.05 and 1, and gate number
N within 2 and 128 under total counts of 2
17
. It
shows the SNR plot converges as N > 8 and RLD-2
shows the best resolvability for small lifetime region,
but both RLD-2 and RLD-N could not resolve those
less than 0.1. It means that with a laser source of
repetition rate of 100MHz, they could not resolve
those less than 1ns. Moreover, the complexity of
implementing N-gate RLD on chip is too large. In
terms of implementation, the RLD-2 is much easier
than RLD-N. Figure 3 shows a comparison plot of
lifetime SNR versus lifetime normalized by
measurement window (MW) for theoretical equation
(8), equation for the multi-gate scheme not shown
here, Monte-Carlo RLD methods and the maximum
likelihood estimator (MLE) (Kollner and Wolfrum,
1992).
Figure 2: SNR plot for RLD-N under total counts of 2
17
.
Figure 3: SNR plot for RLD-N with total counts of 2
17
.
This plot shows the range of lifetime resolvable by
each extraction method for a certain laser repetition
rate. The results obtained by theoretical equations
are marked as solid lines whereas those by Monte-
Carlo methods are indicated by dots. They match
well. We also compare the MLE results and find that
the peak value of the RLD-2 occurs at
τ
/MW =
τ
/(2h)
~
0.2 which is coincident with previously reported
literature. The plot shows the RLD-77 has best
precision and closest to that of MLE only in high
lifetime region, while it has the worst resolvability
for low lifetime region. Un-equal gate scheme (S =
0.5, R = 4.5) offers better resolvability than the
equal gate-width one (S = 0.5, R = 1.5). The one
with S = 0.25 and R = 12.25 suggested by (Moore et
al, 2004) offers the best resolvability for small
lifetime region but sacrifices some precision in the
high lifetime region. In terms of implementation
complexity, feasibility, and limitations on chip, the
equal gate width scheme is the simplest. Of course,
if we insist on implementing an un-equal one given
ON-CHIP FLUORESCENCE LIFETIME EXTRACTION USING SYNCHRONOUS GATING SCHEME - Theoretical
Error Analysis and Practical Implementation
173
that we have conquered the problem of transition
spread of the IRF, we could build an on-chip look-
up table to simplify lifetime extraction. For first time
on-chip implementation, we simplify by using the
equal gate and non-overlap scheme. The overlap
scheme will be implemented in the future. Table 1
lists the summary of RLD schemes. Except the
RLD-N, the others are all possible candidates.
Table 1: Comparison and summary of RLD schemes.
Closed
Form
τ
/MW < 0.1
Resolvability
On-chip
Feasibility
Standard
RLD-2
Yes No
Yes/Look-
up Table
Standard
RLD-N
(N > 2)
Yes No No
Overlap
RLD-2
(R = 1+S)
Yes Yes
Yes/Look-
up Table
Overlap
RLD-2
(R
≠ 1+S)
No Yes
Yes/Look-
up Table
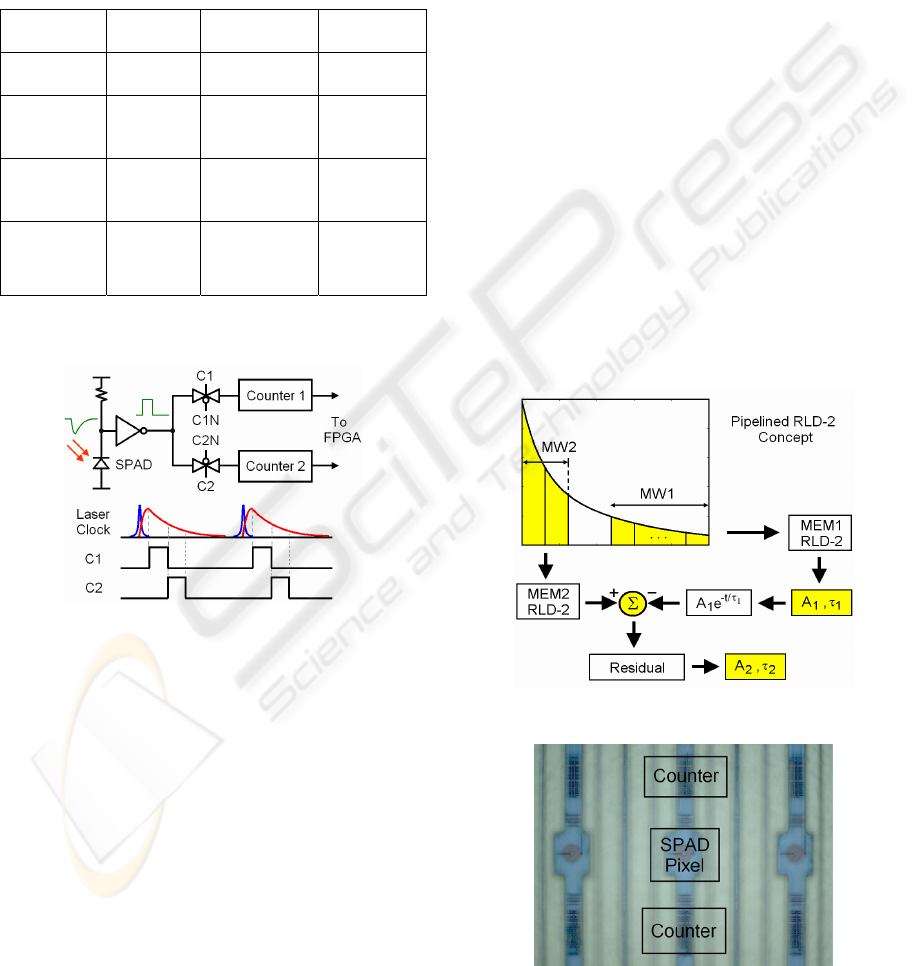
2.3 Synchronous Gating Scheme
Figure 4: Timing diagram for synchronous gating
technique.
Figure 4 shows the block diagram for the photon
counting process. The fluorescence emission is
detected by a SPAD detector, and the detected signal
is converted into a digital one by a comparator and
then sent into two synchronous counters controlled
by clocks C1 and C2, respectively. And the photon
counts on counters 1 and 2 are sent to a FPGA for
post processing.
2.4 Pipelined RLD-2 for Multi-Decays
The above analysis is based on the assumption that
the fluorescence emission follows a single-lifetime
function. When trying to resolve multi-lifetime
fluorescence decay, we need a simple algorithm.
Figure 5 shows an algorithm for lifetime extraction
in a two-lifetime fluorescence histogram similar to
the concept of pipelined analog-to-digital converters,
called pipelined RLD-2 (PL-RLD-2). The lifetime
extraction procedure uses RLD-2 to extract the
larger lifetime and intensity with the first memory,
and subtraction of the extracted extrapolation
function from the photon counts stored in the second
memory to obtain the second lifetime and intensity.
Pipelined algorithms for higher (> 2) decays can
follow this procedure until the last lifetime is finally
calculated.
3 EXPERIMENTAL RESULTS
3.1 Single-decay
The chip including a 4×16 SPAD array and digital
readout circuits was implemented on 0.35μm high
voltage CMOS process. The die had the polymide
passivation removed providing around 3-5x increase
in photon detection probability in the 500nm range.
Each pixel contains a single 15μm-diameter CMOS
SPAD (Niclass, 2006).
Figure 5: Block diagram of pipelined RLD-2.
Figure 6: SPAD pixel and two ripple counters.
BIOSIGNALS 2008 - International Conference on Bio-inspired Systems and Signal Processing
174
Figure 7: SPAD pixel and two ripple counters.
Figure 6 shows a SPAD pixel with two ripple
counters up and down. The gating width could be
adjusted over a 48ns range with a 408ps resolution.
The imager is controlled by a FPGA and photon
count histograms are captured and displayed on a PC.
The measurement setup is shown in Figure 7. It
consists of a laser diode emitting 88ps pulses at
468nm, 5mW average power, synchronized to the
system clock. Without using any photon counting
card, the photon emitted is converted into a digital
signal and processed by on-chip ripple counters in
Figure 4. The fluorophore sample is 1 micro-molar
Rhodamine B. Table 2 shows the extracted lifetime
using the RLD-2 and the LSM based software. The
difference between them is about 7%. Jitter
performance of the synchronous gate might
contribute some error, because a phase-locked loop
PLL has not been integrated to minimize the jitter.
Table 2: Comparison of lifetimes extracted by RLD-2 and
software.
Sample RLD-2 Software
Rhodamine B 2.33ns 2.175ns
3.2 Multiple-decays
The second example is used to test the proposed
pipelined RLD-2 algorithm. This data set comes
from the fluorophore 2-aminopurine (2AP) inside a
singly-labelled 14 base-pair DNA duplex and was
measured in an Edinburgh Instruments spectrometer
equipped with TCC900 photon counting electronics
(Neely et. al, 2005). The excitation source was a Ti-
Sapphire femtosecond laser system producing pulses
of ~200fs at 76MHz repetition rate. The output of
the laser was passed through a pulse picker to reduce
the repetition rate to 4.75MHz and then frequency
tripled to give an output at 320nm. The emission
from the sample was collected orthogonal to the
excitation direction through a polarizer. The
fluorescence was passed through a monochromator,
and detected by a Hamamatsu PMT (R3809U-50).
The instrument response was 50ps FWHM.
Florescence decay curves were recorded at emission
wavelength of 390nm on a timescale of 50ns,
resolved into 4096 channels, to a total 10,000 counts
in the peak channel. Decay curves were analyzed
using the proposed PL-RLD-2 and using the F900
software with standard iterative reconvolution
method, assuming a multi-exponential decay
function in the following equation.
4
1
() exp ,
i
i
i
t
It A
τ
=
⎛⎞
=−
⎜⎟
⎝⎠
∑
(9)
Figure 8: Fitted data and residual using PL-RLD-2.
Table 3: Comparison of lifetimes (ns) and fractional
amplitudes (%) extracted by PL-RLD-2 and F900 software.
τ
i
(ns)/A
i
(%)
PL-RLD-2 F900 Software
τ
1
/A
1
0.136/27 0.14/47
τ
2
/A
2
0.481/55 0.47/39
τ
3
/A
3
2.179/11 2.19/9
τ
4
/A
4
8.225/7 8.15/5
where A
i
is the fractional amplitude and
τ
i
is the
fluorescence lifetime of the i-th decay component.
Figure 8 shows the logarithmic plot for the measured
photon counts starting from the channel with peak
counts 10,000 and the fitted data using the proposed
PL-RLD-2. The residual plot reveals that the
proposed method fits well with the experimental
data. The extracted lifetimes and fractional
ON-CHIP FLUORESCENCE LIFETIME EXTRACTION USING SYNCHRONOUS GATING SCHEME - Theoretical
Error Analysis and Practical Implementation
175

amplitudes using the PL-RLD-2 and the F900
software are listed in Table 3. The Table shows the
extracted lifetimes differ within 4% whereas the
amplitudes differ in a significant range. That is why
recent literature (Philip, 2003) suggests that
fluorescence lifetime measurements offer better
precision. These results highlight the potential of
RL-RLD-2 for on-chip multiple exponential lifetime
extraction, if adaptive gating width technique could
also be introduced on-chip.
4 CONCLUSIONS
On-chip fluorescence lifetime extraction including a
SPAD array and digital readout circuitry is for the
first time implemented on 0.35μm CMOS process
using the two-gate RLD. Theoretical error equations
for several RLD-2/RLD-N schemes were derived
and compared to determine a possible
implementation strategy. To implement RLD-2, a
non-overlap synchronous gating is applied for
photon counting. The first on-chip attempt is mainly
focused on dealing with single-exponential
fluorescence emission, and the extracted result
matches with the true value well within 10%
including possible contribution from gating jitter.
For possible future on-chip implementation for
multi-exponential fluorescence lifetime extraction,
we proposed a pipelined RLD-2 (PL-RLD-2) and we
test this method on a four-exponential experimental
data, and the extracted lifetimes match well with
those obtained by iteration based software within 4%.
ACKNOWLEDGEMENTS
This work has been supported by the European
Community within the Sixth Framework Programme
IST FET Open MEGAFRAME project (contract No.
029217-2, www.megaframe.eu). The measurements
have been performed using the COSMIC laboratory
facilities at the University of Edinburgh.
DISCLAIMER
This publication reflects only the authors’ views.
The European Community is not liable for any use
that may be made of the information contained
herein.
REFERENCES
Apanasovich, V. V. and Novikov, E. G. (1992) ‘Methods
of analysis of fluorescence decay curves in pulsed
fluorometry (Review)’, Journal of Applied
Spectroscopy, Vol. 56, No. 4, pp. 317-327.
Cubeddu, R., Comelli, D., D’Andrea, C., Taroni, P. and
Valentini, G. (2002) ‘Time-resolved fluorescence
imaging in biology and medicine’, J. Phys. D: Applied
Physics, Vol. 35, pp. R61-R76.
Jo, J. A., Fang, Q., Papaioannou, T. and Marcu, L. (2004)
‘Novel ultra-fast deconvolution method for
fluorescence lifetime imaging microscopy based on
the Laguerre expansion technique’, Conference
Proceedings, 26
th
Annual International Conference of
the IEEE EMBS, pp. 1271-1274.
Becker, W. (2005), Advanced Time-Correlated Single
Photon Counting Techniques, Wolfgang, Springer.
Ballew, R. M. and Demas, J. N. (1989), ‘An error analysis
of the rapid lifetime determination method for the
evaluation of single exponential decays’, Ana. Chem.,
Vol. 61, pp. 30-33.
Sharman, K. K. and Periasamy, A. (1999), ‘Error analysis
of the rapid lifetime determination method for double-
exponential decays and new windowing schemes’,
Ana. Chem., Vol. 71, pp. 947-952.
Chan, S. P., Fuller, Z. J., Demas, J. N., Ding, F. and
DeGraff, B. A. (2001), ‘New method of rapid
luminescence lifetime determination using square-
wave excitation’, Applied Spectroscopy, Vol. 55, No.
9, pp. 1245-1250.
Moore, C., Chan S. P., Demas, J. N. and DeGraff, B. A.
(2004), ‘Comparison of methods for rapid evaluation
of lifetime of exponential decays’, Applied
Spectroscopy, Vol. 58, No. 5, pp. 603-607.
Kollner, M. and Wolfrum, J. (1992), ‘How many photons
are necessary for fluorescence-lifetime
measurements?’, Chemical Physics Letters, Vol. 200,
No. 1,2, pp. 199-204.
Niclass, C. L. et al, (2006), ‘A single photon avalanche
diode array fabricated in deep submicron technology’,
Conference Proceedings, Design, Automation, and
Test Europe Conference, pp. 81-86.
Neely, R. K., Daujotyte, D., Grazulis, S., Magennis, S. W.,
Dryden, D. T. F., Klimasauskas, S. and Jones, A. C.,
(2005), ‘Time-resolved fluorescence of 2-aminopurine
as a probe of base flipping in M.Hhal-DNA
complexes’, Nucleic Acids Research, Vol. 33, No. 22,
pp. 6953-6960.
BIOSIGNALS 2008 - International Conference on Bio-inspired Systems and Signal Processing
176
