
COMPARATIVE STUDY OF SEVERAL NOVEL ACOUSTIC
FEATURES FOR SPEAKER RECOGNITION
∗†
Vladimir Pervouchine,
∗
Graham Leedham,
∗‡
Haishan Zhong,
∗
David Cho and
∗†
Haizhou Li
∗
Nanyang Technological University, School of Computer Engineering, N4 Nanyang Ave, Singapore 639798
†
Institute for Infocomm Research, 21 Heng Mui Keng Terrace, Singapore 119613
‡
Panasonic Singapore Laboratories, 1022 Tai Seng Avenue, #06-3530 Tai Seng Ind Est, Singapore 534415
Keywords:
Speaker recognition, feature extraction, feature evaluation.
Abstract:
Finding good features that represent speaker identity is an important problem in speaker recognition area.
Recently a number of novel acoustic features have been proposed for speaker recognition. The researchers
use different data sets and sometimes different classifiers to evaluate the features and compare them to the
baselines such as MFCC or LPCC. However, due to different experimental conditions direct comparison of
those features to each other is difficult or impossible. This paper presents a study of five new recently proposed
acoustic features using the same data (NIST 2001 SRE), and the same UBM-GMM classifier. The results
are presented as DET curves with equal error ratios indicated. Also, an SVM-based combination of GMM
scores produced on different features has been made to determine if the new features carry any complimentary
information. The results for different features as well as for their combinations are directly comparable to each
other and to those obtained with the baseline MFCC features.
1 INTRODUCTION
Speaker recognition is the process of automatic iden-
tification or verification of a speaker using the in-
formation obtained from his/her speech. Verification
permits access control by voice as well as facilitates
in crime investigation if recordings of phone conver-
sations are available. Speaker recognition systems in-
cludes speaker identification and speaker verification;
however, studies usually focus on speaker verification
only. Text-independent verification has gained much
attention because does not require a user to speak any
pre-defined phrases for the system to operate and thus
is an attractive method of personal verification.
To represent a speaker features extracted from the
audio file are used. It is supposed that different speak-
ers can be represented differently in the feature space.
Therefore by building statistical models that approxi-
mate the distribution of feature vectors for different
speakers, the conditional probability of the speaker
being who he claims can be estimated.
Finding good features with low intra-speaker vari-
ation and high inter-speaker variation, as well as not
too sensitive to channel type, is an important prob-
lem in speaker recognition. Commonly used features
are Linear Prediction (LP) based features such as Lin-
ear Predictive Cepstral Coefficients (LPCC) and Mel
Frequency Cepstral Coefficients (MFCC) (Gish and
Schmidt, 1994). Although recently research focus has
been shifted mostly to developing methods of elimi-
nation of channel effects, a number of new and novel
features have been proposed (Wang and Wang, 2005;
Sant’Ana et al., 2006; Cordeiro and Ribeiro, 2006; Sri
Rama Murty and Yegnanarayana, 2006). New classi-
fication method to be used with the new features has
also been proposed in (Sant’Ana et al., 2006). Re-
searchers use different data sets to compare perfor-
mance of speaker verification systems with their fea-
tures to that of the baseline systems. Therefore, it is
often difficult or impossible to compare the effective-
ness of the new features to each other and to baseline
features (such as MFCC).
This paper presents a comparative study of five
new features proposed in 2005–2006 publications.
The features studied are Mean Energy within Critical
Bands (MECB) and Difference of Mean Energy within
Critical Bands (DMECB) (Wang and Wang, 2005),
pH features based on Hurst parameter and fractional
220
Pervouchine V., Leedham G., Zhong H., Cho D. and Li H. (2008).
COMPARATIVE STUDY OF SEVERAL NOVEL ACOUSTIC FEATURES FOR SPEAKER RECOGNITION.
In Proceedings of the First International Conference on Bio-inspired Systems and Signal Processing, pages 220-223
DOI: 10.5220/0001060302200223
Copyright
c
SciTePress

Brownian motion model (Sant’Ana et al., 2006), Mel
Line Spectrum Frequencies (MLSF) (Cordeiro and
Ribeiro, 2006), and Residual Phase (Sri Rama Murty
and Yegnanarayana, 2006). The paper is organised as
follows. Section 2 shortly describes the features and
section 3 presents the feature combination scheme.
Section 4 discusses the experimental setup and the re-
sults, and section 5 draws the conclusions.
2 FEATURES STUDIED
Mel Frequency Cepstral Coefficients. Commonly
used MFCC features were taken as the baseline. The
data set audio files were divided into frames of 30 ms
length with 1/3 overlap using Hamming window.
Twelve MFCC coefficients were calculated for each
frame along with their first and second differences
(∆MFCC and ∆∆MFCC) resulting in 36-dimensional
feature vectors. The feature values were normalised
by subtracting the mean and dividing by the standard
deviation.
Mel Line Spectrum Frequencies. Mel Line Spec-
trum Frequencies (MLSF) are similar to Line Spec-
trum Frequencies calculated from Linear Prediction
(LP) coefficients. The difference is in taking an
advantage of mel frequency warping, emphasising
the information in lower frequencies (Cordeiro and
Ribeiro, 2006). To extract MLSF features, the signal
was divided into 30 ms frames windowed using Ham-
ming window with 1/3 frame overlap. Fast Fourier
Transform (FFT) and mel filter bank were used to
generate mel spectrum. Then the inverse Fourier
transform was applied to get the mel autocorrelation
of the signal. The MLSF features were then calcu-
lated via the Levinson-Durbin recursion. An LP filter
of order 16 was used resulting in 16-dimensional fea-
ture vectors. The feature values were normalised by
subtracting the mean and dividing by the standard de-
viation. Since addition of the first and second differ-
ences (∆MLSF and ∆∆MLSF) might increase the ver-
ification accuracy both differences were calculated. In
the original paper MLSF features were evaluated on
NIST 2002 SRE database.
Residual Phase. A person’s vocal tract can be mod-
elled as an excitation source and a set of filters that
characterise the vocal tract shape. While LP coeffi-
cients approximate the vocal tract shape, the excita-
tion source can be evaluated from the residual signal:
e
n
= s
n
+
p
∑
k=1
a
k
s
n−k
(1)
where s
k
is the signal, a
k
are the LP coefficients.
Examples of features calculated from the residual
signal include Haar Octave Coefficients of Residue
(HOCOR) (Zheng and Ching, 2004) and Residual
Phase (Sri Rama Murty and Yegnanarayana, 2006).
The latter was evaluated on NIST 2003 SRE database.
To extract the residual phase, the analytic signal R
n
=
r
n
+ jh
n
is calculated from the residual signal r
n
,
where h
n
is the Hilbert transform h
n
of r
n
. The phase
is then calculated from the analytic signal as:
θ
n
= arccos
r
n
/
q
r
2
n
+ R
2
n
(2)
Authors (Sri Rama Murty and Yegnanarayana, 2006)
recommend to calculate the residual phase from short
segments of speech of around 5 ms, which is justified
by the period of the bursts in the excitation source. In
the our study the signal was divided into 6 ms frames
with 1/3 overlap. LP of orders 6 and 10 were tried.
Hurst Parameter Features. Hurst parameter
features were proposed for speaker recogni-
tion (Sant’Ana et al., 2006) and evaluated on
BaseIME database developed in the Instituto Militar
de Engenharia. The feature vector is a vector of Hurst
parameters calculated for frames of a speech signal
via Abry-Veitch Estimator using discrete wavelet
transform. To extract the features the speech signal
was divided into 80 ms frames with 1/2 overlap,
which were chosen to make the extraction similar
to that presented in the original paper. Daubechies
wavelets with 4, 6, and 12 coefficients were used,
thus resulting in pH
4
, pH
6
, and pH
12
features. The
depth of wavelet decomposition was to be 5, 4, and 3
for pH
4
, pH
6
, and pH
12
respectively.
Mean Energy within Critical Bands. Fractional
Fourier transform (FrFT) is a generalisation of the
ordinary (integer) Fourier transform. Mean Energy
within Critical Bands (MECB) features based on the
fractional Fourier transform were proposed in (Wang
and Wang, 2005) and evaluated on a custom data set.
The critical bands are formed by warping frequency
according to the mel or bark scale. MECB
p
are cal-
culated by taking the fractional Fourier transform of
order p of each frame of the signal. For i-th critical
band f
i
... f
i+1
the log of mean energy is
E
i
= log
R
f
i+1
f
i
|
F( f )
|
2
d f
f
i+1
− f
i
(3)
For two MECB features of orders p
1
and p
2
the dif-
ference MECB (DMECB) features are calculated as:
DMECB
p
1
−p
2
= MECB
p
1
− MECB
p
2
(4)
COMPARATIVE STUDY OF SEVERAL NOVEL ACOUSTIC FEATURES FOR SPEAKER RECOGNITION
221
In our study the signal was divided into 30 ms long
frames with 1/3 overlap. MECB of orders p =
0.5,0.6,. ..,1.0 were extracted. DMECB were calcu-
lated for a fixed p
1
of 1.0 and p
2
0.5...0.9.
3 COMBINATION OF FEATURES
Combining different acoustic features can be per-
formed in a number of ways. One way is to concate-
nate the feature vectors of the corresponding frames.
However, this leads to feature vectors of very high
dimensionality, which means much more data is re-
quired for reliable training of a classifier. Thus the
concatenation was only done for low-dimensional
feature vectors pH, while for the high-dimensional
features another method was used. A GMM en-
ables modelling the conditional probability density
functions in the feature space for each class. A
GMM classifier returns a score for each given pattern,
which is an estimation of the log likelihood ratio for
the hypothesis that the speaker is who he claims to
be (Reynolds and Rose, 1995). These scores from
GMM classifiers for each of the acoustic features
were used as features. The resulting score feature vec-
tors were used with an SVM classifier.
4 EXPERIMENTS AND RESULTS
All experiments were conducted on NIST 2001
Speaker Recognition Evaluation (SRE) database,
single-speaker files. The audio files sampled at 8 kHz
were pre-emphasised with filter coefficient of 0.97
and divided into frames as described above. For all
features a Gaussian Mixture Model (GMM) classifier
of 512 multivariate normal distributions with diagonal
covariance matrices was used (Reynolds and Rose,
1995). The Universal Background Models (UBM)
were trained on samples from 82 male and 56 fe-
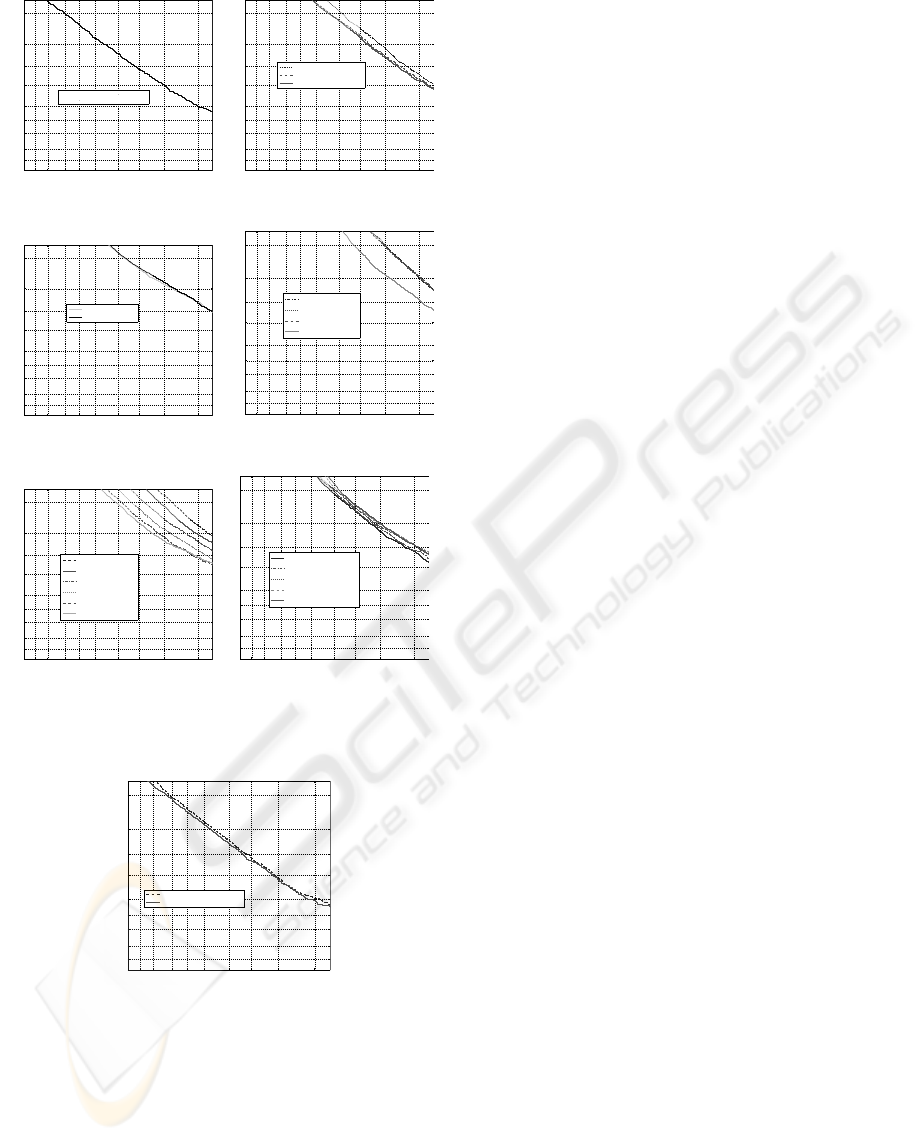
male speakers. The resulting Detection Error Trade-
off (DET) curves and the Equal Error Ratios (EER)
are shown in Fig. 1(a)–(g).
Individual Features. The results achieved with
MFCC features with the first and second differences
were taken as the baseline (Fig. 1(a)). As seen from
the DET curves in Fig. 1(b), adding the first difference
to MLSF improves the speaker verification accuracy,
which is in agreement with the results in (Cordeiro
and Ribeiro, 2006). Adding the second difference im-
proves the accuracy further. Because of high dimen-
sionality of the resulting feature vectors (48) more
training data may lead to better system performance.
Fig. 1(c) shows the DET curves for Residual
Phase features and two different order LP filters. The
difference in the LP filter order does not result in a
significant difference in the speaker verification accu-
racy. It was also found that adding the first difference
features does not change the system performance ei-
ther, so the second difference was not tried.
Features pH
4+6+12
were obtained by concatenat-
ing feature vectors pH
4
, pH
6
, and pH
12
for each
frame. It was found that performance of the speaker
verification system is similar when either one of pH
4
,
pH
6
, pH
12
are used. Concatenating them into 12-
dimensional pH
4+6+12
vectors leads to a dramatic im-
provement in the accuracy with EER dropping from
29.0% to 20.8% (Fig. 1(d)).
The accuracy of speaker verification for MECB
p
features declines with p of FrFT (Fig. 1(e)). This is
in accordance with the results reported in (Wang and
Wang, 2005), while the results for DMECB
1.0−p
2
fea-
tures with various p
2
(Fig. 1(f)) are different from
that reported in the paper: the highest speaker veri-
fication accuracy was achieved for p
2
= 0.5 and for
p
2
= 0.6...0.9 the accuracy decreased with increase
of p
2
. Adding the difference features to MECB and
DMECB did not lead to accuracy improvement.
Table 1: Equal error rates for MECB features of different
orders.
MECB
p
, p 1.0 0.9 0.8 0.7 0.6 0.5
EER, % 17.6 18.7 21.2 24.2 27.5 31.4
Table 2: Equal error rates for DMECB features of different
orders.
DMECB
1.0−p
2
, p
2
0.9 0.8 0.7 0.6 0.5
EER, % 19.7 19.4 18.9 18.3 17.8
Table 3: Summary of equal error rates for different feature
types and their SVM combination.
Feature type
EER, % Feature type EER, %
MFCC+∆+∆∆ 9.5 Residual phase 21.5
MLSF+∆+∆∆ 16.0 pH
4+6+12
20.8
MECB
1.0
17.6 DMECB
1.0−0.5
17.8
Combined 8.7
Combination of Features. To make the results
comparable to those of acoustic features alone a 5-
fold cross-validation scheme was applied. The test
set of speakers was divided into 5 approximately
equal parts. Every time one different part was left
for testing and four others were used for training
the SVM, resulting in 5 experiments in total. The
SVM was designed to produce a soft decision, which
BIOSIGNALS 2008 - International Conference on Bio-inspired Systems and Signal Processing
222
0.1 0.2 0.5 1 2 5 10 20 40
0.1
0.2
0.5
1
2
5
10
20
40
False acceptance rate (%)
False rejection rate (%)
MFCC+!+!! EER 9.5%
(a) MFCC
0.1 0.2 0.5 1 2 5 10 20 40
0.1
0.2
0.5
1
2
5
10
20
40
False acceptance rate (%)
False rejection rate (%)
MLSF EER 18.8%
MLSF+! EER 16.4%
MLSF+!+!! EER 16.0%
(b) MLSF
0.1 0.2 0.5 1 2 5 10 20 40
0.1
0.2
0.5
1
2
5
10
20
40
False acceptance rate (%)
False rejection rate (%)
LP 6, EER 21.5%
LP 10, EER 22.0%
(c) Residual Phase
0.1 0.2 0.5 1 2 5 10 20 40
0.1
0.2
0.5
1
2
5
10
20
40
False acceptance rate (%)
False rejection rate (%)
pH
4
EER 29.0%
pH
6
EER 29.1%
pH
12
EER 29.0%
pH
4+6+12
EER 20.8%
(d) pH
0.1 0.2 0.5 1 2 5 10 20 40
0.1
0.2
0.5
1
2
5
10
20
40
False acceptance rate (%)
False rejection rate (%)
MECB
0.5
EER 31.4%
MECB
0.6
EER 27.5%
MECB
0.7
EER 24.2%
MECB
0.8
EER 21.2%
MECB
0.9
EER 18.7%
MECB
1.0
EER 17.6%
(e) MECB
0.1 0.2 0.5 1 2 5 10 20 40
0.1
0.2
0.5
1
2
5
10
20
40
False acceptance rate (%)
False rejection rate (%)
DMECB
1.0!0.5
EER 17.8%
DMECB
1.0!0.6
EER 18.3%
DMECB
1.0!0.7
EER 18.9%
DMECB
1.0!0.8
EER 19.4%
DMECB
1.0!0.9
EER 19.7%
(f) DMECB
Figure 1: DET curves for different feature types.
0.1 0.2 0.5 1 2 5 10 20 40
0.1
0.2
0.5
1
2
5
10
20
40
False acceptance rate (%)
False rejection rate (%)
MFCC+!+!! EER 9.5%
SVM Combination EER 8.7%
Figure 2: DET curve for combination of acoustic features.
was then treated as a score for plotting the DET
curve and calculating the EER. It was decided to
combine MFCC+∆ + ∆∆, MLSF+∆ + ∆∆, Resid-
ual Phase with LP of order 6, pH
4+6+12
, MECB
1.0
,
and DMECB
1.0−0.5
, choosing one feature from each
group with the best performance. The results of the
combination are shown in Fig. 2 with the EER in Ta-
ble 3 with the DET curve for the MFCC+∆+∆∆ plot-
ted for comparison.
5 CONCLUSIONS
As assessed on NIST 2001 SRE database, none of the
novel acoustic features considered in this study out-
performed the MFCC features. MLSF and MECB
features have performance that is comparable to that
of MFCC. Features pH showed a high accuracy of
speaker verification taking into account their low di-
mensionality (5, 4, and 3 for pH
4
, pH
6
, and pH
12
re-
spectively), hence they may be attractive when lim-
ited training data is available. Combination of several
different acoustic features resulted in significantly
higher accuracy of speaker verification. We can con-
clude that the studied features carry additional infor-
mation about speakers. How big is the contribution of
each of the features into the speaker verification accu-
racy, however, needs to be established. To determine
this either all possible feature combinations have to
be tried, or feature selection methods have to be used.
REFERENCES
Cordeiro, H. and Ribeiro, C. (2006). Speaker characteriza-
tion with MLSF. In Odyssey 2006: The Speaker and
Language Recognition Workshop, San Juan, Puerto
Rico.
Gish, H. and Schmidt, M. (1994). Text-independent speaker
identification. IEEE Signal Processing Magazine,
pages 18–32.
Reynolds, D. and Rose, R. (1995). Robust text-independent
speaker identification using Gaussian mixture speaker
models. IEEE Trans. Speech Audio Process., 3(1):72–
83.
Sant’Ana, R., Coehlo, R., and Alcaim, A. (2006). Text-
independent speaker recognition based on the Hurst
parameter and the multidimensional fractional Brow-
nian motion model. IEEE Trans. Acoust., Speech, Sig-
nal Process., 14(3):931–940.
Sri Rama Murty, K. and Yegnanarayana, B. (2006). Com-
bining evidence from residual phase and MFCC fea-
tures for speaker recognition. IEEE Signal Process.
Lett., 13(1):52–55.
Wang, J. and Wang, J. (2005). Speaker recognition using
features derived from fractional Fourier transform. In
4th IEEE Workshop on Automatic Identification (Au-
toID 2005), Buffalo, NY, USA.
Zheng, N. H. and Ching, P. C. (2004). Using Haar
transformed vocal source information for automatic
speaker recognition. In Proc. IEEE ICASSP, vol-
ume 1, pages 77–80, Montreal, Canada.
COMPARATIVE STUDY OF SEVERAL NOVEL ACOUSTIC FEATURES FOR SPEAKER RECOGNITION
223
