
USE OF CEPSTRUM-BASED PARAMETERS FOR AUTOMATIC
PATHOLOGY DETECTION ON SPEECH
Analysis of Performance and Theoretical Justification
Rub´en Fraile, Juan Ignacio Godino-Llorente, Nicol´as S´aenz-Lech´on, V´ıctor Osma-Ruiz
Department of Circuits & Systems Engineering, Universidad Polit´ecnica de Madrid
Carretera de Valencia Km 7, 28031 Madrid, Spain
Pedro G´omez-Vilda
Department of Computer Systems’ Architecture and Technology, Universidad Polit´ecnica de Madrid
Campus de Montegancedo s/n, Boadilla del Monte, 28660 Madrid, Spain
Keywords:
Speech analysis, Pattern classification.
Abstract:
The majority of speech signal analysis procedures for automatic pathology detection mostly rely on parameters
extracted from time-domain processing. Moreover, calculation of these parameters often requires prior pitch
period estimation; therefore, their validity heavily depends on the robustness of pitch detection. Within this
paper, an alternative approach based on cepstral-domain processing is presented which has the advantage of
not requiring pitch estimation, thus providing a gain in both simplicity and robustness. While the proposed
scheme is similar to solutions based on Mel-frequency cepstral parameters, already present in literature, it has
an easier physical interpretation while achieving similar performance standards.
1 INTRODUCTION
Analysis of recorded speech is an attractive method
for pathology detection since it is a low-cost non-
invasive diagnostic procedure (Boyanov and Had-
jitodorov, 1997). Although there is a wide range
of causes for pathological voice (functional, neural,
laryngeal, etc.) and a correspondingly wide range
of acoustic parameters has been proposed for its de-
tection (see (Jackson-Menaldi, 2002) for summaris-
ing tables and typical values), these intend to detect
speech signal features that may be roughly classified
in only three classes (Godino-Llorente et al., 2006b):
• Short-term frequency perturbations: both in fun-
damental frequency and in formants.
• Short-term amplitude perturbations.
• Noise or, more specifically, speech-to-noise ratio.
Calculation of above-mentioned acoustic parame-
ters requires previous and reliable detection of speech
fundamental frequency(pitch) (Deliyski, 1993) (Boy-
anov and Hadjitodorov, 1997). Nevertheless, pitch
detection is not an easy task due to its sensitiveness to
noise, signal distorsion, speech formants, etc. (Boy-
anov et al., 1993).
An alternative approach to speech signal analy-
sis is doing it in cepstral domain, more specifically
in Mel-frequency cepstral domain. Such approach,
consisting in classifying patterns of so-called Mel-
frequency cepstral coefficients (MFCC), does not re-
quire prior pitch estimation and has proven to be
fairly robust against different kinds of speech distor-
tion (Bou-Ghazale and Hansen, 2000), including that
of telephone channel (Fraile et al., 2007), and reason-
ably independent of the particular way in which com-
putations may be implemented (Ganchev et al., 2005).
For these reasons, their application to automatic voice
pathology detection has been proposed during the
last years (Godino-Llorente and G´omez-Vilda, 2004).
Yet, to authors’ knowledge, up to now no physical ex-
planation exists on the meaning of MFCC and their
relevance on pathology detection.
Within this paper, a new scheme for automatic
voice pathology detection is proposed. This lies
half-way between usual cepstral domain and Mel-
frequency cepstral domain. Namely, it takes profit
from the conceptual interpretation of cepstral process-
ing of speech signals (Deller et al., 1993), the pat-
tern separation capability of cepstral distances (Ra-
biner and Juang, 1993) and the smoother spectrum es-
85
Fraile R., Ignacio Godino-Llorente J., Sáenz-Lechón N., Osma-Ruiz V. and Gómez-Vilda P. (2008).
USE OF CEPSTRUM-BASED PARAMETERS FOR AUTOMATIC PATHOLOGY DETECTION ON SPEECH - Analysis of Performance and Theoretical
Justification.
In Proceedings of the First International Conference on Bio-inspired Systems and Signal Processing, pages 85-91
DOI: 10.5220/0001059600850091
Copyright
c
SciTePress

timation provided by the filter banks in MFCC calcu-
lation (Rabiner and Juang, 1993). The mathematical
formulation of both cepstrum and MFCC parameters
is revised in section 2, while the newly proposed set
of parameters is introduced in section 3. The results
from the application of these features to the detection
of pathologies on voices belonging to a commercial
database are reported in section 4. Last, the conclu-
sions are presented in section 5.
2 MATHEMATICAL
FORMULATION
2.1 Short-time Fourier Transform
As stated in previous section, the variability of speech
signal is a key feature for pathology detection. The
need for detecting such variability leads to the conve-
nience of employing short-time techniques for speech
processing. For this reason, in the following lines the
mathematical framework for short-time processing of
speech provided in (Deller et al., 1993) is revised.
Let x[n] be a speech signal composed by N sam-
ples (n= 0···N−1) obtained at a sampling frequency
equal to f
s
; then it can be segmented in frames defined
by:
f [n;m] = x[n] · w[m− n] (1)
where w[n] is the framing window:
w[n] = 0 if n < 0 or n ≥ L (2)
and L is the frame length. Consequently, f [n;m] has
non-zero values only for n ∈ [m − L + 1,m]. If con-
secutive speech frames are overlapped a number of l
0
samples, then m may have the following values:
m = L+ p · (L− l
0
) − 1 (3)
where p is the frame index and it is an integer such
that:
0 ≤ p ≤
N − L
L− l
0
(4)
Considering the relation between the frame shift
m and the frame index p, frames without time shift
reference may be renamed as:
g
p
[n] = f [n+ m− L+ 1;m] =
= f [n+ p · (L− l
0
);m] = (5)
= x[n+ p· (L− l
0
)] · w[(L− 1)− n]
where n = 0· · · L − 1. From these speech frames,
the short-term Discrete Fourier Transform (stDFT) is
computed as:
S
p
(k) =
N
DFT
−1
∑
n=0
eg
p
[n] · e
− j·
2π
N
DFT
·kn
(6)
where N
DFT
is the number of points of the stDFT, k =
0···N
DFT
− 1 and:
eg
p
[n] =
g
p
[n] if 0 ≤ n < L
0 otherwise
(7)
thus, if N
DFT
≥ L then (6) is equal to:
S
p
(k) =
L−1
∑
n=0
g
p
[n] · e
− j·
2π
N
DFT
·kn
(8)
The frequency values that correspond to each stDFT
coefficient are:
f
k
=
f
s
·
k
N
DFT
if k ≤
N
DFT
2
f
s
·
k−N
DFT
N
DFT
if k >
N
DFT
2
(9)
2.2 Short-time Cepstrum
In (Deller et al., 1993), an algorithm for computing
the short-time cepstrum from the stDFT is given, un-
der the assumption that N
DFT
>> L:
c
p
[q] =
1
N
DFT
·
N
DFT
−1
∑
k=0
log|S
p
(k)| · e
j·
2πk
N
DFT
·q
(10)
A physical interpretation of cepstrum can be de-
rived from the discrete-time model for speech pro-
duction that can also be found in (Deller et al., 1993).
This model may be written in frequency domain as:
S
e
jΩ
= E
e
jΩ
· G
e
jΩ
· H
e
jΩ
(11)
where S
e
jΩ
is the speech, E
e
jΩ
is the impulse
train corresponding to the fundamental frequency and
its harmonics, G
e
jΩ
is the glottal pulse wave-
form that modulates the impulse train and H
e
jΩ
is,
herein, the combined effect of vocal tract and lip ra-
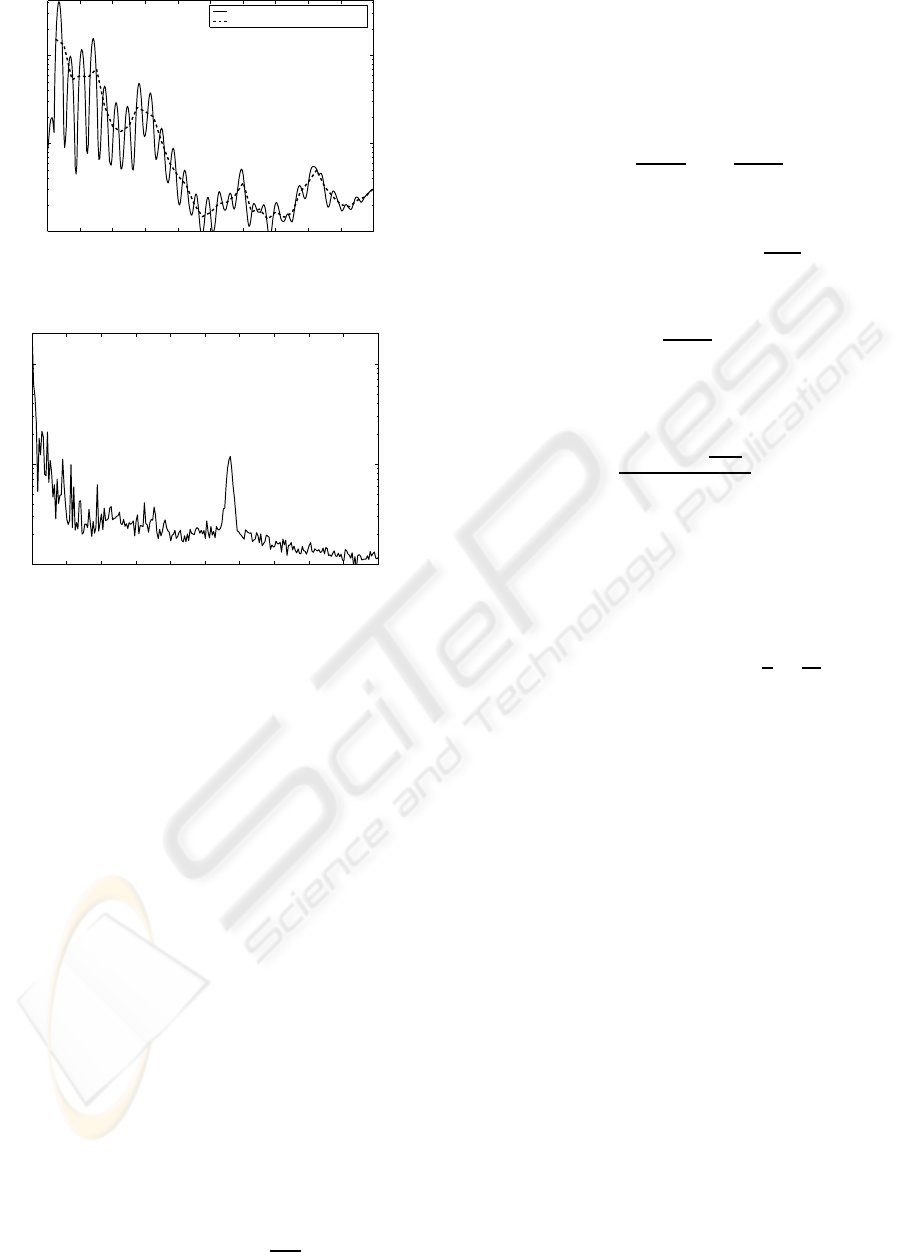
diation. These components can be appreciated in fig-
ure 1, which corresponds to the average modulus of
the short-term DFT calculated from one of the voice
records belonging to the database referred in section
4.1.
The quick impulse-like variations in figure 1 cor-
respond to the pitch harmonics E
e
jΩ
, and the evo-
lution of the impulse amplitude envelope is related
to the glottal waveform G
e
jΩ
and the formants in-
duced by the vocal tract H
e
jΩ
. These formants cor-
respond to the three envelope peaks with a decreas-
ing level of energy that are centered at 750 Hz, 1375
Hz and 3000 Hz. In fact, these center frequencies
BIOSIGNALS 2008 - International Conference on Bio-inspired Systems and Signal Processing
86
0 500 1000 1500 2000 2500 3000 3500 4000 4500 5000
10
−1
10
0
10
1
Frequency (Hz)
E [ | S ( e
j Ω
) | ]
Original speech signal
Speech filtered in frequency domain
Figure 1: Average modulus of the short-term DFT for one
voice record.
0 1 2 3 4 5 6 7 8 9 10
10
−2
10
−1
10
0
Quefrency (ms)
Figure 2: Short term cepstrum averaged for all frames of
the same voice record as used for figure 1.
are coherent with the range of typical values given in
(Jackson-Menaldi, 2002).
The logarithm operation in (10) converts the prod-
ucts in (11) into sums. Consequently, it allows the
cepstrum to separate fast from slow signal variations
in frequency domain. This widely known fact is il-
lustrated in figure 2, where the peak around 5.7 ms
clearly identifies the fundamental frequency (175 Hz)
and the values below 2 ms correspond to the spectrum
envelope.
2.3 Short-time MFCC
Once the stDFT of a speech signal is available, an-
other option for further processing, as mentioned in
section 1, is the calculation of short-time MFCC (stM-
FCC) parameters. For stMFCC computation, only the
positive part of the frequency axis is considered (Ra-
biner and Juang, 1993), that is, f
k
≥ 0 and, therefore,
k ≤ N
DFT
/2. In order to calculate stMFCC coeffi-
cients, a transformation is applied to the frequencies
so as to convert them to Mel-frequencies f
m
k
(Godino-
Llorente and G´omez-Vilda, 2004):
f
m
k
= 2595· log
10
1+
f
k
700
(12)
and the stDFT is further processed through band-pass
integration along M equally long Mel-frequency in-
tervals, being M = ⌊3· log
10
f
s
⌋ ( ⌊·⌋ means round-
ing to the previous integer). Namely, the i
th
interval
(i = 1· · · M) in Mel-domain is defined by:
I
m
i
=
F
m
·
i− 1
M + 1
,F
m
·
i+ 1
M + 1
(13)
where F
m
is the maximum Mel-frecuency:
F
m
= max
k
f
m
k
= 2595· log
10
1+
f
s
/2
700
(14)
and the interval length in Mel-domain is given by:
L(I
m
i
) =
2
M + 1
· F
m
(15)
According to previous equations, the N
DFT
stDFT
coefficients are transformed to M frequency compo-
nents as follows:
e
S
p
(i) =
∑
f
k
∈I
i
1−
f
m
k
− F
m
·
i
M+1
L(I
m
i
)/2
!
· |S
p
(k)| (16)
Last, the q
th
(q = 1··· Q) stMFCC of the p
th
speech frame, where Q is the desired length of the
Mel-cepstrum, is given by cosine transform of the
logarithm of the smoothed “Mel-spectrum” (Rabiner
and Juang, 1993):
ec
p
[q] =
M
∑
i=1
log
e
S
p
(i)
· cos
q·
i−
1
2
·
π
M
(17)
3 CEPSTRAL COEFFICIENTS
BASED ON SMOOTHED
SPECTRUM
3.1 Justification
As stated in section 1, while MFCC parameters ex-
hibit both good performanceand robustness in feature
extraction from speech, they lack a clear physical in-
terpretation. On the opposite, cepstrum has a physical
meaning (recall section 2.2), yet raw cepstrum coef-
ficients are not as useful for speech parametrisation.
In the next paragraphs, the reasons for these facts are
exposed.
Cepstrum calculation, as formulated in (10), is
based on the spectrum estimate provided by the ab-
solute value of the stDFT. Due to the logarithm,
this gives a result that is proportional to the case of
periodogram-based spectrum estimation. However,
such estimation is very dependent on the specific val-
ues of the original speech frame. A more robust spec-
trum estimate can be obtained by smoothing of the
USE OF CEPSTRUM-BASED PARAMETERS FOR AUTOMATIC PATHOLOGY DETECTION ON SPEECH -
Analysis of Performance and Theoretical Justification
87

periodogram (Blackman and Tukey method, (Proakis
and Manolakis, 1996)). In fact, this is what (16) ex-
presses in the calculation of MFCC. Therefore, filter-
ing of the stDFT may be assumed to be one of the
sources of MFCC robustness.
In contrast, an explanation for the lack of clear
interpretation of MFCC also lies in the meaning of
(16). According to that equation, stDFT smoothing
for MFCC computation is carried out with a variable-
length filter, that is, a Bartlett window whose length
decreases for lower frequency bands. Moreover, the
smoothed stDFT is downsampled to obtain only M
samples in the interval [0, f
s
/2] that are not uniformly
spaced (Rabiner and Juang, 1993). While the down-
sampling is positive in the sense that it reduces the di-
mensionality of the problem, its non-uniformness, to-
gether with the previous variable-length filtering, ob-
scures the interpretation of the output of the cosine
transform in (17).
From the previous reasoning, if stDFT is
smoothed with a fixed-length filter and its output is
uniformly decimated prior to the logarithm compu-
tation, the cepstral coefficients in (10) can be trans-
formed to a more robust parameter set. Moreover, this
is achieved while keeping the physical meaning of
cepstrum, since the output of the first operation gives
an improved spectrum estimate and the second only
limits the length of cepstrum in quefrency domain.
3.2 Formulation
Starting from (8), if the stDFT modulus is smoothed
with a Bartlett window of constant length equal to ∆f
then the following output is obtained:
S
′
p
(i) =
∑
f
k
∈I
i
1−
f
m
k
− i· ∆f/2
∆f/2
!
· |S
p
(k)| (18)
where I
i
= [∆f · (i− 1)/2, ∆ f · (i+ 1)/2] and the
Bartlett window has been chosen for similarity with
(16). Herein, only the positive part of the frequency
axis has been considered, as in section 2.3.
If the filtered stDFT is decimated so as to keep
only the outputs of consecutive windows with a 50%
overlap, this is equivalent to decimation by a fac-
tor D = ⌊∆ f · N
DFT
/(2· f
s
)⌋. The modified cepstrum
then becomes:
c
′
p
[q] =
D
N
DFT
·
N
DFT
2·D
∑
k=0
log
S
′
p
(k· D)
· (19)
· cos
(k− 1) ·
2πD
N
DFT
· q
where only the positive frequencies have been con-
sidered, hence computing the inverse DFT as a cosine
transform as in (17). c
′
p
[q] has the twofold advantage
over c
p
[q] of being based on a smoother spectrum es-
timate S
′
p
(i) and having a period length that has been
reduced by a factor D, thus providing some dimen-
sionality reduction.
3.3 Cepstral Distances
Differences in cepstrum can be used for speech signal
classification. An example of such usage is the defi-
nition of the cepstral distance in (Rabiner and Juang,
1993) as the norm of the vector resulting form sub-
straction of the two cepstra to be compared. This,
if directly applied to pathology detection, would re-
sult in comparing the cepstrum of consecutive speech
frames so as to assess the variability of the signal.
Mathematically:
d
2
p
=
N
DFT
D
−1
∑
q=0
c
′
p+1
[q] − c
′
p
[q]
2
(20)
However, bearing in mind the physical interpreta-
tion of cepstrum, this definition has the drawback of
mixing pitch variations with formant and glottal pulse
variations. To overcome this problem an individual
frame-to-frame cepstral parameter variation analysis
is proposed:
d
p
[q] =
c
′
p+1
[q] − c
′
p
[q]
(21)
This way, analysis of the distribution of d
p
[q] re-
lated to speech formant and glottal pulse variability
(low values of q) can be isolated from pitch changes
associated to values of q around the pitch period.
4 APPLICATION AND RESULTS
For the purpose of performance analysis, the modi-
fied cepstral parameters presented in previous section
have been applied to the problem of automatic pathol-
ogy detection on recorded voice. The results have
been compared to those produced by MFCC. Within
this section, first the voice database is presented, sec-
ond the used parameter set is specified, third the clas-
sifier is described and, last, the results are shown and
commented.
4.1 Database
The voice records used in this investigation are the
same as in (Godino-Llorente et al., 2006a). They be-
BIOSIGNALS 2008 - International Conference on Bio-inspired Systems and Signal Processing
88

long to a database distributed by the company Kay El-
emetrics (Kay Elemetrics Corp., 1994). The recorded
sounds correspond to sustained phonations (1-3 s
long) of the vowel /ah/ from patients with either nor-
mal or disordered voice. Such voice disorders belong
to a wide variety of organic, neurological, traumatic
and psychogenic classes. Sampling rate of speech
records has been made uniform for all of them and
equal to 25 kHz, while the coding has a resolution
of 16 bits. The subset taken from the database con-
tains 53 normal and 173 pathological speakers which
are uniformly distributed in age and gender (Godino-
Llorente et al., 2006a).
4.2 Parameter Sets
For each speech record, cepstrum-based coefficients,
as defined in (19), have been calculated. Namely, a
filter length ∆f = 200 Hz has been chosen for sfDFT
smoothing. As a consequence, a cepstrum length
of ( f
s
− ∆f/2)/(∆f/2) = 124 samples results. The
choice of ∆ f is consistent to the approximate length
of the low-band filters used for MFCC calculation (re-
call (16)). At first sight, however, it has the draw-
back of loosing pitch information of the signal spec-
trum. This is illustrated in figure 1 where the filtered
DFT has been plotted with a dashed line. Neverthe-
less, such filtered spectrum contains information on
both harmonic-to-noise ratio (HNR) and glottal pulse
waveform (Murphy and Akande, 2005) and HNR is
a useful parameter for pathology detection that is
closely related to both frequency and amplitude per-
turbations of pitch (Jackson-Menaldi, 2002).
Since cepstrum contains information on total sig-
nal energy and its distribution among formants, the
whole sequence is used as part of the parameter set.
As well as the cepstrum, information on its variability
is used as an input for the pathology detector. More
specifically, the mean and variance of d
p
[q] for each
value of q are used as descriptors of the cepstrum vari-
ability. Therefore, on the whole, a parameter vector of
124× 3 elements is produced.
For the sake of comparison, another classifier
based on a parameter vector consisting of M =
⌊3· log
10
f
s
⌋ = 13 MFCC coeficients averaged for all
signal frames has also been tested.
4.3 Classifier Description
For both classification schemes, a Multilayer Percep-
tron (MLP) with two hidden layers, each consisting of
4 neurons, and a single-neuron output layer has been
used as a classifier. All neurons have logistic activa-
tion functions. An MLP with a single hidden layer
10
−2
10
−1
10
0
10
−2
10
−1
10
0
False alarm probability
Miss probability
Detector based on MFCC
Detector based on modified cepstrum
Figure 3: DET plot for MFCC based and modified cepstrum
based classifiers.
having 50 neurons was utilised in (Godino-Llorente
and G´omez-Vilda, 2004). The structure herein pro-
posed, in contrast, has less free parameters, thus al-
lowing a faster learning, and the reduced number of
neurons is compensanted by the introduction of an
additional hidden layer that permits learning of more
complex relations (Haykin, 1994).
4.4 Results
The MLP classifier has been trained with 70% of
available speech records in such a way that its out-
put is expected to be “1” for pathological voices and
“0” for normal voices. The remaining 30% of records
have been used for testing. The experiment has been
repeated 20 times, each of them with different, ran-
domly chosen, training sets. The average results for
both MFCC and herein presented cepstrum-based pa-
rameters are drawn in the DET plot (Martin et al.,
1997) of figure 3.
Plotted results indicate that the performance of the
classifier based on the newly proposed set of param-
eters is in the same order of magnitude than that of
MFCC parameters. To be specific, in terms of equal
error rate (EER), that is, for false alarm rate equal
to miss rate, the MFCC-based classification yields
an experimental error probability of 15% while the
cepstrum-based classification error probability for the
same conditions is 14%. Considering that within this
experiment the task of fine-tuning the classifier has
not been carried out and that the MLP has been cho-
sen as a standard for comparison, the difference in the
results is not significant.
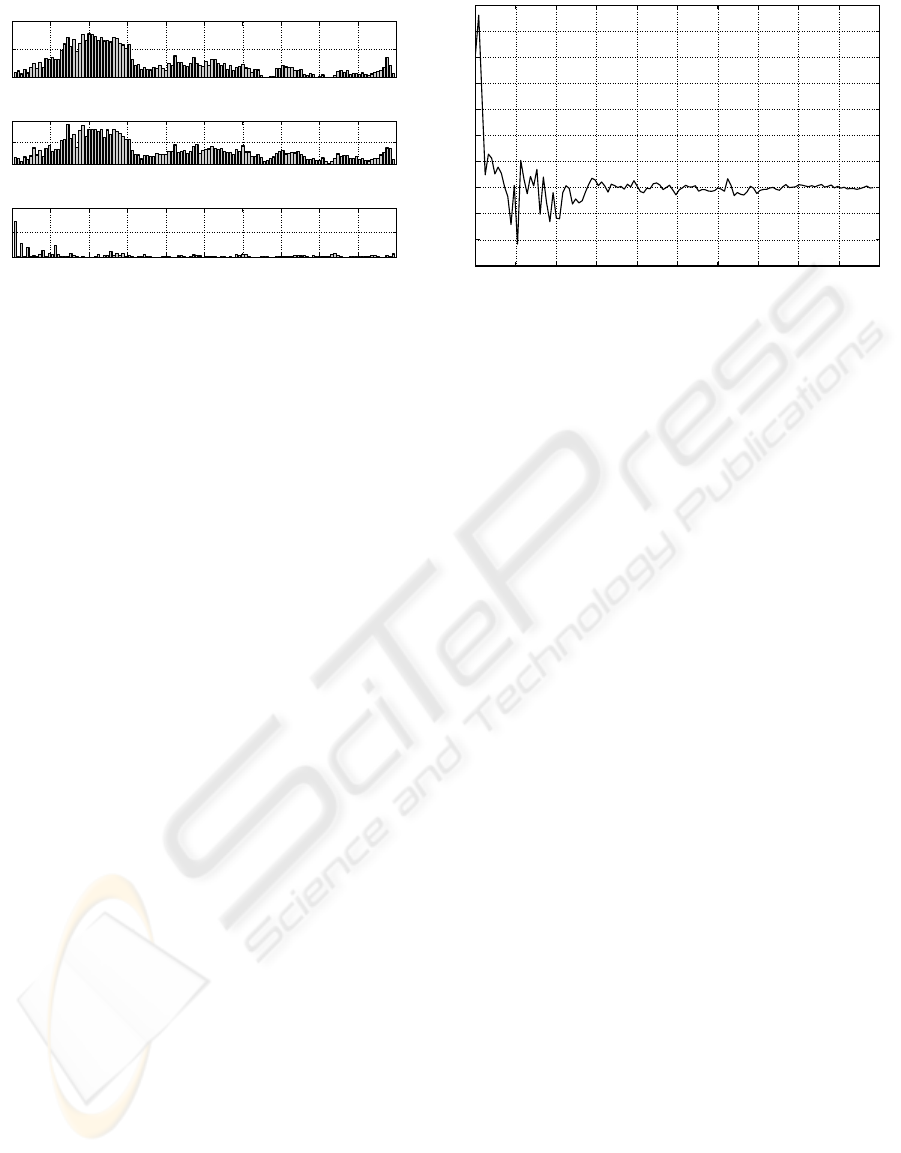
In order to acquire a deeper understanding of the
reasons for these results, an analysis of the relevance
of cepstrum-based parameters for speech classifica-
tion as either pathological or not has been realised.
Such analysis is based on the evaluation of the Fisher
criterion (Duda et al., 2001) for each individual pa-
rameter. The results, differentiated for the three sub-
sets of parameters (modified cepstrum, variance of
USE OF CEPSTRUM-BASED PARAMETERS FOR AUTOMATIC PATHOLOGY DETECTION ON SPEECH -
Analysis of Performance and Theoretical Justification
89
0 0.5 1 1.5 2 2.5 3 3.5 4 4.5 5
0
1
2
Quefrency (ms)
Fisher criterion
Variance of d
p
[q]
0 0.5 1 1.5 2 2.5 3 3.5 4 4.5 5
0
1
2
Quefrency (ms)
Fisher criterion
Average of d
p
[q]
0 0.5 1 1.5 2 2.5 3 3.5 4 4.5 5
0
1
2
Quefrency (ms)
Fisher criterion
Average modified cepstrum c’
p
[q]
Figure 4: Value of Fisher criterion for each cepstral param-
eter.
differences and average of absolute differences) are
plotted in figure 4.
According to this plot, the most relevant cepstral
parameters for pathology detection maybe roughly
classified into two groups:
• The modified cepstrum values with lowest indices
(plot at the bottom of figure 4): these are related
to the slowest components of the spectrum enve-
lope in figure 1, which, on their side, are asso-
ciated to spectral noise levels and HNR (Murphy
and Akande, 2005).
• The frame-to-frame variations in cepstrum-based
coefficients whose quefrecies are within the inter-
val [0.5,1.5] miliseconds approximately: coeffi-
cients within that interval correspond to the short
frequency range components of the spectrum en-
velope. These components, as justified in section
2.2, are related to glottal waveform and speech
formants. However, this information itself does
not help to discriminate the presence of pathology,
as indicated by the low values of the Fisher crite-
rion in the bottom plot of figure 4. Instead, frame-
to-frame variations of these factors are muchmore
relevant, as depicted in the other two plots of the
same figure.
To be more specific, since the voice records of the
database used for this experiment correspond to sus-
tained vowel phonations, it can be assumed that the
vocal tract has very little variations, hence formants
do not change and the second group of parameters
should be more closely related to changes in the glot-
tal waveform. As for the limits of the quefrency in-
terval in which parameters from the second group are
relevant, the lower limit of 0.5 ms corresponds to the
quefrency band that separates slow components of the
spectrum envelope (first group of parameters) from
faster components (associated to the second set); on
the other hand, the upper limit of 1.5 ms corresponds
to the highest quefrency range at which the modified
0 0.5 1 1.5 2 2.5 3 3.5 4 4.5 5
−30
−20
−10
0
10
20
30
40
50
60
70
Quefrency (ms)
Figure 5: 124 modified cepstral parameters from one of the
database’s voice records.
cepstrum c
′
p
[q] has significant values. This is shown
in figure 5, where a plot of the frame-averaged modi-
fied cepstrum of one voice record is depicted.
5 CONCLUSIONS
Speech parametrisation in cepstral domain is a useful
technique for automatic pathology detection. Specifi-
cally, MFCC have been successfully used for this pur-
pose. While the computation of these parameters has
an intrinsic robustness due to its independency from
pitch extraction and the spectrum filtering, their phys-
ical interpretation is obscure because of the non-linear
Mel-frequency transformation.
Within this paper an alternative set of cepstrum-
based parameters has been proposed. Such param-
eters share the robustness of MFCC since they do
not require pitch estimation and filtering of the es-
timated speech spectrum is also performed. In con-
trast to MFCC, the calculation of these newly pro-
posed parameters does not involve any non-linear fre-
quency transformation and, consequently, their phys-
ical interpretation remains clear. Namely, their val-
ues have been shown to be related to the amount of
noise energy present in speech and the glottal wave-
form variability. Both factors are directly associated
to laringeal pathologies.
Finally, the performance of the proposed cepstral
parameters for pathology detection has been tested
using a MLP classifier and results have been com-
pared to those of MFCC. The obtained misclassifica-
tion rates indicate that the performances of both sets
of parameters are similar. Moreover, a deeper analy-
sis on the individual impact of each parameter on the
classification task has revealed that the most relevant
parameters are those more closely linked to the above-
mentioned two factors: noise energy and glottal wave
variations.
BIOSIGNALS 2008 - International Conference on Bio-inspired Systems and Signal Processing
90

ACKNOWLEDGEMENTS
This research was carried out within projects funded
by the Ministry of Science and Technology of
Spain (TEC2006-12887-C02) and the Universidad
Polit´ecnica de Madrid (AL06-EX-PID-033).
REFERENCES
Bou-Ghazale, S. E. and Hansen, J. H. L. (2000). A compar-
ative study of traditional and newly proposed features
for recognition of speech under stress. IEEE Transac-
tions on Speech and Audio Processing, 8(4):429–442.
Boyanov, B. and Hadjitodorov, S. (1997). Acoustic analysis
of pathological voices. A voice analysis system for the
screening of laryngeal diseases. IEEE Engineering in
Medicine and Biology, 16(4):74–82.
Boyanov, B., Ivanov, T., Hadjitodorov, S., and Chollet, G.
(1993). Robust hybrid pitch detector. IEE Electronics
Letters, 29(22):1924–1926.
Deliyski, D. D. (1993). Acoustic model and evaluation
of pathological voice production. In Proceedings of
the 3
rd
Conference on Speech Communication and
Technology (EUROSPEECH’93), pages 1969–1972,
Berlin (Germany).
Deller, J. R., Proakis, J. G., and Hansen, J. H. L. (1993).
Discrete-time processing of speech signals. Macmil-
lan Publishing Company, New York (USA).
Duda, R. O., Hart, P. E., and Stork, D. G. (2001). Pattern
classification. John Wiley & sons, New York (USA),
2
nd
edition.
Fraile, R., Godino-Llorente, J. I., S´aenz-Lech´on, N., Osma-
Ruiz, V., and G´omez-Vilda, P. (2007). Analysis of
the impact of analogue telephone channel on mfcc pa-
rameters for voice pathology detection. In 8
th
INTER-
SPEECH Conference (INTERSPEECH 2007), pages
1218–1221, Antwerp (Belgium).
Ganchev, T., Fakotakis, N., and Kokkinakis, G. (2005).
Comparative evaluation of various MFCC implemen-
tations on the speaker verification task. In Proceed-
ings of the 10
th
International Conference on Speech
and Computer (SPECOM 2005), pages 191–194, Pa-
tras (Greece).
Godino-Llorente, J. I. and G´omez-Vilda, P. (2004). Au-
tomatic detection of voice impairments by means of
short-term cepstral parameters and neural network
based detectors. IEEE Transactions on Biomedical
Engineering, 51(2):380–384.
Godino-Llorente, J. I., G´omez-Vilda, P., and Blanco-
Velasco, M. (2006a). Dimensionality reduction of a
pathological voice quality assessment system based
on gaussian mixture models and short-term cepstral
parameters. IEEE Transactions on Biomedical Engi-
neering, 53(10):1493–1953.
Godino-Llorente, J. I., S´aenz-Lech´on, N., Osma-Ruiz, V.,
Aguilera-Navarro, S., and G´omez-Vilda, P. (2006b).
An integrated tool for the diagnosis of voice disorders.
Medical Engineering & Physics, 28(3):276–289.
Haykin, S. (1994). Neural Networks: a comprehensive
foundation. Macmillan College Publishing Company,
New York (USA), 1
st
edition.
Jackson-Menaldi, M. C. A. (2002). La voz patol´ogica.
Editorial M´edica Panamericana, Buenos Aires (Ar-
gentina).
Kay Elemetrics Corp. (1994). Disordered voice
database.version 1.03.
Martin, A., Doddington, G., Kamm, T., Ordowski, M., and
Przybocki, M. (1997). The DET curve in assess-
ment of detection task performance. In Proceedings
of the 5
th
Conference on Speech Communication and
Technology (EUROSPEECH’97), pages 1895–1898,
Rhodes (Greece).
Murphy, P. J. and Akande, O. O. (2005). Quantification
of glottal and voiced speech harmonics-to-noise ratios
using cepstral-based estimation. In Proceedings of the
3
th
International Conference on Non-Linear Speech
Processing (NOLISP’05), pages 224–232, Barcelona
(Spain).
Proakis, J. G. and Manolakis, D. G. (1996). Digital Sig-
nal Processing. Principles, Algorithms and Applica-
tions. Prentice-Hall International, New Jersey (USA),
3
rd
edition.
Rabiner, L. and Juang, B. H. (1993). Fundamentals of
speech recognition. Prentice-Hall, Englewood Cliffs
(USA).
USE OF CEPSTRUM-BASED PARAMETERS FOR AUTOMATIC PATHOLOGY DETECTION ON SPEECH -
Analysis of Performance and Theoretical Justification
91
