
SOFTWARE FOR EMBEDDED CONTROLLER DESIGN
Application in Air and Water Caloric Electronystagmographic Stimulators
C. Richter, P. Mendes, M. Tavares
Biomedical Engineering Laboratory, Catholic University of Pelotas, Rua Felix da Cunha 412, Pelotas, Brazil
V. Alves
PDI, Contronic Sistemas Automaticos Ltda., Rua Rudi Bonow, 275, Pelotas, Brazil
Keywords: Controller design, digital control, control systems modelling, water caloric stimulator, air caloric stimulator,
electronystagmography.
Abstract: This paper describes the development and tests of a software which was projected to support the work of
designing and testing dedicated embedded controllers. It was developed to accomplish two main features:
helping to model the physical system to be controlled; and helping to easily implement and test a proposed
controller to be applied to the physical system. Two practical applications are presented. The first one is the
design of a temperature controller for a new version of a water caloric stimulator named E96, which has as
main requirement fast and accurate temperature response with no overshoot. The second one is also a caloric
stimulator, but the transfer media is air instead of water. Those equipments help otorhinolaryngologists in
electronystagmography exam. Details on the caloric stimulators hardware and software, the proposed
controllers and the results, are presented. The software was considered functional for the proposed applications.
1 INTRODUCTION
Digital control of a physical system, or plant, can be
accomplished using a computer with internal
software containing the algorithm that controls,
through D/A conversion, the plant input variable.
Closed-loop digital control requires the measurement
and A/D conversion of the plant output variable.
Many different kinds of digital controllers can be
used for controlling different physical plants with
the most variable range of requirements. Examples
of requirements are the percent overshoot and the
settling time for the step response of the plant (Dorf,
2001). Prior to the controller design is the modeling
of the plant, which requires a modeling technique
using, for example, the graphical analysis of the
open-loop step response of the plant (Coelho, 2004).
The main motivation for the developed software
PACD (Plataforma para Aplicação de
Controladores Digitais, Digital Controllers
Application Platform) was to create a software that,
with the aid of an already existent hardware, would
help modelling a physical system to be controlled,
and additionally help designing a suitable controller
for it, which would be validated through real tests.
Such an ensemble of software and hardware would
be helpful for designing and testing dedicated
controllers, which later can be executed from
microcontrollers or general purpose low cost DSPs,
attempting to develop embedded dedicated
controllers. The first practical application of the
software PACD was to design temperature
controllers in two electro-medical equipments.
Human corporal equilibrium comes from the
interaction of three main systems: vision,
proprioceptive system and vestibular system.
Vestibular-Ocular Reflex (VOR) is responsible for
vision focus during head movements (Castagno,
1994). Otorhinolaryngologists use several stimuli to
diagnose diseases in the equilibrium systems.
Caloric stimulus caused by the irrigation of heated
water or air in the auditory conduit cause in healthy
patient reflex ocular movements named nystagmus.
The electric register of the ocular movements is
called electronystagmography (ENG). The first
Brazilian computerized system for ENG resulted
from the joint work of Catholic University of
Pelotas, Dr. Castagno Clinic and Contronic Sistemas
Automáticos (Castagno, 1993; Costa, 1995). A
224
Richter C., Mendes P., Tavares M. and Alves V. (2008).
SOFTWARE FOR EMBEDDED CONTROLLER DESIGN - Application in Air and Water Caloric Electronystagmographic Stimulators.
In Proceedings of the First International Conference on Biomedical Electronics and Devices, pages 224-227
DOI: 10.5220/0001054502240227
Copyright
c
SciTePress
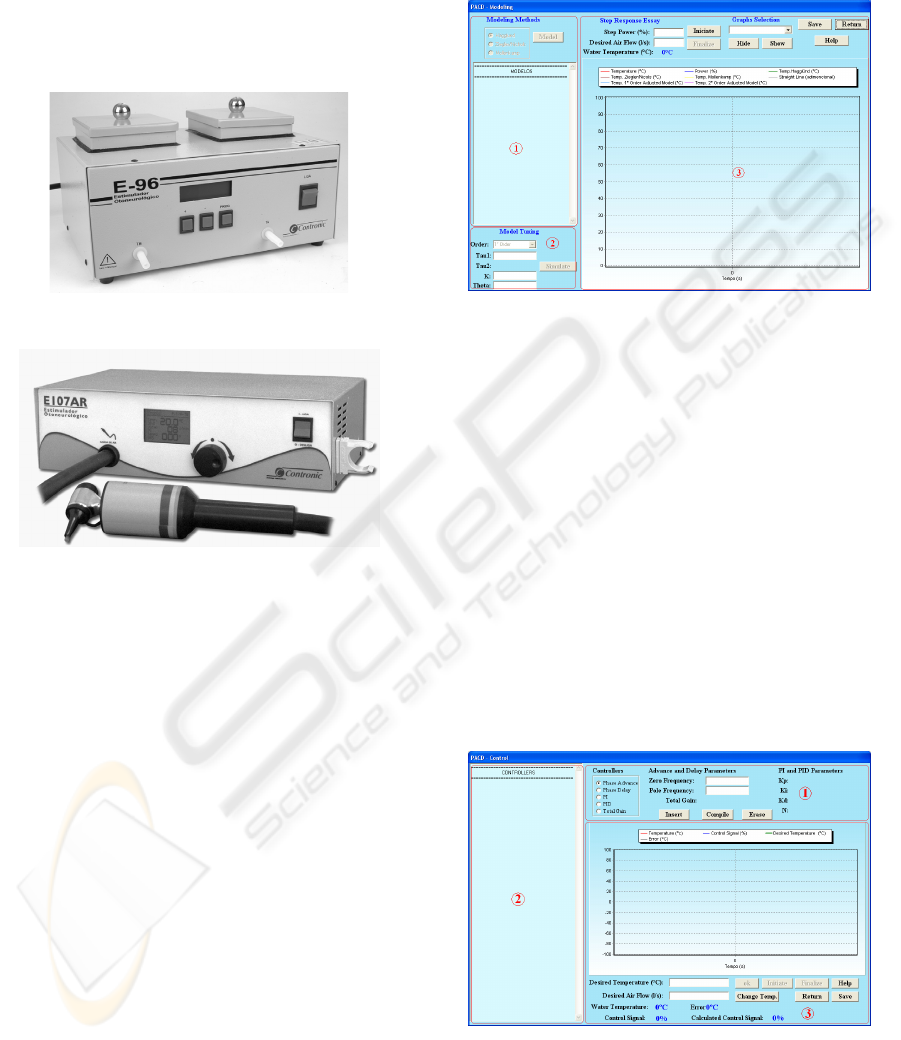
caloric water stimulator named E96, shown in
Figure 1 was developed for use during ENG exam,
maintaining two water containers at different
temperatures. A caloric air stimulator named E107,
shown in Figure 2, was recently developed. Two
main advantages of the air stimulator are causing
less discomfort and allowing the exam in patients
with tympanic perforation (Brookler, 2002).
Figure 1: Water caloric stimulator model E96.
Figure 2: Air caloric stimulator model E107.
2 MATHERIALS AND METHODS
2.1 PACD Software
The PACD software was created in C language,
under Borland IDE C++ Builder 6. Its initial form
presents two operating conditions: modeling or
control. Each one includes its own graphical
interface. In modeling operating condition, the plant
is modeled using a step excitation signal and
verifying its time response. Figure 3 presents the
modeling interface, which is divided in 3 regions,
enumerated in the figure as “1”, “2” and “3”. In the
first region, it is possible to choose the step response
modeling method while the second one is used to set
the amplitude of the step heating power input, and to
set the desired air flow. The third region shows the
step temperature response. The horizontal axis
shows essay time in seconds. As far as last the essay,
this axis keep adjusting to show all essay time range.
Vertical axis shows water/air temperature in Celsius
degrees (ºC). The available step response modeling
methods in PACD allow first order or second order
models with or without time delay. Modeling
method can be chosen between Ziegler-Nichols,
Hägglund and Mollenkamp methods, as presented in
Coelho (2004).
Figure 3: PACD modelling interface.
The control interface, shown in Figure 4, is also
divided in three regions. In the first one it is possible
to choose the controller type, to insert controller
parameters and to command the compilation of the
program with the chosen controller or controllers.
The second region shows all chosen controllers and
their parameters. In the third region it is possible to
set the desired water/air temperature, the desired air
flow and to start and stop controlling the plant.
During the control operation, real water/air
temperature in ºC is graphically shown against time
in seconds. Horizontal axis is auto-adjustable. Real-
time water/air temperature is shown numerically, as
well as the difference between the desired
temperature and the real one, named error. The
control signal is also showed in the same graphic
display, from 0% to 100% of the maximum possible
power, or -100% to +100% in air equipment.
Figure 4: PACD control interface.
The main feature of this interface is the possibility of
implementing and monitoring digital controllers in a
fast and easy way. As a new essay will be done,
SOFTWARE FOR EMBEDDED CONTROLLER DESIGN - Application in Air and Water Caloric
Electronystagmographic Stimulators
225
different tuning parameters can be chosen and
different cascade controllers can be appended.
PACD current available controllers include lead, lag,
lead-lag, double-lead, double-lag, PI and PID. The
internal structure of PACD uses negative unitary
feedback, and it allows to cascade up to 10
controllers of each type. This feature makes it
possible to accomplish many different
configurations to analyze in different operation
essays, so that the controller designer can choose the
configuration that gives the best results in terms of
the desired plant operation requirements.
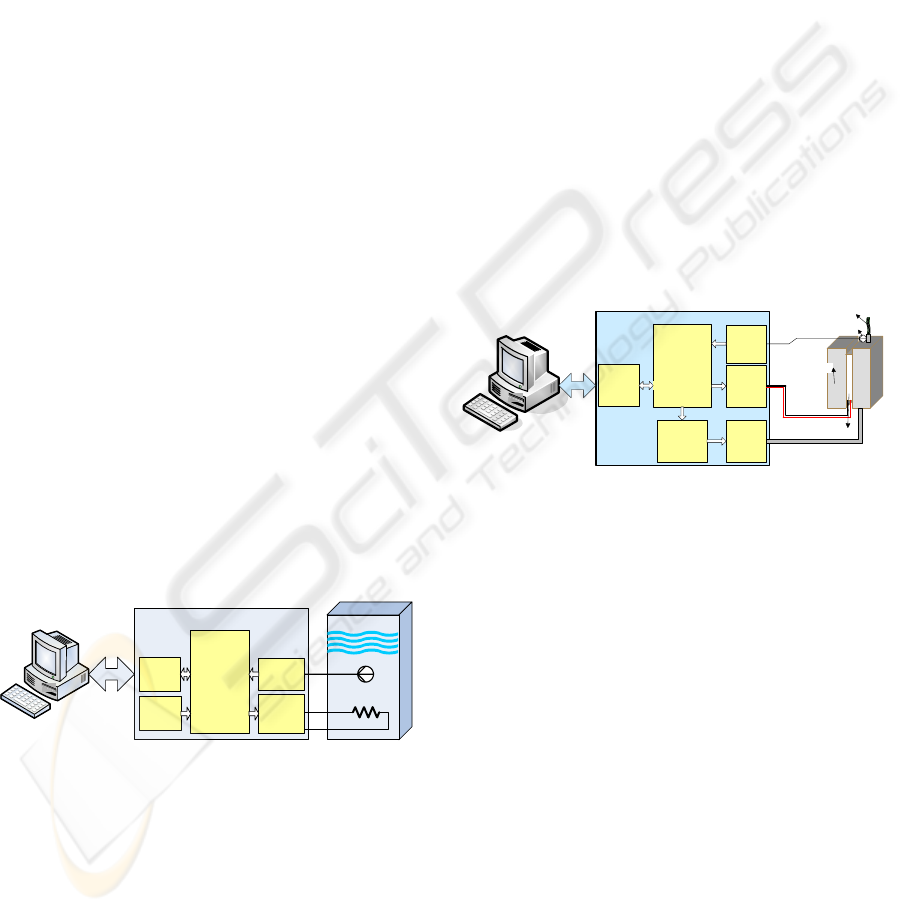
2.2 Water Test Setup
A testing setup was assembled, whose main parts are
shown in the block diagram shown in Figure 5. The
setup is composed by a printed circuit board from
E96 equipment, a water container with a heater
resistance inside and an additional serial
communication interface. The used microcontroller
is the Intel’s N87C196KB running at 12 MHz. The
temperature sensor is LM35DZ (National),
accompanied by an amplifier and adjustment
trimmer, allowing an adjusted error of 0.2 ºC in the
whole temperature range, from 0 ºC to 50 ºC. A
special version of the E96 embedded software was
created (C language, IAR compiler), so the equipment is
commanded through serial communication by PACD
software in the external PC. The power control variable
is delivered to a heater resistance of 700 W (220 V), and
variable percent power is determined by PWM (Pulse
Width Modulation) using integral cycle technique, in
order to avoid harmonic frequencies in the mains. The
PWM period corresponds to 50 cycles of the 60 Hz
electric network, so the power driver has 2% resolution.
Figure 5: Water caloric setup block diagram.
2.3 Air Test Hardware and Software
Air stimulator E107AR was used with a modified
protocol to facilitate the tests, and its basic block
diagram is shown in Figure 6. The main parts of the
system are composed by: an ADuC841
microcontroller (Analog Devices) running at 20
MHz; a precision resistive NTC sensor used to
measure the temperature of the heated or cooled air
flow, that after being adjusted by software, provides
0.2 ºC error in the whole temperature range (12 ºC to
50 ºC); an air pump that provides air flow from 4 to
12 liters/minute; and an air heater/cooler module
formed by refrigeration sink, a Peltier effect device
and a heater/cooler sink.
The internal E107AR software was modified to
inhibit the original temperature controller and the
periodic temperature sampling. It makes possible to
PC software setting the sampling frequency as
desired, and also, letting the PC software to control
the output air flow and the amount of power to heat
or to cool the air. The air pump power interface uses
an AC current control technique that delivers AC
voltage to the pump according to the
microcontroller's D/A converter. The Peltier effect
device is driven by an H-Bridge DC power interface,
which is controlled by the ADuC841 pulse width
modulation (PWM) output. The E107AR also has a
built-in RS232 level converter to translate the
microcontroller's TTL serial signals to ± 12 V levels
on the PC serial port.
Figure 6: Air caloric setup block diagram.
3 RESULTS
Several tests were accomplished for PACD software
validation and to find the best controller for each
setup.
3.1 Results from Water Test Setup
For modeling the water temperature system to be
controlled, a 25 % power step response was applied
and three PACD available model methods where
used. Figure 7 shows setup real step response
pointed as “A”. The letters B, C and D indicate
respectively the responses from Hägglund, Ziegler-
Nichols and Mollenkamp models. Carrying out a
manual adjustment in Ziegler-Nichols obtained
model, it was possible to arrive to the time response
indicated by “E”, which is even closer to the real
plant time response. Equation 1 shows this model.
Air flow
E107AR PCB
SRL
TTL to
RS232
Adapter
Opto-
isolated
Power
Interface
Adjust
and
amplifier
PWM
ADC0
UART
ADuC841
DAC
AC Control
Power
Interface
Air
pump
Refrigeration
Temperature sensor
Peltier effect
device
SERIAL
E96 PCB
TTL to
RS232
Adapter
EPROM
memory
80C196
ADC0
PWM
Opto-
isolated
Power
interface
Water container
Adjust
and
amplifier
resistance
temperature
sensor
UART
Controllers in software
BIODEVICES 2008 - International Conference on Biomedical Electronics and Devices
226
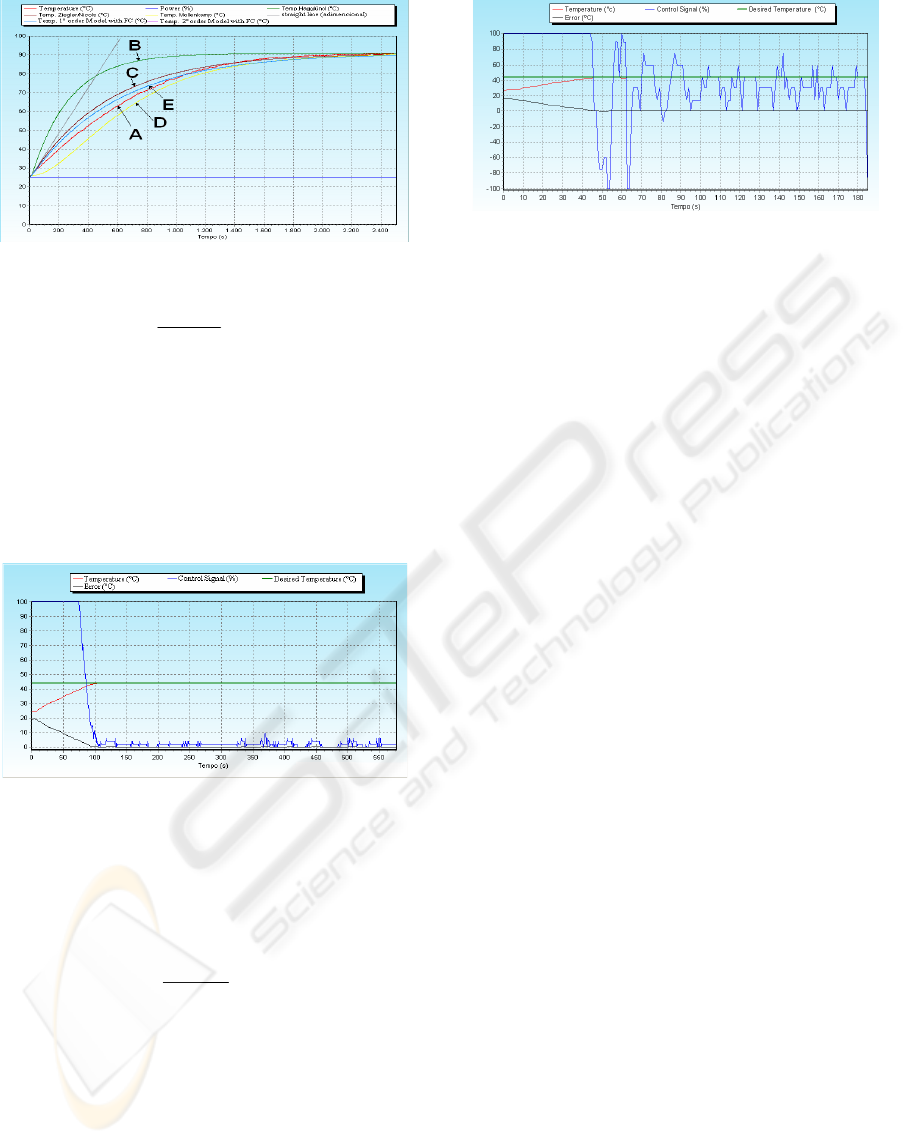
Figure 7: Water plant and models step response.
14
2.592
()
600 1
s
Gs
s
e
−
=
+
(1)
Based on the selected model, several controllers
were projected and tested according to classical
control techniques (Dorf, 2001). The desired tem-
perature was 44 °C and the initial temperature was
25 °C. An excellent step response of a controller
using a cascade of phase-lead and PI compensators is
shown in Figure 8, achieving 0% percent overshoot, 100
seconds settling time and ± 0.1 ºC stationary error.
Figure 8: Water phase-lead + PI controller.
3.2 Results from Air Test Setup
Modeling the system from a 25 % power step input,
it was obtained the model shown in Equation 2.
s
e
s
sG
3
1250
1528.0
)(
−
+
=
(2)
In all tests the desired temperature was 44 °C and
the initial temperature was 25 °C, with 12 l/min air
flow. After testing several developed controllers, the
best step response was obtained from a cascade of
phase-lead and PI compensators. Figure 9 shows this
result, which achieved 1.80 % overshoot (0.34ºC), 45
seconds settling time and ± 0.31 ºC stationary error.
Figure 9: Air phase-lead + PI controller.
4 CONCLUSIONS
Analysing both water and air step responses achieved
from cascade phase-lead and PI compensators, the
responses where much better than the required results,
which where set to 0.5 ºC maximum overshoot, 180
seconds of settling time and ± 0.5 ºC stationary error.
This way, the PACD software was considered
effective for the proposed applications, allowing the
model construction and testing of several controllers,
so helping to determine a better choice for the final
controller. In the future, PACD will be improved to
support other modelling methods and control
strategies, such as adaptive control.
ACKNOWLEDGEMENTS
The authors thank Brazilian Agency CNPq for scholar-
ship and financial support through grant 481638/2004-0.
REFERENCES
Dorf, R.C., Bishop, R.H., 2001. Sistemas de Controle
Modernos. LTC. Rio de Janeiro.
Coelho, A.A.R.; Coelho, L.S., 2004. Identificação de Siste-
mas Dinâmicos Lineares. Ed. da UFSC. Florianópolis.
Castagno, L.A., Tavares, M.C., Richter, C.M. et al., 1994.
Sistema Computadorizado de Eletronistagmografia e
Vectonistagmografia “UCPel/Castagno” (Versão 3.0).
Anais do IV CBIS, pp. 26-31.
Castagno, L.A, Tavares, M.C., Cava, R.A. et al., 1993.
Eletronistagmografia computadorizada: o novo
sistema de aquisicao de dados ENGc UCPel/Castagno.
Rev. Bras. Otorrinol., v. 594, pp. 263-265.
Costa, M.H., Tavares, M.C., Richter, C.M., Castagno,
L.A., 1995. Automatic analysis of electronys-
tagmographic signals. 38th Midwest Symposium on
Circuits and Systems, v.2, pp. 1349-1352.
Brookler, K.H., 2002. A case of normal ENG findings on
air caloric stimulus that were not substantiated by
water stimulus. Ear, Nose & Throat Journal, v. 81,
n.8.
SOFTWARE FOR EMBEDDED CONTROLLER DESIGN - Application in Air and Water Caloric
Electronystagmographic Stimulators
227
