
RAPID FINITE STATE MACHINE CONTROL OF INDIVIDUAL DNA
MOLECULES IN A NANOPORE
Noah A. Wilson, Robin Abu-Shumays, Elizabeth Koch, Seico Benner and William B. Dunbar
Dynamics and Control Laboratory, Computer Engineering and Biomolecular Engineering
University of California, Santa Cruz, CA, 95064 USA
Keywords:
Nanopore, single molecule control, finite state machine.
Abstract:
This paper demonstrates feedback voltage control of individual DNA hairpin molecules captured in a
nanopore. A finite state machine is used to program voltage control logic, executed on a field-programmable
gate array, for rapid detection and regulation of hundreds of DNA hairpins, one at a time. Prompt voltage
reduction is used for extension of the dwell time of DNA hairpins in the nanopore. Then, voltage reversal
after a preset dwell time is used for automated expulsion of molecules prior to hairpin unzipping. The demon-
strated control authority of single molecular complexes captured in the nanopore device is an integral part of
our ongoing research for direct monitoring and control of enzyme-bound biopolymers.
1 INTRODUCTION
Nanopore sequencing is based on electrophoretically
driving a singe-stranded DNA (ssDNA) or RNA
molecule through a nano-scale pore (Deamer and
Branton, 2002). The potential of this technology
is high-speed, high throughout sequential identifica-
tion of all nucleotides in any single DNA or RNA
molecule. Many research groups are now exploring
and developing biological and solid-state nanopores
to achieve low-cost, high throughput nanopore-based
sequencing (Rhee and Burns, 2006), in addition to
other single molecule sensing applications (Dekker,
2007).
In the biological nanopore setup, a planar lipid bi-
layer is created across a 20 µm teflon aperture in a
KCl solution. A single α-hemolysin protein channel
is inserted into the planar lipid. The channel (pore)
is 15 nm in length and varies in diameter. The cis-
opening of the pore is 2.6 nm wide, opening to a 3.6
nm vestibule before narrowing to a limiting 1.5 nm
width at the beginning of the stem. The remainder of
the stem up to the trans-opening is 2 nm wide. The
vestibule is large enough for double-stranded DNA
(dsDNA) to enter, but the limiting stem is just wide
enough for ssDNA to pass through. Across the bi-
layer, AgCl electrodes are used to apply a poten-
tial that produces an ionic current through the pore.
The field created by this voltage pulls the negatively
charged phosphate backbone of the ssDNA or RNA
through the pore, passing from the cis side to the
trans side of the pore with the trans-side voltage posi-
tive. As molecules translocate, the pore becomes par-
tially blocked by the translocating molecule, causing
an momentary drop in current. These translocation
events can be characterized by the amplitude of the
blockade current and the time the molecule spends in
the pore, defined as the dwell time.
We use DNA oligomer that is 79 nucleotides to-
tal in length, with a 20 base pair hairpin (20 bphp).
The hairpin is formed by the 3’ end folding over and
annealing on itself resulting in a 20 base pair region.
The hairpin is thus the double-stranded segment, with
the single-stranded segment 35 nucleotides long (4
unpaired bases in the doubled-stranded end loop).
Upon capture of the ssDNA end, the hairpin enters
the pore vestibule and remains until the hairpin is un-
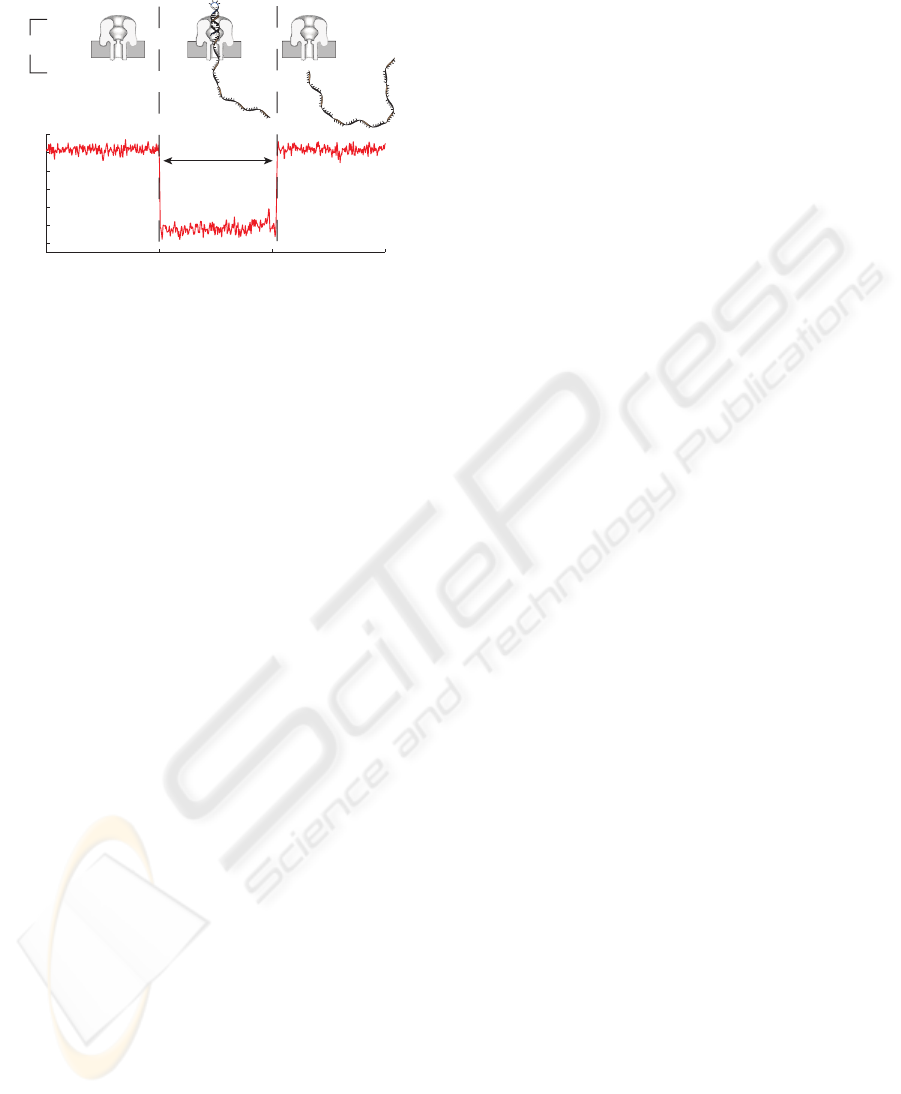
zipped. A schematic of the nanopore system and an
example 20 bphp translocation event is illustrated in
Figure 1.
Regarding the resolution limits of ionic cur-
rent measurements, homopolymers of ssDNA and
block copolymers of RNA are distinguishable
based on the measurable differences in the block-
ade current amplitude or kinetics (Akeson et al.,
1999). However, translocation rates are too fast
(up to 2 nucleotides/µsec, (Akeson et al., 1999))
to identify individual nucleotides in heterogeneous
single-stranded polymers using existing biological
nanopores (Dekker, 2007). In this paper and other
93
A. Wilson N., Abu-Shumays R., Koch E., Benner S. and B. Dunbar W. (2008).
RAPID FINITE STATE MACHINE CONTROL OF INDIVIDUAL DNA MOLECULES IN A NANOPORE.
In Proceedings of the First International Conference on Biomedical Electronics and Devices, pages 93-98
DOI: 10.5220/0001053000930098
Copyright
c
SciTePress
0 5 10 15
10
30
50
70
Time (msec)
pA
+
180 mV
-
cis
trans
Dwell Time
(I) (II) (III)
Figure 1: Schematic of nanopore and DNA, and plot of
representative ionic current signal during a 20 bphp DNA
translocation event under 180 mV applied potential. (I) At
180 mV, KCl ions pass through the open channel result-
ing in ∼64 pA current. (II) Upon capture of the single-
stranded end of the DNA molecule into the cis opening of
the pore, the flow of ions is reduced to ∼20 pA. (III) Af-
ter ∼5 msec, the voltage unzips the hairpin, causing ssDNA
to pass through the pore into the trans chamber, completing
the measured blockaded event. The duration of the event is
referred to as dwell time.
studies (Vercoutere et al., 2003; Mathe et al., 2004),
DNA with single and double stranded segments is
used to increase the dwell time of nucleotides in the
pore (0.5–10 ms, depending on applied voltage and
dsDNA segment length). Another approach is to
use DNA-binding proteins (enzymes) to increasing
the nucleotide dwell time in the pore. This is being
pursued at UCSC as part of the $1000/mammalian
genome project (Golovchenko, 2005). Under an ap-
plied voltage, the ssDNA end of enzyme-bound DNA
is captured in the nanopore, with the enzyme resid-
ing on top of the nanopore being too large to translo-
cate through it. Binding of enzymes to DNA in this
configuration has been shown to increase the dwell
time of DNA in the nanopore by up to two orders
of magnitude (up to 200 msec). Recently, kinetics
of Escherichia coli exonuclease I binding to ssDNA
has been quantified using voltage ramps for nanopore-
based force spectroscopy (Hornblower et al., 2007).
The voltage field force exerted on the ssDNA causes
it to dissociate from the enzyme after several millisec-
onds before translocating. The time-to-dissociation
in turn can be correlated to enzyme binding rate con-
stants.
In (Benner et al., 2007), the interaction of DNA
with the Klenow fragment (KF) of Escherichia coli
DNA polymerase I was explored. In the absence of
KF, capture and subsequent unzipping of 20 bphp at
constant 180 mV reveals blockades with 20 pA mean
amplitude and 4 msec median dwell time. Addition
of KF and the dNTP complementary to the DNA tem-
plate base in the KF catalytic site yielded a substan-
tial increase in blockade dwell times (110 msec me-
dian lifetime for dGTP), attributable to ternary (DNA-
KF-dGTP) complexes. Closer investigation of such
blockades revealed a two-step pattern in greater than
97% of the blockades, the first step at 24 pA mean
amplitude, and the second (terminal) step at 20 pA
mean amplitude lasting 4ms consistent with the hair-
pin kinetics alone. It was demonstrated that the tran-
sition from step one to two resulted in dissociation of
KF from DNA first, followed by hairpin dropping into
the pore vestibule until unzipping occurred. As a ini-
tial effort at voltage control of enzyme-bound DNA,
we demonstrated efficient automated detection of in-
dividual ternary complexes (< 3 msec), based on the
characteristic 24 pA amplitude, and truncation of the
blockade time by voltage reversal after 20 ms (Benner
et al., 2007)).
This paper presents an extension of the control re-
sults presented in (Benner et al., 2007). Specifically,
we demonstrate automated detection and manipula-
tion of DNA hairpins. Rapid detection (< 2 msec) is
based on computing a filtered mean amplitude of the
ionic current in real time, and monitoring the mean
relative to an amplitude range consistent with DNA
hairpin blockades (20 ± 2.8 pA). Upon detection,
two methods of voltage control are demonstrated. In
method 1, dwell time extension is achieved by prompt
voltage reduction, with the reduced voltage applied
until the hairpin unzips. A voltage for capture in-
creases the number of molecules examined, and the
reduced voltage post-capture increases the dwell time
to, in principle, facilitate sequencing. In particular,
extending the life of DNA hairpins in the pore in-
creases the time within which a terminal base iden-
tification could be acheived using machine learning
methods (Vercoutere et al., 2003). In method 2, volt-
age reduction is applied for a preset time (10 msec)
followed by voltage reversal to expel the molecule
prior to hairpin unzipping. This demonstrates our
control authority to aggregate the dwell times of hun-
dreds of blockade events. Additionally, it comple-
ments our prior work (Benner et al., 2007), confirm-
ing our ability to detect DNA-enzyme blockades and
DNA hairpin blockades. Confirmation of our ability
to discern between each blockade type in real time is
part of our ongoing work. Ultimately, nanopore-based
characterization of enzyme dynamics will require di-
rect detection and control of multiple DNA confor-
mations relative to the enzyme, and direct control of
enzyme-free DNA is a prerequisite toward developing
BIODEVICES 2008 - International Conference on Biomedical Electronics and Devices
94

this capability.
Direct control of ssDNA in a nanopore has been
demonstrated (Bates et al., 2003), in which detec-
tion of DNA is based on monitoring the raw am-
plitude relative to a threshold level. Voltage level
changes, comparable to those employed in this paper,
were commanded to explore the zero and low volt-
age effects on ssDNA-pore interactions. In contrast
to thresholding the raw ionic current amplitude, the
windowed amplitude mean calculation we have used
here filters the current noise. Additionally, detection
depends on the mean remaining within a preset am-
plitude range (< 6 pA in spread) for multiple con-
secutive comparisons. Alternative methods for sin-
gle molecule sensing and manipulation include op-
tical tweezers and atomic force microscopy (Busta-
mante et al., 2003). For example, optical trapping
has been used to sequence DNA by attaching a pro-
cessive enzyme to a polystyrene bead (Abbondanzieri
et al., 2005), (Greenleaf and Block, 2006). At present,
greater spatial and temporal resolution of single DNA
molecule polymerization has been achieved than with
nanopores. However, these methods generally require
more preparative steps, and far fewer molecules can
be analyzed over a common time period.
2 CONTROL LOGIC SETUP
The nanopore system is setup in a 0.3 M KCl so-
lution. A patch-clamp amplifier, Molecular Devices
AxoPatch 200B, regulates the applied voltage and
measures the ionic current through the channel. The
data are recorded using the Molecular Devices Digi-
data 1440A digitizer, sampled at 50 kHz and low-
pass filtered at 5 kHz with a four-pole Bessel filter.
The voltage control logic is programmed using a fi-
nite state machine (FSM) within LabVIEW 8 soft-
ware. The FSM logic is implemented on a field-
programmable gate array (FPGA) hardware, National
Instruments PCI-7831R. An FPGA is a reconfigurable
hardware platform that permits fast measurement and
voltage reaction times (1 µsec output sample time).
An FSM is a logic construct where program execution
is broken up into a series of individual states (Gill,
1962). Each state has a command associated with it,
and transitions between states are a function of system
measurements. Measurements of the pore current are
processed and passed to the FSM as inputs. Changes
in the FSM control logic are done as necessary, then
re-compiled and re-routed to run on the FPGA. This
achieves a balance between speed and flexibility, by
enabling the system to react to events on the order of a
microsecond, while also allowing for the control logic
to be reconfigured as necessary between experiments.
Blockade events, quantified by the blockage cur-
rent and dwell time, can be detected and monitored in
real time using the FSM/FPGA. A mean filter applied
to the incoming current signal on the FPGA removes a
large portion of the peak-to-peak noise. Specifically,
every 5.3 µsec, the FPGA samples the ionic current
and computes a windowed mean amplitude based on
the previous 0.75 ms of signal. Every 0.2 ms, the
FPGA tests if the mean is within 20±2.8 pA (17.2 to
22.8 pA range). The basis for choosing this range is
that ∼20 pA is the median amplitude for DNA 20 base
pair hairpin events at 180 mV, as shown in the exper-
imental results below. If the mean enters and remains
within this range for four consecutive tests, the FSM
logic diagnoses the blockade as a DNA hairpin event.
The nominal detection time, between DNA transloca-
tion event and diagnosis of the event, is 2.0 ms; 0.75
ms for the windowed mean to first enter the 17.2 to
22.8 pA range, and 0.6 ms for three more confirmed
tests, and 0.65 ms of delay
1
.
3 EXPERIMENTS AND RESULTS
In our first experiment, the objective was to efficiently
detect individual DNA hairpin events, and increase
the blockade dwell time by lowering the applied volt-
age from 180 mV to 150 mV upon detection. This
is referred to as dwell time extension control. Next,
we sought to aggregate the extended blockade dwell
times, by expelling the DNA using voltage reversal of
-50 mV after 10 ms at 150 mV. This is referred to as
dwell time aggregation control. The motivation was
to increase the nominal hairpin dwell time, and expel
the molecule before unzipping the hairpin. A typical
20 bphp event at constant 180 mV voltage is shown
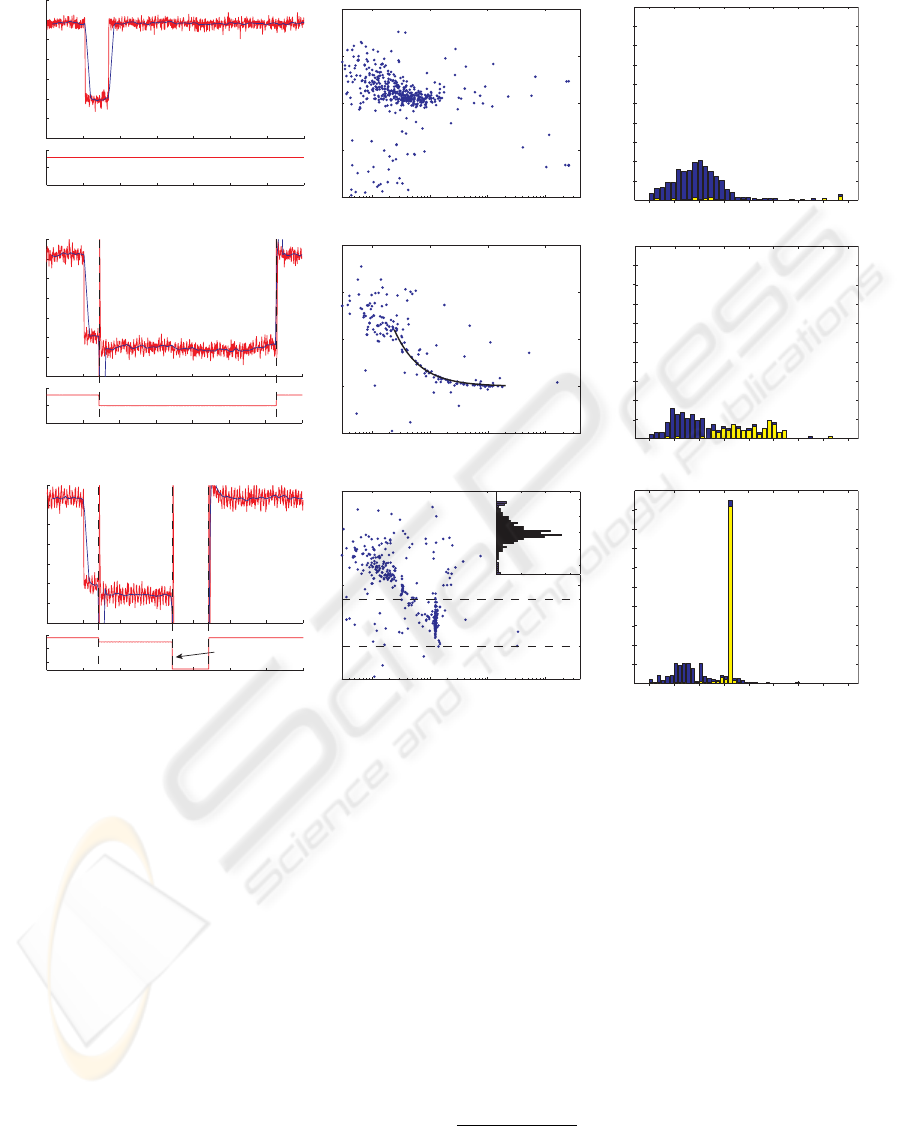
in Figures 1 and 2aI. The probability histogram of the
base 10 logarithm of dwell time (Figure 2aIII, blue)
is unimodal, with median dwell time of 2.8 ms. The
median amplitude of the event plot in Figure 2aII is
20.9 pA with an interquartile range (IQR) of 1.7 pA.
Only 6% of events are in the subset range of 13-18 pA
(2aIII, yellow). For the same experiment at constant
150 mV voltage (data not shown), the events cluster
around a median amplitude of 15 pA and 87% of 150
events are in the 13-18 pA range. Thus, under exten-
sion and aggregation control for which the voltage is
reduced to 150 mV for all detected events, a larger
1
Certain inefficiencies in FPGA signal routing into the
sampling loop caused the additional 0.65 ms of delay in the
reaction time. By bringing global signals inside the sam-
pling loop, the delay has recently been eliminated, reducing
detection time to 1.35 ms.
RAPID FINITE STATE MACHINE CONTROL OF INDIVIDUAL DNA MOLECULES IN A NANOPORE
95
-0.5 0 0.5 1 1.5 2 2.5 3 3.5
0
0.1
0.2
0.3
0.4
0.5
-0.5 0 0.5 1 1.5 2 2.5 3 3.5
0
0.1
0.2
0.3
0.4
0.5
-0.5 0 0.5 1 1.5 2 2.5 3 3.5
0
0.1
0.2
0.3
0.4
0.5
0 5 10 15 20 25 30 35
100
200
mV
0
20
40
60
pA
Hairpin
Detect
0 5 10 15 20 25 30 35
100
200
mV
0
20
40
60
pA
Reduce
Voltage
Time (msec)
0
20
40
60
pA
0 5 10 15 20 25 30 35
0
200
mV
Hairpin
Detect
Reverse
Voltage
Reduce
Voltage
1
10
100 1000
10
20
30
pA
1
10
100 1000
10
20
30
pA
10
20
30
pA
1
10
100 1000
Dwell Time (msec) Base 10 Log of Dwell Time (msec)
Fraction of EventsFraction of EventsFraction of Events
a)
b)
c)
(I) (II) (III)
0 0.1
14
16
18
pA
Fraction of Events
Figure 2: Regulation of 20 bphp dwell time using FSM control. (I) The red current signals are low-pass filtered at 5kHz, the
blue signal is a mean filtered current, and the red voltage signal is the commanded voltage. Typical events and corresponding
voltage signals under a) constant 180 mV voltage, b) dwell time extension control, and c) dwell time aggregation control. (II)
Event plot of DNA events, showing average amplitude vs. dwell time for each event (point). Equation (1) (line) fit to events in
bII), and amplitude histogram for events within 13-18 pA (dashed line) range in cII). (III) Probability histograms of the base
10 logarithm of dwell time for all events (blue), and for subset of events in 13-18 pA range (yellow).
percentage of blockades should have a mean ampli-
tude within the 13-18 pA range.
3.1 Dwell Time Extension (Figure 2b)
Upon diagnosis of a DNA hairpin event using the
mean filtered current, the command voltage is re-
duced to 150 mV until the hairpin unzips and the
DNA translocates through the pore. Using 180 mV
for capture results in more events than 150 mV, while
reducing to 150 mV extends the life of the hairpin.
Dwell time extension is useful for terminal base-pair
sequencing by machine learning methods (Vercoutere
et al., 2003). After each translocation, the FPGA re-
sets the voltage to 180 mV. A representative event is
shown in Figure 2bI. The event plot (Figure 2bII) pat-
tern shows that events faster than the nominal diagno-
sis time of 2.0 ms are unaffected by extension control,
and events with longer dwell times converge to the
∼15 pA mean amplitude as expected. The concave
trend is also consistent with an equation for event’s
mean amplitude vs. dwell time. In particular, for an
event at 21 pA (median amplitude at 180 mV) for 2.4
ms
2
, and at 15 pA (median amplitude at 150 mV) for
2
Step changes in voltage induce a capacitive transient,
and the transient at the end of each event is ∼0.4 ms for
changing from 150 mV to 180 mV. Thus, 2.4 ms at 21 pA is
2.0 ms of detection time and 0.4 ms of transient time. While
BIODEVICES 2008 - International Conference on Biomedical Electronics and Devices
96
x ms, an approximate mean amplitude
¯
I is
¯
I =
2.4 ∗ 21 +15∗ x
2.4 + x
. (1)
When x ≈ 24 ms, as in Figure 2bI,
¯
I = 16 pA. Equa-
tion (1) closely matches the mean amplitude vs. dwell
time data (Fig. 2bII). Also, the fraction of events
within the subset range 13-18 pA increased to 41%,
as shown in the yellow histogram overlaid on the blue
probability histogram (Fig. 2bIII).
3.2 Dwell Time Aggregation (Figure 2c)
The objective was to aggregate the dwell times of the
extended events by applying 150 mV for 10 ms upon
diagnosis of a hairpin event, followed by voltage re-
versal of -50 mV for 5 ms. The reversal time of 5 ms
is known to be sufficient to clear the DNA from the
channel, prepping the pore for the next event. Aggre-
gation control would imply a measure of control over
the distribution of the events, in addition to temporal
control of individual molecular events. A representa-
tive event is shown in Figure 2cI. As before, the event
plot (Fig. 2cII) pattern shows that events faster than
the nominal diagnosis time of 2.0 ms are unaffected
by aggregation control. Within the subset range of
13-18 pA, the median amplitude is 16 pA with 0.7 pA
IQR (amplitude histogram shown in Fig. 2cII). The 16
pA median is consistent with (1), since for x = 10.0
ms,
¯
I = 16 pA. Also in the subset range, and the me-
dian dwell time is 12.4 ms with 0.1 ms IQR. The low
IQR indicates a high degree of control over the distri-
bution of events that extend to at least 10 ms at 150
mV. The median dwell time of 12.4 ms is commensu-
rate with 2.0 ms of detection time, 10 ms at 150 mV,
and 0.4 ms due to a transient that is included at the
end of each event resulting from voltage reversal
3
.
Summary statistics for the histograms in Figure
2III are reported in Table 1.
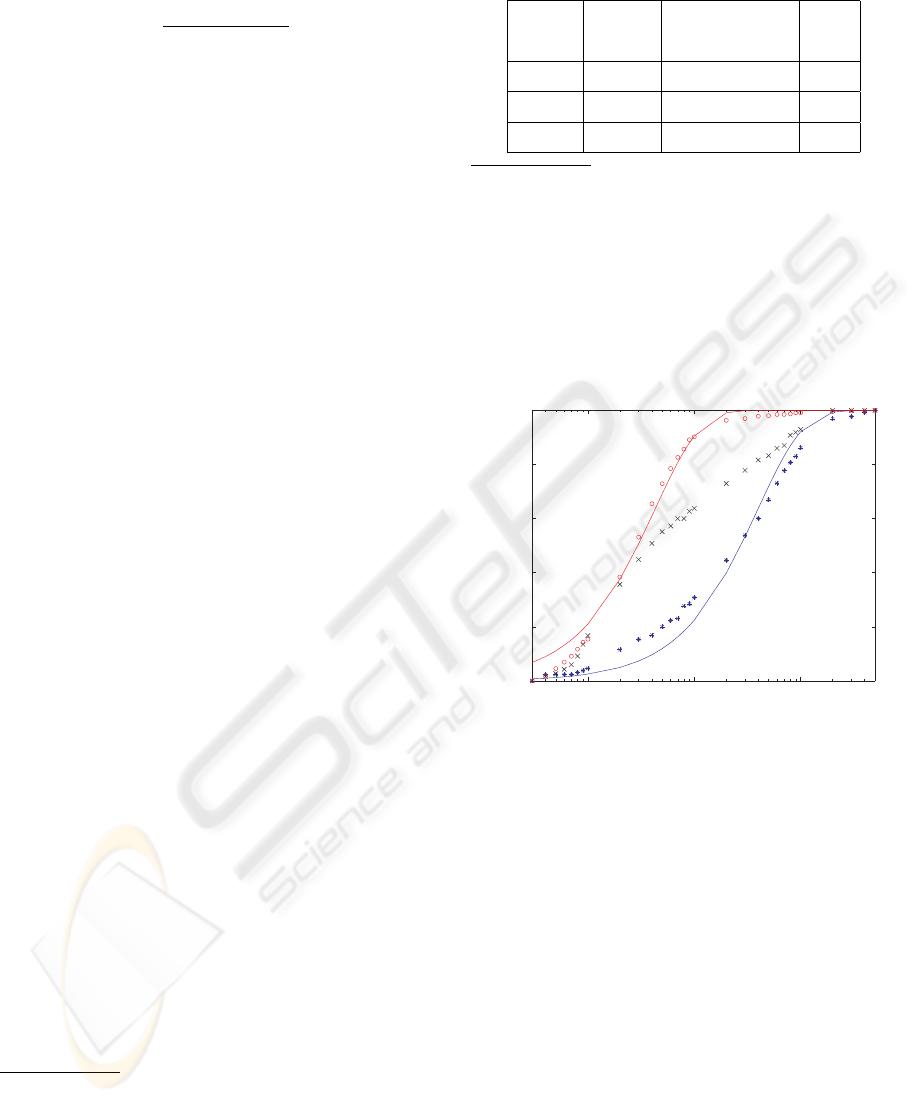
In (Mathe et al., 2004), the authors characterize hair-
pin unzipping at a set of constant voltages by fit-
ting a curve to an unzipping probability data profile.
Specifically, for an unzipping time t at voltage V , the
unzipping probability is the fraction of events with
dwell time less than t, divided by the total number of
events
4
. For a set of t values, the unzipping probabil-
ity data profile is shown in Fig. 3 for our experiments
the 0.4 ms transient varies in amplitude, assuming 21 pA is
sufficient for line fitting.
3
The transient due to the 180 mV to 150 mV change is
included within the 10 ms waiting time under aggregation
control.
4
The authors formulate an alternative but equivalent def-
inition for unzipping probability.
Table 1: Summary statistics for Figure 2III.
Figure No. of Median Dwell IQR
No. Events Time (ms) (ms)
2aIII
a
472
b
2.8 4.2
2bIII
c
76
d
31.6 62.0
2cIII
c
256
e
12.4 0.1
a
Blue histogram, for events within 10 to 30 pA range.
b
6% (27 events) within subset 13-18 pA range.
c
Yellow subset histogram, for events within 13-18 pA
range.
d
41% of the 187 events within 10 to 30 pA range.
e
55% of the 466 events within 10 to 30 pA range.
at 180 mV constant, under extension control, and at
150 mV constant. As in (Mathe et al., 2004), we fit
1 10 100
0
0.2
0.4
0.6
0.8
1
Unzipping Probability
UnzippingTime (ms)
Figure 3: Unzipping probability data profile, defined as
fraction of events with dwell time less than each unzipping
time t, and line 1− exp[t/τ
V
u
] fit to profile for constant volt-
ages V = 180 mV (red) and V = 150 mV (blue). Charac-
teristic unzipping time constant τ
V
u
at constant voltage V is
generated by fit. Symbols: ◦ for V = 180 mV, × for exten-
sion control (transitions from 180 mV to 150 mV), and ∗
for V = 150 mV.
a line to the data, revealing a characteristic unzipping
time τ
V
u
for constant voltage V . For amplitude range
10-30 pA and dwell time range 0.3-500 ms, it is re-
vealing to compare the median dwell times with the
fitted τ
V
u
constants. For V = 180 mV, the median is
2.6 ms and τ
180
u
= 4.2 ms. For V = 150 mV, the me-
dian is 25.2 ms and τ
150
u
= 39.4 ms. We observe that
data trimming has a significant affect over the quality
of the fit to the data, and consequently over the value
for τ
V
u
. In contrast, the median does not vary as much,
suggesting a sensitivity of τ
V
u
to outliers, in addition to
the fitting method used. For example, for a dwell time
range of 0.3-4000 ms at V = 150 mV, the median is
RAPID FINITE STATE MACHINE CONTROL OF INDIVIDUAL DNA MOLECULES IN A NANOPORE
97

34.9 ms (+ 9.7) and τ
150
u
= 55.7 ms (+ 16.3). Careful
selection and analysis of statistical models appropri-
ate for our data (with outliers always present) is part
of our ongoing work.
4 CONCLUSIONS
We have shown that single DNA hairpin molecules
captured in a biological nanopore can be detected and
reacted to using a finite state machine implemented
on a field-programmable gate array. The dwell time
of such translocation events can be extended to gain
more signal, which can in turn be analyzed offline
using machine learning methods to yield terminal
base-pair specific signatures. The signatures can then
be used for real-time identification of terminal base
pairs. Additionally, the finite state machine is ca-
pable of ejecting a molecule from the pore after it
has been detected but prior to unzipping the hair-
pin. Rapid DNA hairpin detection (< 2 msec) re-
lied on a mean filtered amplitude, which was required
to remain within a preset amplitude range (< 6 pA
in spread) for multiple consecutive threshold com-
parisons. The method will be tuned to differentiate
DNA-enzyme blockades from DNA alone blockades
in real time as part of our ongoing work. Ultimately,
nanopore-based characterization of enzyme dynamics
will require direct detection and control of multiple
DNA conformations relative to the enzyme, and direct
control of enzyme-free DNA is a prerequisite toward
developing this capability.
ACKNOWLEDGEMENTS
E. Koch was supported by a Summer Undergradu-
ate Research Fellowship in Information Technology,
funded by NSF under grant CCF-0552688. The work
was also supported in part by NHGRI under grant
K25 HG004035-01. We thank K. Lieberman and
M. Akeson for their help in preparing the paper.
REFERENCES
Abbondanzieri, E., Greenleaf, W., Shaevitz, J., Landick, R.,
and Block, S. (2005). Direct observation of base-pair
stepping by RNA polymerase. Nature, 438(24):460–
465.
Akeson, M., Branton, D., Kasianowicz, J., Brandin, E.,
and Deamer, D. (1999). Microsecond time-scale dis-
crimination among polycytidylic acid, polyadenylic
acid, and polyuridylic acid as homopolymers or as
segments within single RNA molecules. Biophysical
Journal, 77:3227–33.
Bates, M., Burns, M., and Meller, A. (2003). Dynamics
of DNA molecules in a membrane channel probed
by active control techniques. Biophysical Journal,
84:2366–2372.
Benner, S., Chen, R. J., Wilson, N. A., Abu-Shumays,
R., Hurt, N., Lieberman, K. R., Deamer, D. W.,
Dunbar, W. B., and Akeson, M. (2007). Sequence-
specific detection of individual DNA polymerase
complexes in real time using a nanopore. Nature
Nanotechnology. advanced online publication, DOI
10.1038/nnano.2007.344.
Bustamante, C., Bryant, Z., and Smith, S. B. (2003). Ten
years of tension: single-molecule DNA mechanics.
Nature, 421:423–427.
Deamer, D. and Branton, D. (2002). Characterization of
nucleic acids by nanopore analysis. Acc. Chem. Res.,
35:817–825.
Dekker, C. (2007). Solid-state nanopores. Nature Nan-
otechnology, 2:209–215.
Gill, A. (1962). Introduction to the theory of finite-state
machines. McGraw-Hill.
Golovchenko, J. (2005). Electronic sequencing in
nanopores. The $1000/mammalian genome project,
NHGRI R01 HG003703-03.
Greenleaf, W. J. and Block, S. M. (2006). Single-
molecule, motion-based DNA sequencing using RNA
polymerase. Science, 313:801.
Hornblower, B., Coombs, A., Whitaker, R., Kolomeisky,
A., Picone, S., Meller, A., and Akeson, M. (2007).
Single-molecule analysis of DNA-protein complexes
using nanopores. Nat Methods, 4(4):315–317.
Mathe, J., Visram, H., Viasnoff, V., Rabin, Y., and Meller,
A. (2004). Nanopore unzipping of individual dna hair-
pin molecules. Biophysical Journal, 87:3205–3212.
Rhee, M. and Burns, M. (2006). Nanopore sequencing tech-
nology: research trends and applications. Trends in
Biotechnology, 24:580–6.
Vercoutere, W., Winters-Hilt, S., DeGuzman, V., Deamer,
D., Ridino, S., Rodgers, J., Olsen, H., Marziali, A.,
and Akeson, M. (2003). Discrimination among indi-
vidual watson-crick base pairs at the termini of sin-
gle DNA hairpin molecules. Nucleic Acids Research,
31:1311–8.
BIODEVICES 2008 - International Conference on Biomedical Electronics and Devices
98
