
WIDE-BANDWIDTH, HIGH FRAME RATE ELECTRICAL
IMPEDANCE TOMOGRAPHY / SPECTROSCOPY
A Code Division Multiplexing (CDM) Approach
A. L. McEwan, D. S. Holder
Department of Medical Physics and Bioengineering, University College London, Gower St London, UK
J. Tapson
Department of Electrical Engineering, University of Cape Town, Cape Town, South Africa
A. van Schaik
School of Electrical and Information Engineering, University of Sydney, Sydney, Australia
Keywords: Electrical impedance tomography, electrical impedance spectroscopy, bioimpedance measurement, code
division multiplexing.
Abstract: We present a proposal and proof-of-concept, experimental results for a new type of electrical impedance
tomography / spectroscopy system that makes use of code division multiplexing to achieve two important
technological advances. Assigning each channel an orthogonal code allow all the impedance measurements
to be made simultaneously in time, thereby increasing the frame rate; and the use of pseudorandom input
signals allows a very wide range of frequencies to be sampled simultaneously in each channel.
1 INTRODUCTION
Electrical impedance tomography (EIT), in which a
volume is probed non-invasively by injecting
currents (or magnetic fields) and measuring the
electrical potential or magnetic fields at the
periphery, has been used for physiological imaging
for three decades (Holder, 2005). Its applicability in
industrial situations, in which it is called process
tomography, was recognized in the early 1980’s
(Beck and Williams, 1996), leading to a
considerable investment in research into hardware,
software, and reconstruction algorithms (West,
2002). More recently, there has been a growing
interest in obtaining material contrast in the images
by discriminating on the basis of the frequency
response of impedance; this is electrical impedance
spectroscopy (EIS) (Brown, 2001). The combination
of the two methods is generally called EITS.
In the standard implementation of EIT, the
complex impedance is measured in terms of
resistance and capacitance. A ring of (usually 8 or
16) electrodes is placed around the volume to be
imaged (generally, a single plane or slice is imaged,
and volumes reconstructed from a number of planes;
hence the use of the word tomography). A current is
injected through a pair of the electrodes, and the
resulting electrical potentials measured at all of the
other electrodes. The signals are separated into a
resistive and a capacitive signal, either by measuring
the complex impedance directly, or by using
separate ohmic and capacitive electrodes.
If the frequency of the injected current is swept
through a range, or stepped through a set of fixed
frequencies, the spectral response may also be
obtained. The current excitation is then switched to a
new pair of electrodes, and a new data set acquired.
When all the desired combinations have been
measured, a reconstruction algorithm is used to
produce an approximation of the distribution of
material within the image plane, based on its
impedance (in EIT) or impedance spectrum (in
EITS). The reconstruction of EITS images is an area
of active research, and many different methods are
available (Polydorides and Lionheart, 2002).
There are a number of standard patterns of
excitation and measurement in EITS. The most
commonplace is that adjacent pairs of electrodes are
196
L. McEwan A., S. Holder D., Tapson J. and van Schaik A. (2008).
WIDE-BANDWIDTH, HIGH FRAME RATE ELECTRICAL IMPEDANCE TOMOGRAPHY / SPECTROSCOPY - A Code Division Multiplexing (CDM)
Approach.
In Proceedings of the First International Conference on Biomedical Electronics and Devices, pages 196-203
DOI: 10.5220/0001049601960203
Copyright
c
SciTePress

used to inject current, and potentials are measured at
all other adjacent pairs. This method has the
advantage that once a pair of electrodes has been
used for current injection, and its response at all
other electrodes measured, it is thereafter redundant
to measure potentials at that pair and therefore the
number of measurements required is reduced.
Regardless of the pattern used, a single frame of EIT
data requires a great many measurements (the
adjacent-pair method requires k = n×(n-1)
measurements for n electrodes); and this number
must be multiplied by the number of frequency
points required.
Taking a frame of EIT data using sequential
measurements – so-called time-division multiplexed
or TDM measurements) is slow, so that frame rates
in excess of 100 frames/second are extremely
difficult to achieve. Wilkinson and co-workers
(2003) have optimized the TDM process to a very
high degree, achieving frames rates of up to 1000
frames/s; but most laboratory and commercial
systems operate at orders of magnitude slower than
this. EITS systems are slower still, with frame rates
of 13 seconds/frame achievable with a frequency
range of 20 Hz – 128 kHz in current systems
(McEwan et al., 2006). A basic constraint in EITS
frame rate is imposed by the lower limit of spectral
bandwidth; for example, if the impedance at 20Hz is
required, the frame rate per second will be limited to
20/k, where k is the number of sequential
measurements required per frame; even this limit
implies sampling only a single cycle of the lowest
frequency per measurement, which is somewhat
difficult to achieve in practice.
A method which presents itself for increasing the
frame rate is simultaneously to inject currents which
are modulated to be mathematically orthogonal, so
that their contributions to the potential at any
electrode can be separated by demodulation. For
example, if a current of frequency f
1
is injected at
one pair of electrodes, and a current of frequency f
2
at a second pair, then the potential across a third pair
of electrodes can be separated into a component due
to f
1
and a component due to f
2
by synchronously
demodulating with those frequencies. The complex
components of impedance can be extracted by in-
phase and quadrature synchronous demodulation.
This is called frequency-division multiplexed (FDM)
EIT.
FDM EIT appears to have been developed
simultaneously by Tapson and colleagues (Tapson &
Teague, 2002), and Zimmermann and colleagues
(Zimmermann et al., 2002); although as both
developments were patented and not published in the
scientific literature, public domain details are few
(Teague, 2002).
A number of problems are encountered in FDM
EIT as a consequence of accommodating
simultaneous current injection and voltage
measurement on the same electrode. If the current
and voltage form part of the same impedance
calculation, this comprises a two-terminal
impedance measurement; whereas it is generally
considered that a four-terminal measurement is
required to avoid the problem of inadvertently
including the contact or terminal resistance in the
specimen resistance. If the current and voltage form
part of a separate calculation, then this problem is
avoided.
A second issue is that the current through any
terminal must be a sum of orthogonal component
currents, and equal and opposite components must
flow through some other terminal. Ensuring that the
net current due to each component is zero is
electronically complicated, and has not been
attempted in any of the known FDM EIT systems.
These systems have generally avoided these
problems by using separate sets of current injection
and voltage measurement electrodes, although this
has the disadvantage that twice the number of
electrodes are required to obtain the same resolution.
Data comparing the resolution of FDM and TDM
systems is scarce (Goldswain & Tapson, 2006), but
those results as well as unpublished work (Elliot,
2006) suggest that FDM systems are at least as
accurate as TDM systems.
In this paper we present a new approach to EITS
instrumentation. We make use of Code-Division
Multiplexing (CDM) to inject orthogonal currents
simultaneously, and to demodulate the resulting
potentials. This has an enormous advantage over
FDM and TDM techniques, in that it is possible to
sample at multiple frequencies simultaneously while
sampling multiple physical channels. The result is a
system in which wide-bandwidth multi-electrode
spectroscopy can be performed in times equivalent
to that taken for single measurements in current
EITS systems. The CDM process can be seen as a
natural extension of FDM EIT, and many of the
same issues apply. In order to deal with the problem
of sharing electrodes between multiple measurement
channels, we have developed a simple current
injection arrangement at the electrode, based on
high-frequency transformers, which guarantees a net
zero current flow for each orthogonal component.
The new system is described in detail in the
following sections.
WIDE-BANDWIDTH, HIGH FRAME RATE ELECTRICAL IMPEDANCE TOMOGRAPHY / SPECTROSCOPY - A
Code Division Multiplexing (CDM) Approach
197
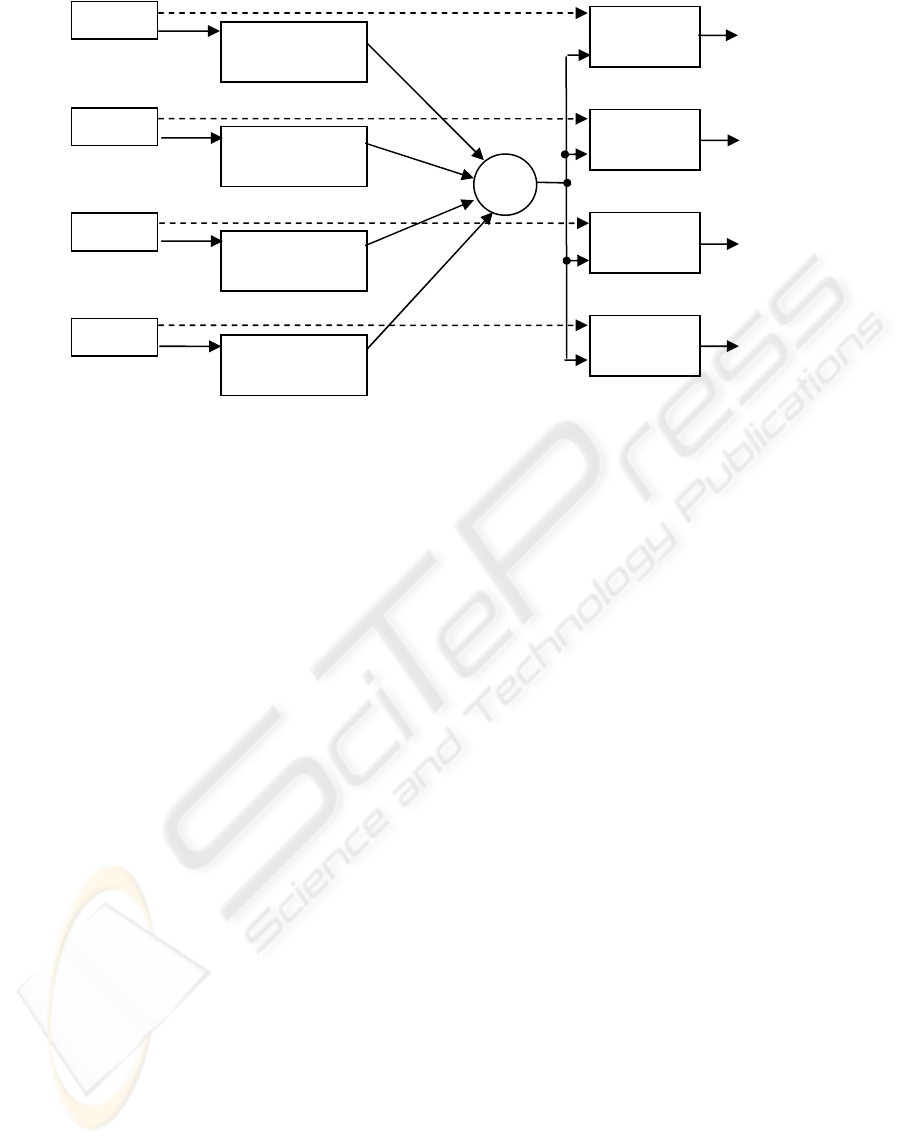
Figure 1: The code-division multiplexing principle. Each unique channel in the measurement system is stimulated using a
driving signal modulated with a unique binary pseudorandom (PRN) code. The channels are then either deliberately or
inadvertently mixed together. At the receivers, the contribution due to each channel is recovered by cross-correlating the
signal at the receiver, and a copy of the driving signal containing the channel’s characteristic code. If the codes are
orthogonal or near-orthogonal, there should be complete separation of components. Serendipitously, the cross-correlation
produces the impulse response of the channel (see Equations 1-6).
2 CODE-DIVISION
MULTIPLEXING OF EIT
CHANNELS
The principle of CDM is that the signal through a
particular channel is modulated using a unique
binary digital code (see Figure 1). A receiver which
is receiving several channels can separate the data
for each channel by demodulating using a copy of
the same code. There are a number of different
codes which may be used. The basic requirements
are that there should be at least one code per
channel; that the codes should be orthogonal, or
nearly so; and that the autocorrelation functions of
the codes should be flat with a single sharp peak (in
the ideal case, approximating a delta function)
(Sarwate & Pursley, 1980). The codes which we
have used in this work are called Gold codes, and
are used in the Global Positioning System (GPS) to
encode the signals from the GPS satellite
constellation; these signals can then be
unambiguously demodulated by a terrestrial GPS
receiver equipped with copies of the codes
(Parkinson & Spilker, 1996). The codes are bit
sequences which appear to be random, but in fact are
deterministically generated, usually by means of a
modulo-addition of bits in a shift register. Codes of
this type are generally referred to as pseudorandom
noise (PRN) sequences, as they appear to be random
and have the characteristics of noise.
In this system, we achieve two important goals
using CDM. Firstly, the use of CDM allows us to
take measurements over all the channels
simultaneously. Secondly, the spectral
characteristics of the CDM input signal effectively
interrogate the sample over a wide range of
frequencies, and the output signals can be
transformed to produce a spectrum, giving us
simultaneous wide-band spectroscopy on all
channels. The following two sections explain these
features.
2.1 The Use of Code Division
Multiplexing to Provide
Simultaneous Measurement
The use of CDM in an EIT system is shown
conceptually in Figure 1. We use the PRN codes as
the input stimulus to a system. The system has a
unique channel for each input, but unfortunately all
the channel outputs are combined linearly, so that
the unique response for each channel is not
explicitly available.
When we perform a cross-correlation R
IO
between the unique input signals I
n
and the
combined output signal O
n
, we are calculating:
code 1
code 2
code 3
code 4
unique
channel h
1
(t)
unique
channel h
2
(t)
unique
channel h
3
(t)
unique
channel h
4
(t)
cross
correlate
cross
correlate
cross
correlate
cross
correlate
h
1
(t)
h
2
(t)
h
3
(t)
h
4
(t)
Σ
BIODEVICES 2008 - International Conference on Biomedical Electronics and Devices
198

∑
−
=
−
=
1
0
1
1
)(
1
N
n
mnnOI
OI
N
mR (1)
where N is the epoch length of the PRN (nominally,
1023 bits, or the equivalent number of samples).
The output at any time k can be stated as the sum
of the convolution of the impulse responses for the
channels and the respective inputs:
11() 22() 33()
00 0
...
kk k
k i ki i ki i ki
ii i
OIh Ih Ih
−−−
== =
=+ ++
∑∑ ∑
(2)
If we substitute this into the cross-correlation,
say for I
1
and the output:
...
1
1
...
1
1
...
1
)(
1
00
)(221
1
00
)(111
1
00
)(221
0
)(11
1
0
1
0
)(33
0
)(22
0
)(11
1
0
1
1
+
+=
+
+=
++
⎢
⎢
⎣
⎡
+=
∑∑
∑∑
∑∑
∑∑
∑∑
∑∑
−
=
−
=
−−
−
=
−
=
−−
−
=
−
=
−−
−
=
−−
−
=
−
=
−−
−
=
−−
−
=
−−
−
=
N
n
mn
i
imnin
N
n
mn
i
imnin
N
n
mn
i
imnin
mn
i
imni
N
n
n
mn
i
imni
mn
i
imni
mn
i
imni
N
n
nOI
hII
N
hII
N
hII
N
hII
N
hIhI
hII
N
mR
(3)
Given that:
∑∑
=
−
=
−
=
k
i
kik
k
i
iki
hIhI
0
1)(1
0
)(11
(4)
We can rearrange as follows:
)(
*
...)(
)(
...
1
1
)(
1
1
0
1
0
1
1
00
2)(21
1
00
1)(11
1
21
11
1
mh
hR
himR
himR
hII
N
hII
N
mR
i
II
mn
i
iII
mn
i
iII
N
n
mn
i
iimnn
N
n
mn
i
iimnnOI
=
=
+−
+−=
+
+=
∑
∑
∑∑
∑∑
−
=
−
=
−
=
−
=
−−
−
=
−
=
−−
(5)
The cross-correlation terms (those R
II
terms with
non-identical indices for I) will sum to zero, because
different Gold codes are effectively uncorrelated; so
only the first correlation is non-zero. In continuous
terms:
)(
)()(
)()()(
1
1
1
111
th
tht
thtRtR
IIOI
=
∗=
∗
=
δ
(6)
The output of the cross-correlation is the impulse
response of the channel, which represents the time-
domain transform of the information we want.
2.2 Hardware Implementation
Part of the proposed hardware implementation is
shown on the following page, with a number of
elements not shown to improve clarity. We use
transformer coupling of the drive currents to the EIT
electrodes in order to ensure matched source and
sink currents. There is a resistor in each transformer
secondary, to allow direct measurement of the
current in the secondary. The way in which the
system works is as follows. The microprocessor
system outputs currents which are modulated in
polarity by the Gold codes (using push-pull drive
from two port pins, with a series resistor for current
limiting). Each of the eight transformer secondaries
is connected to a pair of electrodes, so that each
electrode is connected to the high side of one
secondary and the low side of another.
In principle, the current between terminals T1
and T2 should have a fixed amplitude, modulated in
polarity by Code 1. In practice, we measure this
current by sampling the voltage at the points V
1
and
VT
1
, and dividing the difference by the resistor
value.
We can then calculate the impulse response for
the voltage between T
4
and T
5
, with respect to the
current between T
1
and T
2
, by cross-correlating the
voltages (V
1
- VT
1
) and (V
5
– V
4
); and so on.
2.3 Spectral Response of the CDM
System
As discussed earlier, PRN sequences have the
appearance of noise, and like uniformly distributed
white noise, their spectrum is flat within the limits of
bandwidth. They are also delta-correlated; that is to
say, their autocorrelation function consists of a Dirac
delta function at the origin. This is the basis of their
usefulness in demodulation, as shown above. From
(6) above we see that the input-output cross-
correlation function of a channel in the system pro-
WIDE-BANDWIDTH, HIGH FRAME RATE ELECTRICAL IMPEDANCE TOMOGRAPHY / SPECTROSCOPY - A
Code Division Multiplexing (CDM) Approach
199
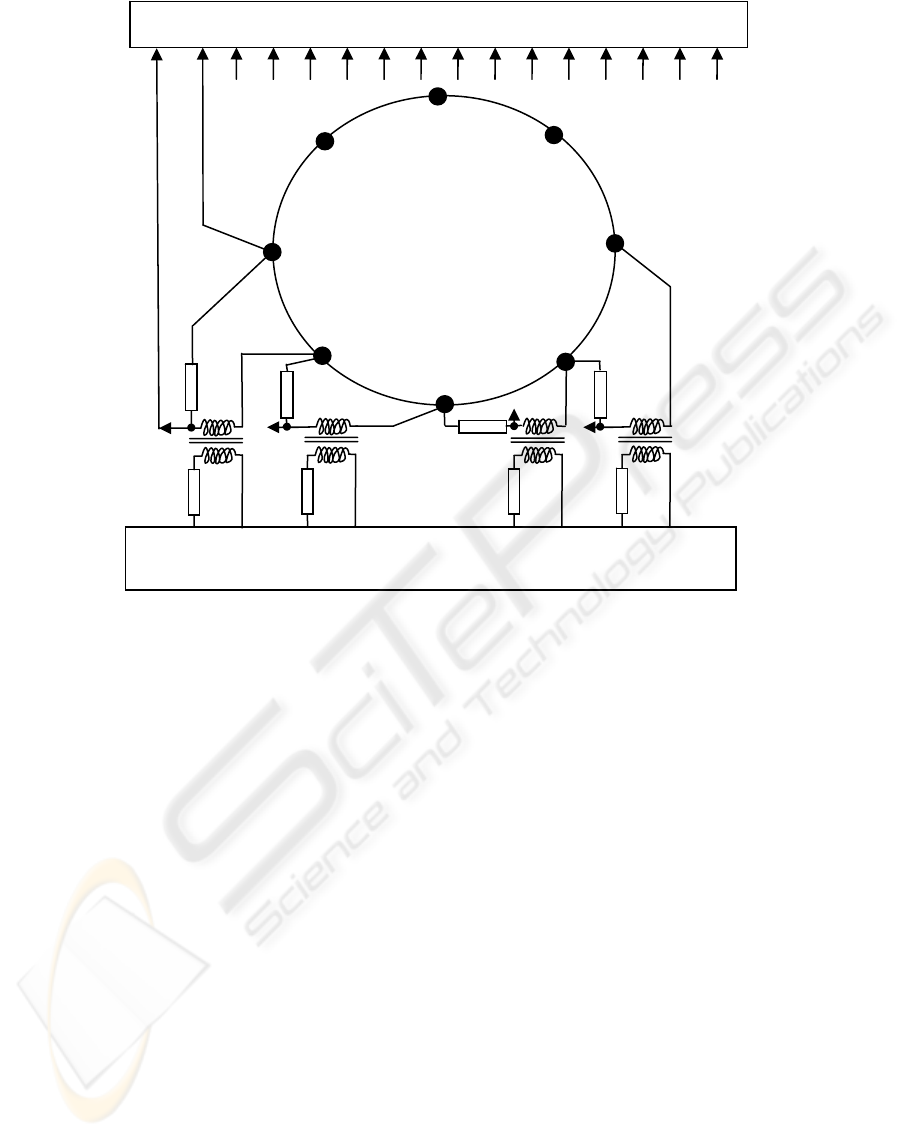
Figure 2: Block diagram of the proposed system, showing multiple electrodes at which drive and reception of signals is
combined. Transformer coupling allows inflowing and outflowing currents due to each code to be exactly balanced, as well
as providing isolation for safety. The voltage across each ballast resistor gives the current due to that code (e.g. the current
due to Code 3 is I
3
= (VT
3
- V
3
)/R
3
).
duces the transfer function h(t) of the channel. If we
take the Fourier transform of the cross-correlation
function:
)(
)(
)()(
,
ω
ω
ω
ω
h
dteth
dtetRG
tj
tj
OI
=
=
=
∫
∫
∞
∞−
−
∞
∞−
−
(7)
so, the Fourier transform of the cross-correlation
function produces the frequency response of the
channel; which is to say, the complex spectrum of
the channel impedance.
3 PROOF OF CONCEPT –
EXPERIMENTAL RESULTS
3.1 Method
In order to establish the workability of this concept,
we require to demonstrate two methods:
• The feasibility of extracting wide-range, high
resolution impedance measurements when
driving the channels with PRN codes.
• The feasibility of simultaneously stimulating
several channels and recovering the
individual signals from the multiplexed
signal by demodulation.
We have done this as a proof-of-concept by
conducting an imaging experiment with an existing
EITS system, using both the standard sinusoidal
waveforms, and a new waveform based on the Gold
code intended for CDM-EIT.
A serial, EITS system, the UCL Mk2.5, was
reprogrammed with the 1
st
1023-length code of a set
of eight Gold codes. Only one code was used as the
Mk2.5 is based on a single channel of the Sheffield
Mk3.5 system multiplexed to 32 electrodes. In
normal operation the Mk2.5 system measures the
spectrum using a 2048-length composite waveform
of 10 frequencies of equal amplitude,
logarithmically spaced between 2kHz and 1MHz
(McEwan et al., 2006; Wilson et al., 2001). The
Gold code was sampled at 2samples/bit to meet the
Code 1 Code 2 Code 3 Code 4
microprocessor / FPGA generating PRN codes with push-pull drive
V
1
V
2
V
3
V
4
V
5
VT
1
VT
2
VT
3
VT
4
PC with DAQ card sampling 16 channels ADC
V
6
– V
8
and
VT
5
– VT
8
omitted for
clarity
T
1
T
2
T
3
T
4
T
5
Volume or
sample under
test
R
3
R
2
R
1
R
4
BIODEVICES 2008 - International Conference on Biomedical Electronics and Devices
200
Nyquist criteria with an additional zero bit added to
ensure its length was 2
12
. This is required by the
matched filter which is performed by the system
DSP processor. As the length of both test waveforms
are the same, and the timing of the system clock
(2MHz) was unchanged, they span the same
frequency range of 2kHz-1MHz. For simplicity, and
to ensure that the instrumentation did not saturate,
the amplitude of the gold code waveform was set to
the maximum of the composite waveform.
An often used test of an EITS system is its
ability to produce images of an object in a tank filled
with saline solution. Boundary voltage
measurements are collected from the tank with and
without the object (so-called perturbation and
reference frames). These two sets of data are
subtracted then used with a reconstruction algorithm
to produce a time-difference image. In keeping with
previous EITS measurements we chose to use a
piece of banana as our object, as it changes
impedance by over 100% between 2kHz and 1MHz
(Yerworth et al., 2003). The saline solution’s
impedance will remain relatively unchanged over
the same frequency range and hence it is possible to
determine the spectrum of the object inside the tank
from a sequence of images at the measured
frequencies.
The tank was cylindrical, 10cm diameter, filled
with 0.1% saline solution with 16 stainless steel
electrodes in a ring. The test object was a cylinder of
banana, 2 cm long and 1 cm in diameter. Image
reconstruction was done using a linear solver
(EIDORS) (Polydorides and Lionheart, 2002) and a
15,000 element FEM mesh of the tank.
3.1.1 Results
The spectra for the banana object were constructed
by plotting the value of a pixel in the known position
of the object, at 10 different frequencies.
10
4
10
5
10
6
0
1
2
3
4
5
6
7
x 10
-3
Frequency (kHz)
Voltage(V)
(a)
10
4
10
5
10
6
0
1
2
3
4
5
6
7
x 10
-3
Frequency (kHz)
Voltage(V)
(b)
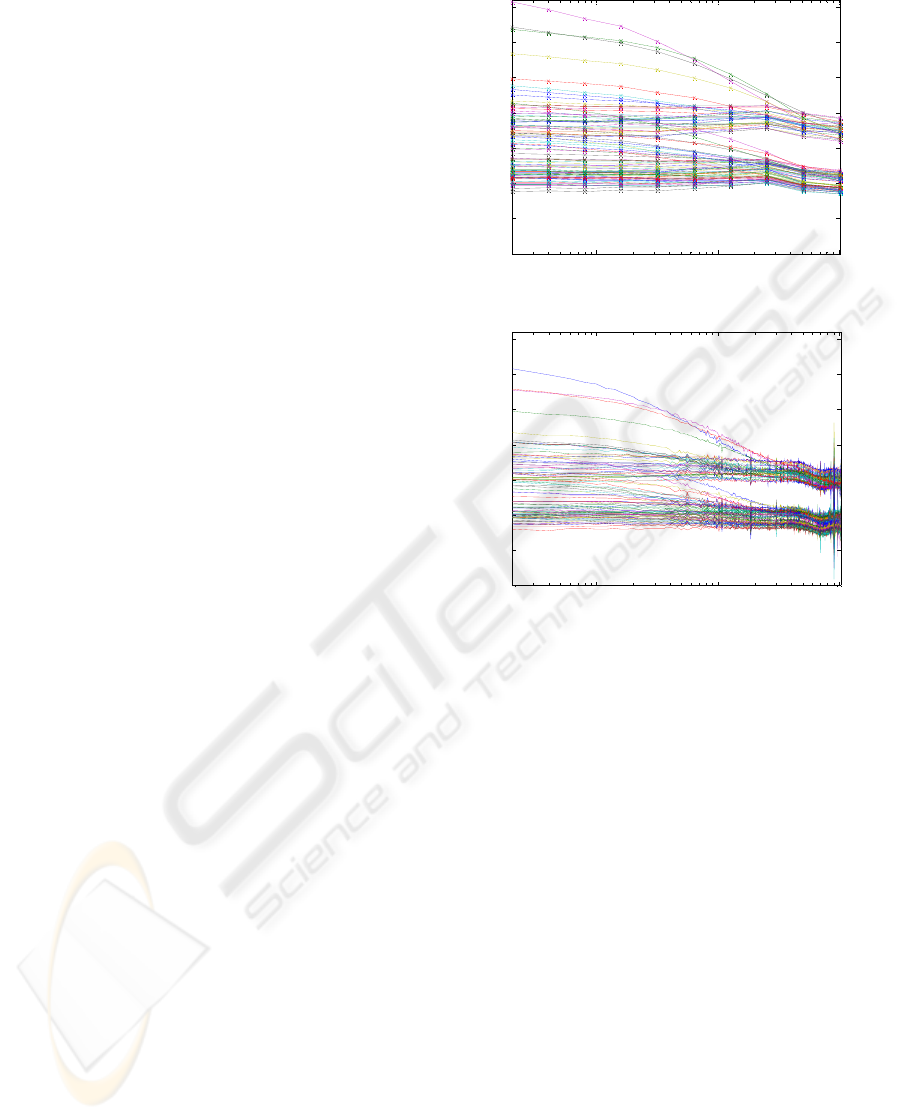
Figure 3: Comparison of boundary voltage measurements
in a single frame. Each line is a different electrode
combination measurement. Larger voltages occur when
the voltage electrodes are near current-carrying electrodes.
Combinations more sensitive to the perturbation show a
greater change over frequency. Figure 3(a) shows a
composite representation of the output of the standard 10
frequency system. Figure 3 (b) shows the output of the
new system, using PRN codes for excitation and
demodulation. It can be seen that the PRN codes provide
the same response as the standard method, but with a
much higher resolution in frequency.
WIDE-BANDWIDTH, HIGH FRAME RATE ELECTRICAL IMPEDANCE TOMOGRAPHY / SPECTROSCOPY - A
Code Division Multiplexing (CDM) Approach
201
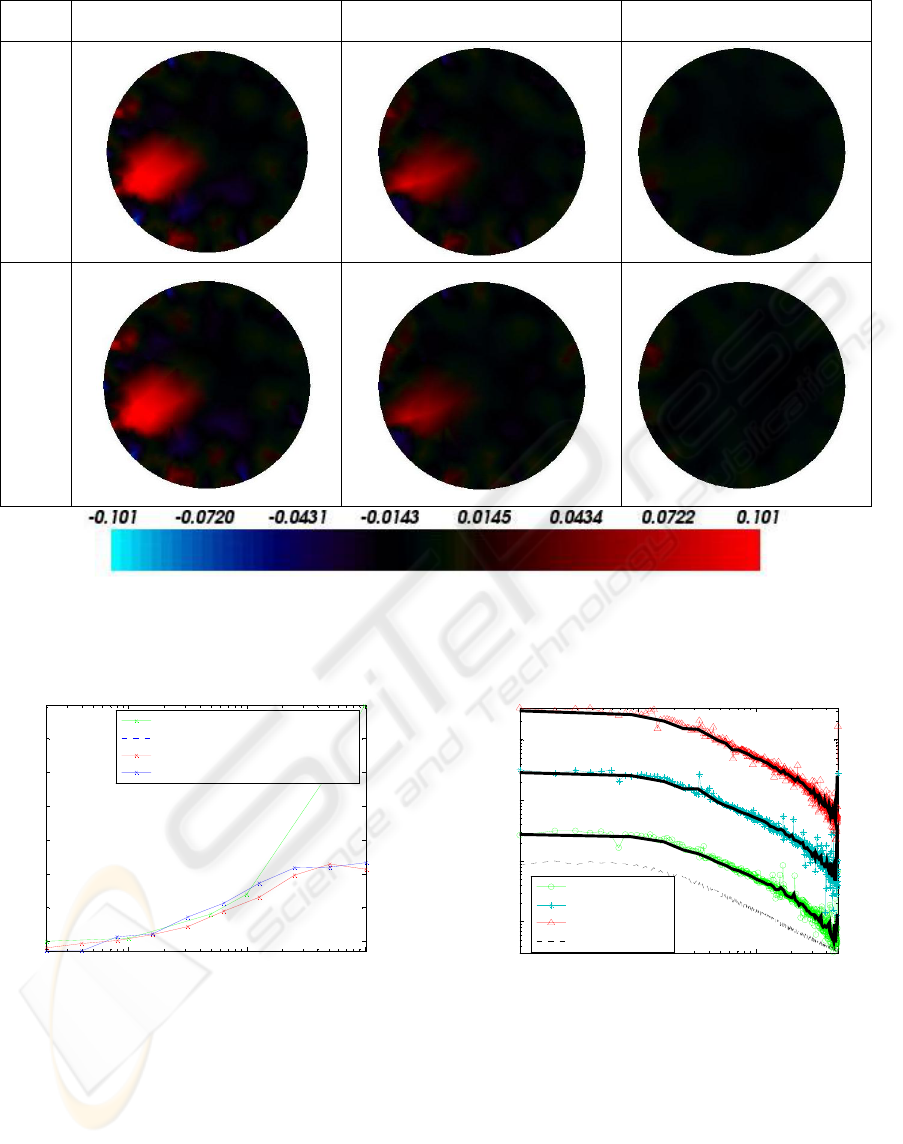
Figure 4: Time difference images collected at three frequencies using the two waveforms. As the frequency increases, the
contrast (impedance difference) between perturbation and background decreases. It can be seen that the new PRN (Gold
code) method offers the same resolution as the standard 10-frequency method, with the potential for significantly faster
operation.
10
1
10
2
10
3
0.05
0.1
0.15
0.2
0.25
0.3
0.35
0.4
Frequency (kHz)
Conductivity (S/m)
direct Z measurement, banana
Nacl
10 frequency composite waveform
Gold code
Figure 5: Spectra obtained from the data used in Figure 4.
These spectra are similar to those that have been
previously obtained from the Mk2.5 system. The new
method produces a spectrum which is very similar to the
standard method. Both EITS spectra deviate from a direct
measurement at frequencies above 128kHz, for reasons
explained below.
10
3
10
4
10
5
10
-1
10
0
10
1
10
2
Frequency (kHz)
Magnitude
3ch 1st channel
3ch 2nd channel
3ch 3rd channel
1ch only
Figure 6: Spectral magnitude for three multiplexed
channels, independently stimulated with PRN codes,
mixed together on a single circuit impedance, and then
demodulated. For clarity each channel has been multiplied
by 10
x
where x is the channel number. It can be seen that
the multiplexed signals can be independently recovered
after mixing, and are a good match (although noisier) to
the single channel case. The thick black lines show a
average spectra, possible due to the large number of
frequencies available in this method.
2kHz 64kHz 512kHz
10 frequency
composite waveform
Gold code waveform
BIODEVICES 2008 - International Conference on Biomedical Electronics and Devices
202

4 DISCUSSION
The boundary voltages measurements using the two
waveforms are similar, as shown in Figure 3. The
PRN code voltage measurements are 1mV lower,
due to the lower current per frequency component.
As this is constant between the perturbation and
reference frames, it is cancelled out in the
subtraction process and is not apparent in the
images. The PRN code boundary voltages appear to
be noisier, particularly at higher frequencies. In
practice these frequencies would be averaged
together reducing the noise. The Mk2.5 EIT system
has limited performance at frequencies above
128kHz due to the effect of 0.5m long unscreened
cables. These are likely to be the cause of the
increased noise seen in the PRN code spectra, a real
effect which is not seen in the lower frequency
resolution of the 10 frequency composite waveform.
The 128kHz limit is also apparent in the spectra,
which deviate from a direct impedance measurement
above this frequency.
We have shown the feasibility of using PRN
codes for EITS, both in extracting the system
impulse response, and in terms of simultaneous
excitation and demodulation. The images and
extracted spectra are very similar to those obtained
using the standard method, demonstrating the proof
of the concept of using CDM waveforms for EIT
acquisition. The primary advantage of greatly
increased frequency resolution for the same
acquisition time has been demonstrated. We are
currently implementing a multiple source system
which should lead to a system with two orders of
magnitude increase in frame rate over the standard
method, along with the improved frequency
resolution demonstrated here.
ACKNOWLEDGEMENTS
Action Medical Research RTF 3110 and The
University of Sydney International Visiting
Research Fellowship 2007.
REFERENCES
Beck, M.S. & Williams, R.A. (1996). Process
tomography: a European innovation and its
applications, Meas. Sci. Technol. , 7, 215–24.
Brown, B.H. (2001). Medical impedance tomography and
process impedance tomography: a brief review, Meas.
Sci. Technol., 12, 991-996.
Elliot, J. (2006). Electrical impedance tomography
imaging of a hydrocyclone, M.Sc thesis (University of
Cape Town).
Goldswain, G., & Tapson, J. (2006). Kernel ridge
regression for volume fraction prediction in electrical
impedance tomography, Meas. Sci. Technol., 17,
2711-2720.
Holder, D.S. (ed.) (2005). Electrical Impedance
Tomography: Methods, History and Applications,
Bristol and Philadelphia: IOP.
McEwan, A., Romsauerova, A., Yerworth, R., Horesh, L.,
Bayford, R., & Holder, D. (2006). Design and
calibration of a compact multi-frequency EIT system
for acute stroke imaging, Physiol. Meas., 27, S199-
S210.
Parkinson, B.W., & Spilker Jr., J.J. (1996). Global
Positioning System: Theory and Applications, vol. 1,
Am. Inst. Aeronautics and Astronautics Inc.,
Washington.
Polydorides, N. & Lionheart W.R.B. (2002). A Matlab
toolkit for three-dimensional electrical impedance
tomography: a contribution to the Electrical
Impedance and Diffuse Optical Reconstruction
Software project, Meas. Sci. Technol., 13, 1871-1883.
Tapson, J., & Teague, G. (2002). Method and Apparatus
for Electrical Impedance Tomography, SA Patent
2002/3689.
Teague, G. (2002). Mass Flow Measurement of Multi-
Phase Mixtures by Means of Tomographic
Techniques, PhD thesis, (University of Cape Town).
retrieved June 24, 2007 from
http://mysite.mweb.co.za/ residents/ jontapson/
Sarwate, D.V., & Pursley, M.B. (1980). Crosscorrelation
properties of pseudorandom and related sequences,
Proc. IEEE, 68, 593-619.
West, R. (ed,) (2002). Special Feature: Process
Tomography, Meas. Sci. Technol,. 13, 1799-1902.
Wilkinson, A.J., Randall, E.W., Durrett, D., Naidoo, T. &
Cilliers, J.J. (2003). The design of a 1000 frames per
second ERT data capture system and calibration
techniques employed. Proc. 3rd World Congress on
Industrial Process Tomography, Banff, 504-509.
Wilson, A.J., Milnes, P., Waterworth, A.R., Smallwood,
R.H., & Brown, B.H. (2001). Mk3.5: a modular,
multi-frequency successor to the Mk3a EIS/EIT
system, Physiol. Meas., 22, 49-54.
Yerworth, R.J., Bayford, R.H., Brown, B., Milnes, P.,
Conway, M. & Holder, D.S. (2003). Electrical
impedance tomography spectroscopy (EITS) for
human head imaging, Physiol. Meas., 24, 477-489.
Zimmermann, E., Glaas, W., Verweerd, A., Tillmann, A.,
& Kemna, A. (2002). Method and apparatus for rapid
tomographic measurements of the electrical
conductivity distribution of a sample, German patent
DE 102 38 824.
WIDE-BANDWIDTH, HIGH FRAME RATE ELECTRICAL IMPEDANCE TOMOGRAPHY / SPECTROSCOPY - A
Code Division Multiplexing (CDM) Approach
203
