
A HEART CELL GROUP MODEL FOR THE IDENTIFICATION
OF MYOCARDIAL ISCHEMIA
Mohamed A. Mneimneh, Micheal T. Johnson and Richard J. Povinelli
Electrical and Computer Engineering, Marquette University, 1515 Wisconsin ave, Milwaukee, Wisconsin,USA
Keywords: Inverse problem, Ischemia, Decision Tree.
Abstract: Due to the increasing prices of medical care, and especially due to cardiovascular injury; scientists are
looking for inexpensive and less invasive ways to diagnose myocardial ischemia. Many studies have shown
that the variations of the ST-segment in the ECG signal are an indicator for ischemia. For this purpose, this
work proposes an approach based on a heart cell group model and principle component analysis, using a
decision tree classifier to differentiate between the ischemic and healthy beats. The cardiac based model is
based on a physiological model of the electrical cycle of depolarization and repolarization of the atria and
ventricles. The model parameters are estimated by minimizing the squared error between the generated
signal and the recorded ECG. The approach is applied to beats from the Long-Term ST database, which
consists of 86 subjects and more than 20,000 beats in which 80% of the beats are ischemic and 20% are
healthy. A 10-fold cross validation test is performed over the dataset. The accuracy of this approach is
91.62%, with sensitivity of 95.09% and specificity of 75.66%.
1 INTRODUCTION
Ischemic heart disease is the leading cause of death
in the world with almost 14% of all deaths (AHA
2005) Moreover, the average number of individuals
who undergo a heart attack as a result of myocardial
ischemia in the United States is approximately 1.5
million cases, of which 500,000 are fatal (AHA
2005). Myocardial ischemia is defined as the
deprivation of oxygen in some portions of the
cardiac tissue due to a blockage in the coronary
artery. If the deprivation continues for an extended
period, the effected cardiac tissue will die; thus,
leading to a heart attack. Tissue that has died is no
longer functional and diminishes the mechanical
pumping function of the heart (Pardee 1920).
Early detection of ischemia is crucial because, in
most cases, the effects of myocardial ischemia are
reversible if detected early enough (Long 1980).
General screening of patients is vital to preventing
myocardial infarction, since ischemia can be present
without exhibiting symptoms.
This work proposes a cardiac based model,
Principle Component Analysis (PCA) and a C4.5
decision tree classifier for the detection of
myocardial ischemia. The cardiac model is based on
a physiological model of the electrical cycle of
depolarization and repolarization of the atria and
ventricles. The Sinoatrial (SA) node, the
Atrioventricular (AV) node, bundle branches,
Purkinje fibers, and left and right ventricles are
modelled as signal generators. The ECG is generated
by the difference in signal amplitudes arriving at the
positive and negative terminals of an ECG lead. The
model parameters are estimated through the
minimization of the squared error between the
generated signal and the recorded ECG. In addition
to the obtained model parameters, 50 of the
components from applying PCA to the signal are
used in the diagnosis. A C4.5 decision tree is then
used as a classifier to determine if a beat is healthy
or ischemic.
The purpose of using electrocardiogram signals
for the diagnoses of myocardial ischemia is because
it is one of the least expensive techniques available
to physicians. Figure 1 shows a labelled ECG signal
showing the P, Q, R, S, T waves, the ST segment
and the J point. The use of the ST level in the
detection of myocardial ischemia was hypothesized
in 1920 (Pardee 1920). Examples of low cost
methods are ST event alerts ($250 cost) and easy to
administer) with sensitivity of 46% and specificity
of 91% and exercise stress testing ($200-$300 cost)
with 68% accuracy of 68% (R. Gianrossi 1989).
51
A. Mneimneh M., T. Johnson M. and J. Povinelli R. (2008).
A HEART CELL GROUP MODEL FOR THE IDENTIFICATION OF MYOCARDIAL ISCHEMIA.
In Proceedings of the First International Conference on Health Informatics, pages 51-58
Copyright
c
SciTePress
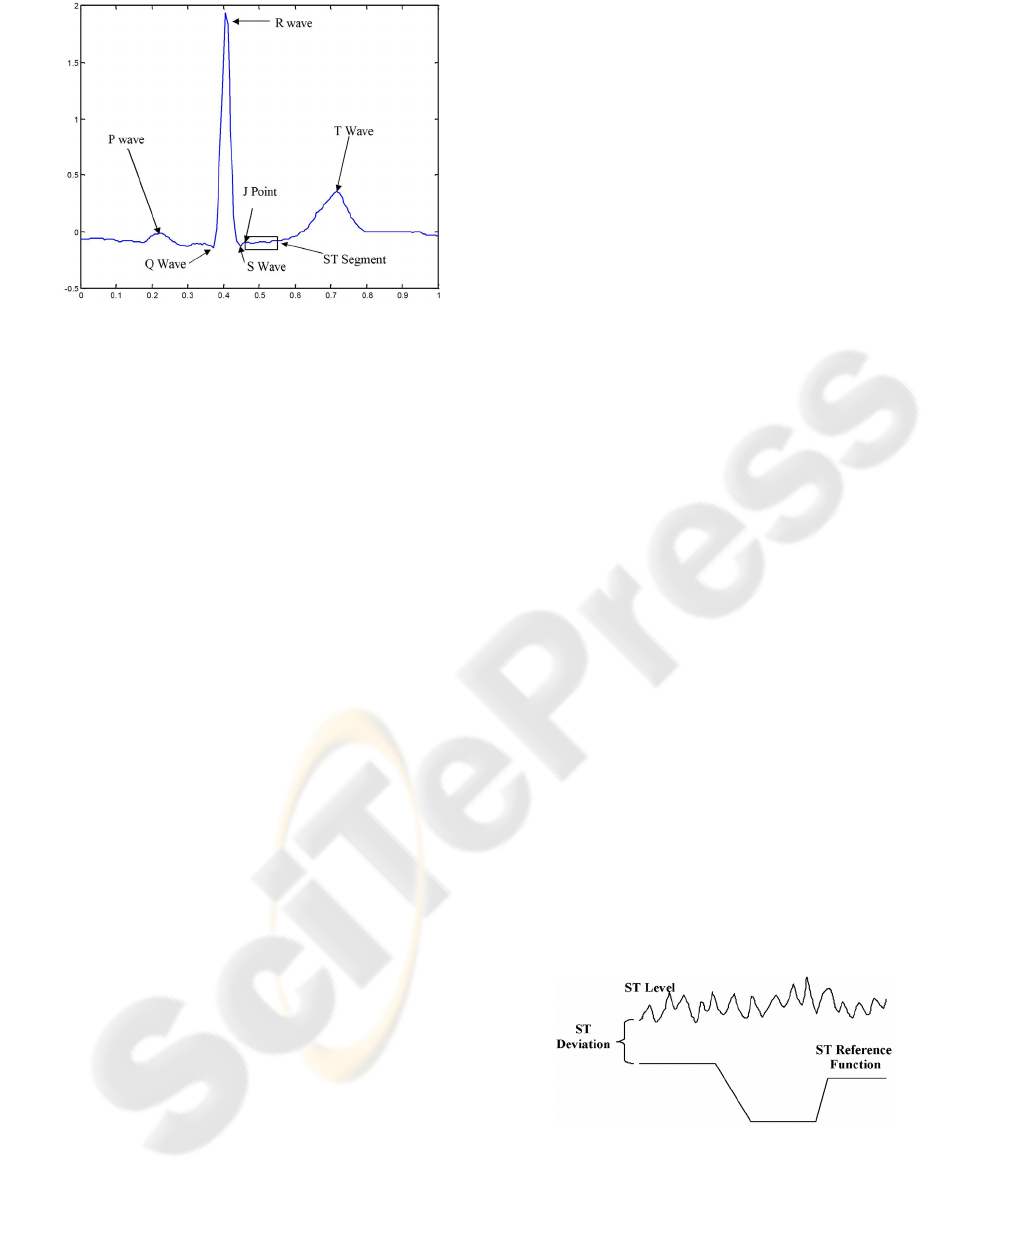
Figure 1: Labelled (ECG) signal.(Moody 2001).
Significant research has been undertaken to
develop a more accurate, less invasive, and less
expensive method for detecting myocardial
ischemia. Much of this research focuses on the use
of ECG signals. These methods build models or use
thresholds of the ST deviation to determine if a
patient’s ECG signal might indicate ischemia.
Previous techniques that dealt with ischemia
classification and detection when monitoring ECG
signals started with low accuracy that increased
significantly over time. These techniques are based
on the hypothesis that myocardial ischemia can be
detected by monitoring the ST variations.
Maglaveras et al. (N. Maglaveras 1994) have
investigated a method for ischemia detection that
uses supervised neural networks. The accuracy of
this approach is of sensitivity of 73.0% and positive
predictive accuracy of 69.5%.
RV Andreao et al. (R.V. Andreao 2004)
employed a Hidden Markov Model for beat
segmentation with the application of ischemia
detection. The accuracy of this model is of
sensitivity of 83.0% and positive predictive accuracy
of 85%.
Additionally, T. Stamkopoulos et al. proposed an
approach using nonlinear Principle Component
Analysis (PCA) and neural networks in the
identification of ischemic beats. The accuracy of this
approach was 80% for healthy and 90% for ischemic
beats when applied to the European ST-T Database
(Stamkopoulos 1998).
Similarly, Victor-Emil Neagoe applied a
Gaussian Neuro-Fuzzy Approach and PCA toward
the classification of myocardial ischemia. The
accuracy shown in the paper was 100% for 50
features. However, Neagoe dealt with only
identifying ischemic and normal patients. Moreover,
the number of training and testing data were 40
patients, half used for training and half for testing
(Victor-Emil Neagoe 2003).
2 DATA SET AND
PRE-PROCESSING
Various ECG and intracardiac datasets are available
for the use of modelling and detecting myocardial
ischemia. The data sets preserve the privacy of the
subjects as there are no direct or indirect identifiers
linking back to them.
2.1 Long Term ST Database
The Long-Term ST Database from PhysioNet
contains 86 Holter ECG recordings from 80
independent patients. Holter recordings are ECG
recordings recorded using portable recording
devices, generally taken over a long period. These
recordings were selected from the Holter libraries at
Beth Israel Deaconess Medical Center in Boston,
Physiolab (Laboratory of Biosignal Processing) of
the Institute of Clinical Physiology in Pisa, Brigham
and Womens Hospital in Boston, and the Zymed
company. The recordings vary in length from 20 to
24 hours. Each record contains either two or three
ECG leads. The records are digitized at 250 Hz with
12 bit resolution (Moody 2001).
Complete annotations have been provided for the
database. These annotations label the significant ST
shifts and episodes, the beginning (3-point) of most
ST segments has been annotated along with R wave
annotations using a 16 second averaging window.
The beats were detected using WQRS function as
part of the WFDB package supplied by the
Physionet (Moody 2001).
To aid in the development of an ischemia
classification algorithm, complete ST level
annotations have also been provided. These
annotations give the ST level, ST reference function,
and the calculated ST deviation. The ST reference is
expertly labelled moving average of the important
ST shifts. The ST deviation is calculated by
subtracting the ST level from the ST reference
function shown in Figure 2 (Jager, Taddei & Moody
2003).
Figure 2: Example of ST deviation calculation.
The data consists of 43 free records from 42
patients and 43 fee records from 38 patients. The
total number of beats used in this work is 20,528 for
HEALTHINF 2008 - International Conference on Health Informatics
52

both healthy and ischemic. The number of ischemic
beats is 16,794, while that of the healthy beats is
3734.
In order to evaluate the proposed classifier, a ten
fold cross validation is applied to the dataset. The
ten fold cross validation is described as follows:
1. Divide data into 10 set of size n/10
2. Train on 9 sets and test on 1 set
3. Repeat the process 10 times and take the
mean of the accuracy.
2.2 Signal Pre-processing
As mentioned in the previous section, the beats are
obtained automatically from the records using the
‘WQRS’ function provided by the Physionet
Toolkit. Each beat is then anchored such that the iso-
electric line prior to the P wave is set to zero. A
wavelet decomposition approach is used to denoise
the signal from high frequency noise (GD. Clifford
2005).
3 METHOD
The classification approach utilizes a heart cell
group model fitted to the patient’s ECG signal along
with the principle component analysis of the signal.
The method is described in the block diagram shown
in Figure 3.
A heart cell group model is used to generate a
template ECG signal. Then, using a nonlinear
constrained optimization technique, the model
parameters are updated until reaching a certain error
with the patient’s signal beat. The estimated model
fitting the ECG signal are then used with the PCA
components as features in the C4.5 decision tree
classifier.
Figure 3: Block diagram of the Ischemia diagnosing
method.
3.1 Heart Cell Group Model
Electrocardiograms indicate the electric activity of
the heart over the body surface. In general, two types
of model have been developed to characterize the
ECG signal. The first type is a model used for
interpolating experimental data and can be fitted to
ECG signals without having a reference to the
physical system. The second type is a model that can
characterize the ECG signal and can be related back
to the heart activity. The objective of this work is the
latter modelling approach, focusing on development
of a model that can estimate the activation sequences
of the heart cells from real patient ECG signals. This
objective is called the inverse problem. The
difficulty of this problem is that unless it is stated in
a particular manner, the solution will not be uniquely
defined.
Several techniques have been employed for
generating models to solve the forward and inverse
problem. These techniques overcome the uniqueness
problem by modelling the heart as a small number of
moving dipoles. Some of these techniques apply the
solution of Green’s theorem (Method of Moments)
or Multi-Pole technique to determine the scattering
of the electric waves over the heart. These methods
are considered accurate. However, the main
drawback of these techniques is the computational
complexity (Gulrajani 1998).
McSharry et al. presented a “dynamic ECG
model” that incorporates the ECG features as a
combination of Gaussian functions. Although this
model is easy to build, it cannot be related to the
heart cell activity (GD. Clifford 2005).
3.1.1 Proposed Cell Group Model
A Heart Cell Model (HCM) is proposed in this work
based on the reconstruction of the ECG signal using
a cell group model. This model accounts for the
wave propagation of the SA node, the AV node, the
bundle branches, Purkinje fibers, and left and right
ventricles. We hypothesize that the electric activity
of a heart cell group can be represented by a
difference of two sigmoid functions.
The electric activity of the myocardial cells is
caused by the variation of the positively and
negatively charged ions of the cells. As presented by
researchers (Andrew J. Pullan 2005), the electric
activity of the cell is given in
Figure 4 and it can be
approximated by a difference of two sigmoid
functions as shown in
Figure 5.
A HEART CELL GROUP MODEL FOR THE IDENTIFICATION OF MYOCARDIAL ISCHEMIA
53

Figure 4: Conduction activity of the heart.
Figure 5: Proposed heart cell activity.
The cell group activity is modelled as the difference
between two sigmoid functions:
()
()
()
22
11 2 2
11
1
,,,,
1
1
,
1
atc
atc
ftacac k
e
k
e
−
−
=−
+
⎛⎞
⎜⎟
⎝⎠
+
, (1)
where k represents the magnitude of the wave, a
1
and a
2
control the rising slope, and c
1
and c
2
control
the translation in the direction of the time axis.
We hypothesize that the cumulative ECG signal
is generated from the atrial and ventricular
conduction activity. In this work, the P wave is
assumed to be generated from the SA node activity;
the PR interval from the AV node activity, and the
QRS complex and T wave are generated from the
activation of the bundle branches, the Purkinje fibers
and, the right and left ventricles.
3.1.2 ECG Generation
As presented above, the ECG signal can be
generated from the activation sequences of the heart
cell groups. The same steps are used to generate the
ECG from the modelled activation sequences. The
model divides the heart into groups or nodes. Each
node consists of a combination of cells at the SA
node, the AV node, the bundle branches, the
Purkinje fibers and, the right and left ventricles.
Each node activation and deactivation sequence is
represented as the difference between two sigmoid
functions. The variables in the sigmoid functions
consist of the magnitude, inflection (activation)
point and the inclination slope. By summing the
potential difference of the node signals at the
positive and negative terminals of each lead, the
ECG signal is generated:
()
[]
,,,,,
ˆ
ECG
i SAAVBbPfLVRV
ii
f
ff
∈
+−
=−
∑
, (2)
where:
• SA and AV represent the activity of the
SA and the AV node respectively.
• Bb and Pf represent the activity of the
bundle branches and Purkinje fibers
respectively
• LV and RV represent the activity of the
Left and right ventricles respectively
•
f
+
and
f
−
are the difference between
two sigmoid functions as presented in (1)
for each of the nodes at the positive and
negative probes respectively
The following sections presents how the ECG
wave features are generated. The features are the P
wave, the PR segment, the Q wave, the R wave, and
the S wave (QRS complex), ST segment, and T
wave.
3.1.3 P Wave Generation
The P wave is generated from the potential
difference between the electric conduction activity
measured at the atrial cells at the positive and
negative probes. In this approach, the atrial
conduction activity at a single probe is estimated by
equation (1). Moreover, it is hypothesized that the P
wave can be generated from the conduction activity
of the SA node:
(
)
wave SA SA
Pff
+−
=−
, (3)
The generation of the P wave using the
difference of sigmoid estimation is shown in
Figure
6
.
0 50 100 150 200 250
-50
0
50
100
150
time (s)
SA activity
SA
+
SA
-
0 50 100 150 200 250
0
10
20
30
40
50
time (s)
P Wave
Figure 6: P wave generation using the differential sigmoid
model.
HEALTHINF 2008 - International Conference on Health Informatics
54

3.1.4 PR Segment Generation
The PR segment occurs as the impulse travels from
the AV node through the conducting tissue (bundle
branches, and Purkinje fibers) towards the
ventricles. Most of the delay in the PR segment
occurs in the AV node. The PR segment is generally
at the baseline; however, variations might occur due
to certain heart diseases. Thus, by modelling the
electric activity of the AV node as proposed in (1),
and similar to the procedure shown in (3), we are
able to generate the variations in the PR segment as
shown in Figure 7.
0 50 100 150 200 250
-10
0
10
20
30
time (s)
AV activity
AV
+
AV
-
0 50 100 150 200 250
-25
-20
-15
-10
-5
0
time (s)
PR interval
Figure 7: PR interval generation using the differential
sigmoid model.
3.1.5 QRS Complex and T Wave Generation
The QRS complex and the T wave denote the
interval for the beginning and end of the ventricular
activation. When generating the QRS complex, the
activity of the cell groups of the bundle branches,
Purkinje fibers, and left and right ventricles are
modelled during the ventricular cycle. The
representation of the model for the QRS complex
and T wave in an ECG signal is dependent on the
difference between the positive and negative
electrodes at the modelled cell groups.
Figure 8
through Figure 10 show how each wave of the QRS
complex and the T wave are generated using the
differential sigmoid model.
0 50 100 150 200 250
-10
0
10
20
30
time (s)
AV activity
AV
+
AV
-
0 50 100 150 200 250
-25
-20
-15
-10
-5
0
time (s)
PR interval
Figure 8: R wave and T wave generation.
0 50 100 150 200 250
-10
0
10
20
time (s)
LV activity
LV
+
LV
+
0 50 100 150 200 250
-20
-15
-10
-5
0
time (s)
ST segment
Figure 9: R wave and T wave generation.
0 50 100 150 200 250
-100
0
100
200
300
time (s)
RV activity
RV
+
RV
+
0 50 100 150 200 250
-100
-50
0
50
100
time (s)
R wave ; T wave
Figure 10: S wave and T wave generation.
0 50 100 150 200 250
-10
-5
0
5
10
15
20
time (s)
LV activity
LV
+
LV
+
0 50 100 150 200 250
-20
-15
-10
-5
0
time (s)
ST segment
Figure 11: ST segment generation.
3.1.6 Parameter Estimation and Signal
Fitting
This section discusses how to determine the
parameters of the activation sequences in order to
generate a real patient ECG signal. In order to
achieve this task, a parameter estimation of the
proposed model (1) and (2) is performed using the
minimization of the least squares with the real ECG
A HEART CELL GROUP MODEL FOR THE IDENTIFICATION OF MYOCARDIAL ISCHEMIA
55
signal. This process was performed with the help of
the fmincon function, in Matlab, which finds a
constrained minimum of a function for several
variables. The function being minimized is given:
()
2
ˆ
ECG
signal
Error ECG f= −
∑
, (4)
The constraints applied to the function are that
the atrial activity occurs prior to that of the
ventricles. Moreover, the activation of the cell
activity is constrained to occur prior to that of the
deactivation. Additionally, the slopes of the
activation are higher than those of the deactivation
curves.
A template initial condition with known
parameters for
ˆ
E
CG
f
is used to set the initial condition
for the optimization process. Additionally, a
dynamic template is generated for each beat. This
choice of the template depends on the sign of the R
peak. This allows more accuracy during the
nonlinear optimization process. The highest cross-
correlation point between the initial template the
patient signal is then chosen.
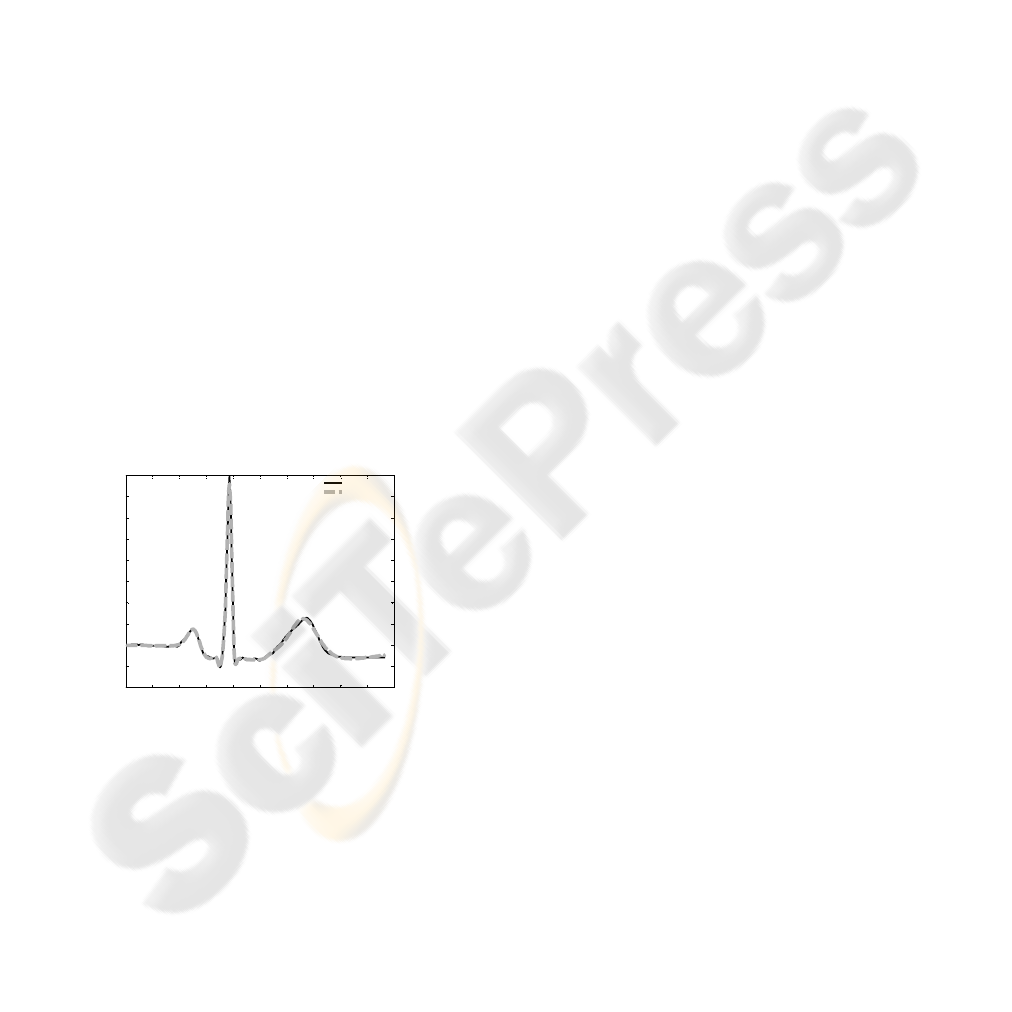
Figure 12 shows the real and estimated ECG
signal. It can be seen that the ‘fitted’ signal
generated from the model matches the original
patient signal. The model parameters used to
generate the fitted signal are used as features in the
classification process.
0 0.1 0.2 0.3 0.4 0.5 0.6 0.7 0.8 0.9 1
-100
-50
0
50
100
150
200
250
300
350
400
time (s)
ECG
Real Signal
Estimated Signal
Figure 12: Estimated signal and original ECG signal.
3.2 Principle Component Analysis
Principle Component Analysis (PCA) is a linear
transform where the basis functions are taken from
the statistics of the signal, and can thus be adaptive.
It is optimal in the sense of energy compaction, i.e it
places as much energy as possible in as few
coefficients as possible. The PCA is typically
implemented using Singular Value Decomposition.
The transform is generally not separable, and thus
the full matrix multiplication must be performed:
,
T
X
Uxx UX==, (5)
where the U is the basis for the transform. U is
estimated from a number of x
i
where
[
]
0:ik∈
[
]
()
12
T
k
T
UV xx x A
UeigvecAA
Σ
==
=
…
. (6)
3.3 C4.5 or J48 Decision Tree
Decision trees represent a supervised approach to
classification. A decision tree is a simple structure
where non-terminal nodes represent tests on one or
more attributes and terminal nodes reflect decision
outcomes. Generally, a decision tree algorithm
chooses the attributes that best differentiates the
output attribute values. The Weka classifier package
(Eibe Frank 2007) has its own version of C4.5
known as J48. Weka’s J48 is used in this work to
solve the classification problem.
4 RESULTS
The HCM-PCA/C4.5 classifier is applied to the
Long Term ST-Database. The proposed approach is
compared to the technique proposed in
(Stamkopoulos 1998). As mentioned before, the beat
is detected using an automatic tool ‘wqrs’ provided
by Physionet. The high frequency noise in the signal
is removed using wavelet decomposition (Clifford
2006). The model is fitted to the model by
minimizing the sum squared error using a
constrained optimization process. The constraints
are used to maintain the order of the heart’s
activation sequences. That is, the atrial activation
occurs prior to that of the ventricles and the
depolarization event occurs prior to the
repolarization. The model parameters are used in the
classification process, i.e. as features to determine
whether a beat is ischemic or healthy.
A C4.5 decision tree is used in the classification
process. As mentioned above, a 10 fold cross
validation is performed. The classification method is
applied with and without using the PCA components
as features. Using the model parameters without the
PCA features, the accuracy is 87.83% with
sensitivity and specificity of 92.62% and 65.69%,
respectively. Using the PCA features without the
model parameters leads to an accuracy of 87.83%
with sensitivity and specificity of 93.8% and 72.7%.
However, when using the PCA features in addition
to the model parameters, the accuracy increases to
HEALTHINF 2008 - International Conference on Health Informatics
56

91.62% with sensitivity of 94.89% and sensitivity of
75.66%. Sensitivity and specificity are defined as the
accuracy of detecting the ischemic beat and the
accuracy of detecting the non ischemic beat
respectively. The confusion matrices for the
proposed approaches are given in Table 1, Table 2,
and Table 3 respectively. Confusion matrix is a
visualization tool that presents the instances
classified as ischemic or healthy in its columns and
the actual classification in its rows.
Table 1: Confusion Matrix for HCM /C4.5 approach.
Classified as
Ischemic Healthy
Ischemic 15608 1255
Healthy 1243 2421
Table 2: Confusion Matrix for PCA/C4.5 approach.
Classified as
Ischemic Healthy
Ischemic 15877 986
Healthy 1044 2620
Table 3: Confusion Matrix for HCM-PCA/C4.5 approach.
Classified as
Ischemic Healthy
Ischemic 16035 828
Healthy 892 2772
It can be seen from Table 1 and Table 2 that the
sensitivity of the proposed approach increases by
10% when using the PCA components in addition to
the model parameters as features in the C4.5
decision tree classifier.
As mentioned above, the proposed approach is
compared to the techniques of (Stamkopoulos 1998)
as applied to the LT-ST database.
Table 4: Comparison between the proposed approach and
previous methods.
Approach Accuracy Sensitivity Specificity
HCM-PCA/C4.5 91.62% 94.89% 75.66%
Stamkopoulos 86.76% 91.73% 63.86%
It can be appreciated from Table 4 that the
proposed HCM-PCA/C4.5 approach performs better
than the previous methods by (Stamkopoulos 1998)
for the LT-ST database. However, we have not been
able to replicate the results of (Victor-Emil Neagoe
2003).
The importance in the proposed model, HCM, is
that it can be related back to the heart’s physical and
electrical activity. It can be seen that the parameters
of the HCM can be used in the detection of ischemic
and healthy heart beats. This is due to the fact that
the model parameters captured the information
regarding the ECG waves and segments, such as
slope, interval duration, magnitude and segment’s
variation.
5 CONCLUSIONS
A HCA-PCA/C4.5 approach is presented in this
work to diagnose ischemic and healthy beats. The
proposed approach is applied to the LT-ST database
provided by Physionet. The approach showed
excellent results when diagnosing ischemic and
healthy beats. The proposed modelling approach
provides a method to identify the features of ECG
signals and an estimate to the cellular eclectic
activity useful for ischemia detection. Finally, the
proposed classification approach can be extended to
detect different cardiac diseases.
REFERENCES
AHA 2005, Heart Disease and Stroke Statistics, Dallas,
Texas: American Heart Association.
Andrew J. Pullan, M.L.B., Leo K. Cheng 2005,
Mathematically Modeling the Electrical Activity of the
Heart from Cell to Body Surface and Back Again
,
World Scientific, New Jersey.
Clifford, G. 2006, 'ECG Bag',
<http://www.mit.edu/~gari/CODE/ECGtools/>.
Eibe Frank, M.H., Geoff Holmes, Mike Mayo, Bernhard
Pfahringer, Tony Smith, Ian Witten 2007,
WEKA, The
University of Waikato.
GD. Clifford, P.M. 2005, 'Method to Filter ECGs and
Evaluate Clinical Parameter Distortion Using Realistic
ECG model Parameter Fitting', Computers in
Cardiology
.
Gulrajani, R.M. 1998, 'The forward and inverse problems
of electrocardiography', vol. IEEE Engineering in
Medicine and Biology Magazine, pp. 84 - 101.
Jager, F., Taddei, A. & Moody, G. 2003, 'Long-term ST
database: A reference for the development and
evaluation of automated ischaemia detectors and for
the study of the dynamics of myocardial ischaemia.'
Medical and Biological Engineering and Computing,
vol. 41, pp. 172-171 182.
Long, C. 1980, Prevention and rehabilitation in ischemic
heart disease
, Baltimore: Williams & Wilkins.
Moody, J.M. 2001,
Preventive cardiology : strategies for
the prevention and treatment of coronary artery
disease
, Humana Press, Totowa, N.J.
N. Maglaveras, T.S., C. Pappas, and M. Strintzis 1994,
'Use of neural networks in detection of ischemic
A HEART CELL GROUP MODEL FOR THE IDENTIFICATION OF MYOCARDIAL ISCHEMIA
57

episodes from ECG leads', Neural Networks for Signal
Processing
, pp. 518-524.
Pardee, H. 1920, 'An electrocardiographic sign of coronary
artery obstruction', Arch Int Med, vol. 26, pp. 244-257.
R. Gianrossi, R.D., D. Mulvihill, K. Lehmann, P. Dubach,
A. Colombo, D. McArthur, and V. Froelicher 1989,
'Exercise- induced ST depression in the diagnosis of
coronary artery disease. A meta-analysis', Circulation,
vol. 80, pp. 87-98.
R.V. Andreao, B.D., J. Boudy, J.C.M. Mota 2004, 'ST-
segment analysis using hidden Markov Model beat
segmentation: application to ischemia detection',
Computers in Cardiology, pp. 381 - 384.
Stamkopoulos, T.D., K. Maglaveras, N. Strintzis, M.
1998, 'ECG analysis using nonlinear PCA neural
networks for ischemia detection',
IEEE Transactions
on Signal Processing
, vol. 46, no. 11.
Victor-Emil Neagoe, I.-F.I., Sorin Grunwald 2003, 'A
Neuro-Fuzzy Approach to Classification of ECG
Signals for Ischemic Heart Disease Diagnosis',
AMIA
Annu Symp Proc
, p. 494–498.
APPENDIX
The cost function for the constrained optimization
function is obtained by replacing (1) into (2):
()
2
,,,
,,
min , ,
iii
x
iSAAVBb
Pf LV RV
ECG k g t
=
−
⎛⎞
⎜⎟
⋅
⎜⎟
⎝⎠
∑
∑
ac , (7)
(
)
()
()
,1 ,1 ,2 , 2
,3 ,3 ,4 ,4
,, , , , ,
,,,,
ii i i i i
ii ii
g
tdtacac
dta c a c
=
−
ac
, (8)
()
(
)( )
11 2 2 11 2 2
,,,, ,, ,,dtacac stac stac=−
, (9)
()
()
1
,,
1
at c
stac
e
−−
=
+
, (10)
Subject to the constraints:
() ()
1,3 2, 4ii
cc< ,
() ( )
1,3 1,3SA AV
cc< ,
() ( )
1,3 1,3SA Rvep
cc<
,
,
() ( )
2,4 1,3SA AV
cc< ,
() ( )
2,4 1,3AV Rvep
cc< ,
() ( )
2,4 1,3AV Rven
cc< ,
() ( )
2,4 1,3AV Lvep
cc<
,
,
() ( )
2,4 1,3AV Lven
cc< ,
() ()
2,4 1,3Rven Lvep
cc< ,
() ()
2,4 1,3Rven Rvep
cc<
,
,
() ()
1,3 1,3Rvep Lvep
cc< ,
() ()
2,4 2,4Lvep Rvep
cc< ,
() ()
1,3 1,3Rvep Lven
cc< ,
() ()
2,4 2,4Lven Rvep
cc< ,
() ()
1,3 1,3Lvep Lven
cc<
,
,
() ()
2,4 2,4Lven Lvep
cc< ,
() ()
42
0.05 0.12
SA SA
cc<−<
,
() ()
42
0.05 0.12
SA SA
cc<−<
() ()
42
0.05 0.10
AV AV
cc<−<,
() ()
31
0.05 0.08
Rvep Rvep
cc<−<,
() ()
42
0.05 0.10
Rvep Rvep
cc<−<,
() ()
42
0.05 0.03
Rven Rven
cc<−<,
() ()
31
0.05 0.03
Lvep Lvep
cc<−<
,
() ()
42
0.05 0.10
Lvep Lvep
cc<−<
,
() ()
34
0.05 0.10
Lvep Lvep
cc<−<.
HEALTHINF 2008 - International Conference on Health Informatics
58
