
STAINING PATTERN CLASSIFICATION IN ANTINUCLEAR
AUTOANTIBODIES TESTING
Paolo Soda and Giulio Iannello
Facolt
`
a di Ingegneria, Universit
`
a Campus Bio-Medico di Roma, Via Alvaro del Portillo 28, Roma, Italy
Keywords:
Computer Aided Diagnosis (CAD, Multiple Expert Systems, Classifier Aggregation, Medical Imaging, Indi-
rect ImmunoFluorescence (IIF), HEp-2 Cell Classification.
Abstract:
In Indirect Immunofluorescence (IIF) the use of Computer-Aided Diagnosis (CAD) tools can support physi-
cians’ estimation of both fluorescence intensity and staining pattern. This paper reports our experiences in the
staining pattern recognition of IIF wells. Since several cells constitute each well, we have developed a Multiple
Expert System (MES) based on the one-per-class approach devised to classify the pattern of individual cells.
As a novelty, we introduce an aggregation rule based on the estimation of the reliability of each composing
experts. Then, the whole well staining pattern is computed using the reliability of its cells classification. The
approach has been successfully tested on an annotated set of IIF images.
1 INTRODUCTION
Connective tissue diseases (CTD) are autoimmune
disorders characterized by a chronic inflammatory
process involving connective tissues. Detection of
antinuclear antibodies (ANA) is a common marker
in patients with suspected CTD. The recommended
method for ANA testing is the Indirect Immunoflu-
orescence (IIF) microscopy based on HEp-2 sub-
strate (Center for Disease Control, 1996). IIF slides
are examined at the fluorescence microscope, and
physicians report both the fluorescence intensity clas-
sification and the staining pattern description. The
former is scored semi-quantitatively with respect to
both positive and negative controls contained in each
slide (Center for Disease Control, 1996). The latter is
reported only for positive samples, since they may re-
veal different patterns of immunofluorescent staining
that are relevant to diagnostic purposes. Indeed, more
than thirty different nuclear and cytoplasmic patterns
could be identified, which are given by upwards of
one hundred different autoantibodies. In the literature
such patterns are typically grouped in the following
classes (Rigon et al., 2007; Sack et al., 2003), that are
specific to the most relevant and recurrent autoanti-
bodies: (a) Homogeneous, staining of the interphase
nuclei and of the mitotic cells chromatin; (b) Periph-
eral nuclear or Rim, staining around the outer region
of the nucleus, with weaker staining toward the cen-
ter; (c) Speckled, fine or coarse granular nuclear stain-
ing of the interphase cell nuclei; (d) Nucleolar, large
coarse speckled staining within the nucleus, less than
six in number per cell; (e) No pattern: unclassifiable
pattern. Figure 1 depicts four examples of easily dis-
tinguishable staining patterns. No instance of the no
pattern class is reported since it is quite impossible
to find positive wells belonging to that class, whereas
some cells without a classifiable pattern can occur in
a given well.
The staining patterns may be evaluated at various
dilutions. On the one hand at high titer, e.g. 1:160,
they are usually clearly describable even if they con-
temporaneously occur, since only very positive sera
exhibit detectable fluorescence intensity. On the other
hand low dilutions, e.g. 1:40, allow detecting weak
positive sera. An intermediate 1:80 dilution is the
recommended and the most used one (Center for Dis-
ease Control, 1996), even because it allows not car-
rying out the end-point dilution
1
. At such a titer the
staining patterns are not easily detectable since both
strong and weak positive sera are positive. Indeed, for
the former sera the staining pattern is usually evident,
whereas for the latter it is not noticeable.
In the field of autoimmune diseases, the avail-
ability of accurately performed and correctly reported
laboratory determinations is crucial for the clinicians,
demanding for highly specialized personnel that are
1
End-point dilution consists of patient serum progres-
sive dilution, until the fluorescence intensity disappears. It
is very expensive in time and cost, because the analysis of a
single patient requires more than a well.
231
Soda P. and Iannello G. (2008).
STAINING PATTERN CLASSIFICATION IN ANTINUCLEAR AUTOANTIBODIES TESTING.
In Proceedings of the First International Conference on Health Informatics, pages 231-236
Copyright
c
SciTePress

given by:
W S
i
=
∑
X
φ(x) · I
i
(x) (1)
where φ(x) indicates the classification reliability of
input cell x and I
i
(x) denotes an indicator variable de-
fined as follows:
I
i
(x) =
1 if the cell x belongs to class C
i
0 otherwise
(2)
The index of the final class of well staining pattern
is υ = argmax
i
(W S
i
), i.e. the class for which W S
i
is
maximum.
3 ARCHITECTURE OF CELLS
RECOGNITION SYSTEM
Preliminary results on the classification of the stain-
ing pattern of individual cells suggested us to use a
combination of experts rather than a single one. In
this respect, in the literature it has been observed that
the recognition performance attainable combing set of
classifiers, as well as different features, should be im-
proved by taking advantages of the strengths of the
single experts, without being affected by their weak-
ness.
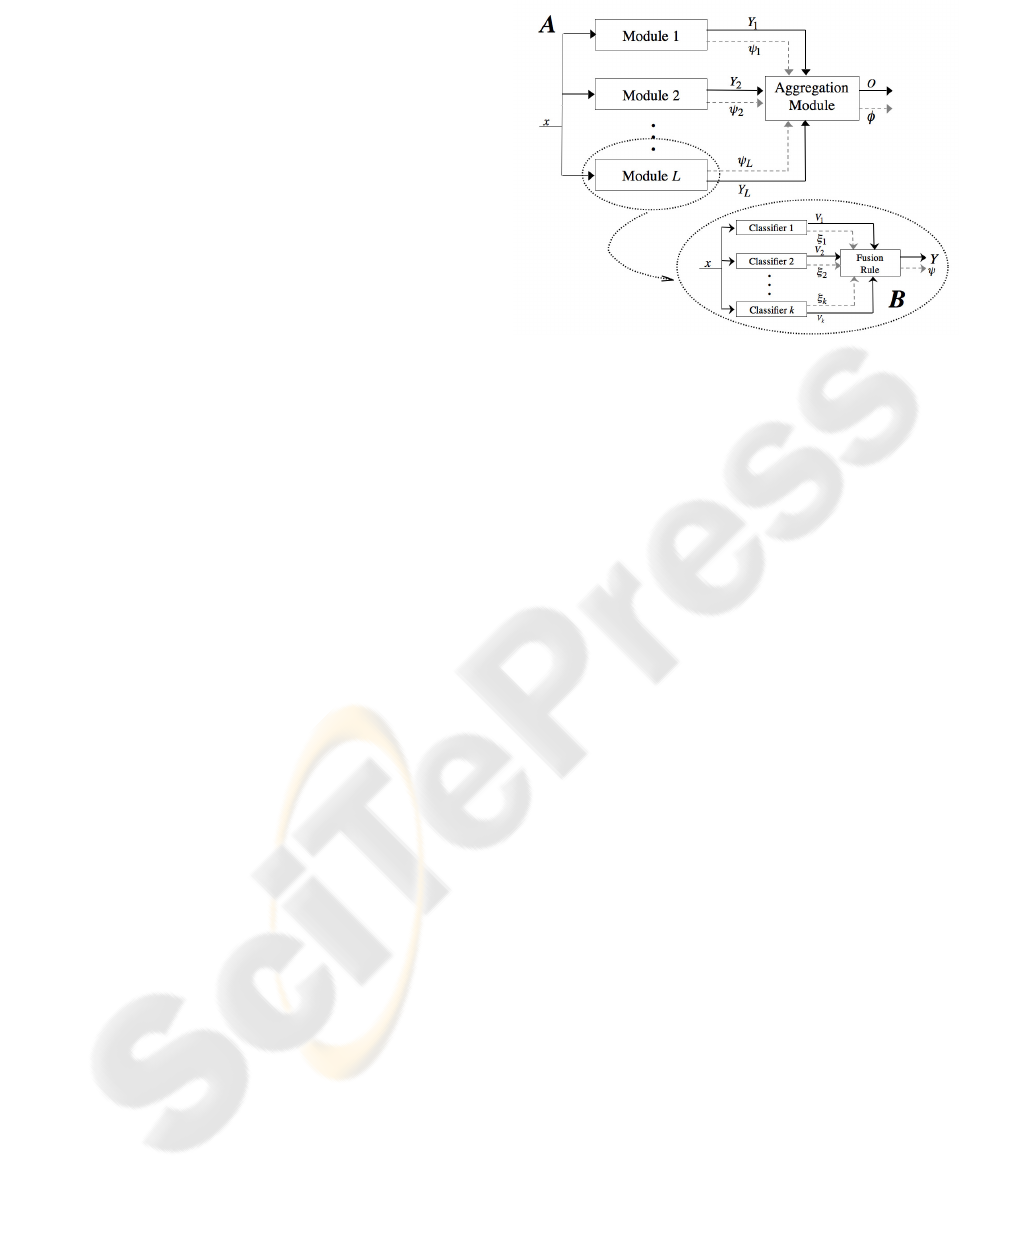
As recognition system we employ a Multi-Expert
Systems (MES) based on the one-per-class paradigm,
which assumes that the multiclass learning problem is
reduced to several binary classification tasks (Jelonek
and Stefanowski, 1998; Allwein et al., 2001). Given
the number L of classes in which the input samples
are distributed, the MES is composed by L modules,
each one being an expert in the recognition of one in-
put class from the other (part A of figure 2). The base
blocks should be considered complementary rather
than competitive. Their predictions are aggregated
to a final classification decision on a basis of a given
rule. Indeed, in the figure the individual decisions are
given to an aggregation module, which identifies the
block that is the most likely to be correct for any input
sample.
The rationale of such an architecture is inspired
by the results coming out from the feature selection
phase: the set of stable and effective features obtained
for each class enforced the evidence that the classifi-
cation could be reliably faced by introducing one spe-
cialized module per each class that the system should
recognize.
From a theoretical point of view, each module of
A in figure 2 can be constituted either by a single
classifier or by employing again a multiple experts
scheme. In the latter case, the classifiers combination
can be based on both fusion (e.g. as in (Kuncheva
Figure 2: The system architecture. Part A: aggregation of
binary modules. Part B: each module is composed by a fu-
sion of experts.
et al., 2001; Gunes et al., 2003)) and selection tech-
niques (e.g. as in (Xu et al., 1992; Giacinto and Roli,
2001)), or on a mixture of them (e.g. as in (Kuncheva,
2002)). The fusion scheme supposes that all classi-
fiers are equally “skilled” and applied in parallel over
the whole feature space, providing robustness by mul-
tiplying the number of observation channels, which
are then combined in a data fusion block. The selec-
tion scheme, assuming that each classifier is an ex-
pert in some local area of the feature space, identifies
which expert has the biggest accuracy in a local re-
gion surrounding the sample, letting it label the input.
To improve the recognition performance attainable by
the L modules, we implement them with multiple bi-
nary classifiers combined by fusion, as depicted in
part B of figure 2. Specifically, as a fusion rule we
use Weighted Voting (WV) (Cordella et al., 1999).
The overall resulting system architecture combin-
ing the different MES schemes will be referred to
as Hybrid-Classifier-Aggregation-Fusion (HCAF). In
the following we adopt a top-down approach to fur-
ther present our recognition system: first we report
the rule applied in the aggregation module and then
we describe the fusion strategy internal to each block.
Classifier Aggregation. The rule evaluates which
single module is most likely to be correct for any
given sample. Since each module has a binary output,
possible input combinations to the aggregation mod-
ule can be grouped into three categories: (i) those for
which only one module j classifies the sample in its
class C
j
, (ii) those for which more modules classify
the sample in its own class, (iii) those for which none
module classifies the sample in its class.
STAINING PATTERN CLASSIFICATION IN ANTINUCLEAR AUTOANTIBODIES TESTING
233

We introduce a strategy based on reliability esti-
mation that chooses an output, O(x), in any of the
possible combinations of modules’ output, referred
to as Reliability-based-Aggregation (RbA). The ratio-
nale lies in the observation that such an evaluation is
useful for solving complex pattern recognition tasks
(Cordella et al., 1999). Let us then denote ψ
j
(x) and
Y
j
(x) the reliability parameter and the output of the jth
module when it classifies the sample x, respectively.
Since in case (i) all the modules agree in their deci-
sion, as a final output is chosen the class of the mod-
ule whose output is 1. Conversely, in cases (ii) and
(iii) the final decision is performed looking at the re-
liability of each modules’ classifications.
More specifically, in case (ii), m modules vote for
their own class, with 2 < m ≤ L, whereas the oth-
ers (L − m) ones indicate that x does not belong to
their own class (i.e. their outputs are 1 and 0, re-
spectively). To solve the dichotomy between the m
conflicting modules we look at the reliability of their
classifications and choose the more reliable one. For-
mally:
O(x) = C
j
, where j = arg max
i:Y
i
(x)=1
(ψ
i
(x)) (3)
In case (iii), all modules classify x as belonging
to another class than the one they are specialized in
(i.e. their outputs are 0). In this case, the bigger is the
reliability parameter ψ
j
(x), the less is the probability
that x belongs to C
j
, and the bigger is the probability
that it belongs to the other classes. These observations
suggest selecting the following selection rule:
O(x) = C
j
, where j = arg min
i:Y
i
(x)=0
(ψ
i
(x)) (4)
In other words, we first find out which module has
the minimum reliability and then we choose the class
associated to it as a final output.
Classifier Fusion. Each specialised module of the
system is composed by an ensemble of classifiers
combined by the Rule (WV) (part B of figure 2). In
such a procedure, each expert gives its opinion, i.e. a
vote, about the class of the input pattern, which is then
weighted by a reliability parameter. If we denote as
ξ
k
(x) the value of reliability of kth classifier on sam-
ple x and V
i
k
(x) the vote for class C
i
of kth classifier on
sample x, the weighted sum of votes for class is given
by:
W
i
(x) =
∑
k
ξ
k
(x) ·V
i
k
(x) (5)
Therefore, the output of WV rule, Y (x), is the index
of class C
Y
(x) for which W
i
(x) is maximum:
Y (x) = argmax
i
(W
i
(x)) (6)
Note that to estimate ξ
k
(x), all classifiers have to work
at a measurement level, i.e. they attribute each class
a measurement value representing the degree that the
input sample belongs to that class.
4 RELIABILITY ESTIMATORS
The approach previously described requires the intro-
duction of parameters that estimate the classification
reliability of both individual expert and fusion of ex-
perts as well as the overall cells classifier, named as
ξ, ψ and φ, respectively. Note that all of them vary
in the interval [0, 1], and a value near 1 indicates a
very reliable classification. The first issue, i.e. the
definition of estimators that compute the reliability
of each classification act for measurement classifiers,
has been discussed in the literature (Cordella et al.,
1999; De Stefano et al., 2000). For their formal defi-
nition in case k-Nearest-Neighbour (kNN) and Multi-
Layer Perceptrons (MLPs), i.e. the single classifiers
used in the present work, see (Cordella et al., 1999).
Note that such formulas have proven usefulness also
in other application, e.g. in (De Stefano et al., 2000).
The reliability ψ of WV classification has been
computed according to a method similar to the one
reported in (Cordella et al., 2000), which is based on
the estimation of maximum reliability for the winning
class and for the others classes, respectively. Note that
ψ is calculated for each input samples and it is then
used in the aggregation module to determine the cell
final output O(x).
The reliability estimation for the classification of
each input cell performed by the overall MES is re-
quired to determine υ, i.e. the index of the well stain-
ing pattern class, as presented in section 2. In this
respect, the overall reliability φ considers not only the
reliability ψ of the selected module, but also the relia-
bilities of the other blocks (Soda and Iannello, 2007).
For all the three input combinations to the aggregation
module, i.e. (i), (ii) and (iii), such a choice accurately
estimate the classification reliability of each sample,
since it considers the agreement between all modules.
For the sake of brevity, we do not report the details
here. The interested reader may find them in (Soda
and Iannello, 2007).
5 DATA SET
To populate a referring data set, we use 37 images of
positive wells , grouped as follows: 24.3% are Ho-
mogeneous, 21.6% are Peripheral nuclear, 35.1% are
Speckled, 18.9% are Nucleolar.About 15 segmented
HEALTHINF 2008 - International Conference on Health Informatics
234

cells per well are chosen at random, located as re-
ported in (Soda and Iannello, 2006) and then cropped
to a rectangular region.
To develop the MES devised to recognize indi-
vidual cells, we need their labels that are determined
by two specialists at a workstation monitor. To this
aim, the classes introduced in section 1 do not cover
all the possibilities. Indeed, on the one hand those
classes represent a global pattern, i.e. the pattern of
whole well that is given by the global observation of
several cells. On the other hand, each cell could po-
tentially show a staining pattern that is different from
the well pattern. To overcome such limitations, for
manual labelling we adopt the following classes, as
reported elsewhere (Perner et al., 2002) (for defini-
tion of classes (i)–(iv) and (viii) see section 1): (i)
homogeneous (HO), (ii) peripheral nuclear or rim
(PN), (iii) speckled (SP) (iv) nucleolar (NU), (v) arte-
fact (AR), i.e. cell corrupted during the slide prepa-
ration process, identifiable with an irregular shape,
(vi) positive mitosis, i.e. the nonchromosome re-
gion of metaphase mitotic cells demonstrate staining,
(vii) negative mitosis, i.e. the nonchromosome region
of metaphase mitotic cells is negative, (viii) no pat-
tern (NP). Since the number of cells belonging from
groups (vi)–(viii) in not statistically meaningful, they
are not considered in the following.
The data set consists of 573 labelled cells, there-
fore subdivided: 23.9% HO, 21.8% PN, 37.0% SP,
8.2% NU and 9.1% AR.
To analyze the staining pattern we compute a set
of features related to texture components, adopting
both statistical and spectral features. The former mea-
sures are associated to properties of the first and the
second order histogram, respectively. The spectral
features are calculated by partitioning the spectrum
of the Fourier Transform into angular and radial bins.
Furthermore features related to Wavelet Transform
and Zernike Moments have been computed. Results
of discriminant analysis show that all the extracted
features have limited discriminant strength over five
classes (i.e. HO, PN, SP, NU and AR), but different
feature subsets discriminate better each class from the
others, enforcing the rationale of adopting the one-
per-class approach.
6 RECOGNITION RESULTS
With reference to the classification of individual cell,
the HCAF system is a MES constituted by five mod-
ules each one devised to recognized one of the five in-
put classes. i.e. HO, PN, SP, NU and AR. Each block
is composed by a fusion of individual classifiers, such
Table 1: Confusion matrix of HCAF classifier employing
the reliability-based selection (RbA) rule.
Input class
HO PN SP NU AR
HO 73.9% 5.6% 5.2% 8.5% 15.4%
PN 10.0% 71.2% 3.8% 14.9% 13.5%
Output SP 10.2% 12.8% 88.2% 0.0% 17.3%
class NU 1.5% 2.4% 0.5% 72.3% 9.6%
AR 4.4% 8.0% 2.4% 4.3% 44.2%
as kNN and MLP combined by the WV algorithm.
The HCAF system recognition performance has
been evaluated according to a eightfold cross valida-
tion approach. They are reported as confusion ma-
trix in table 1. The classification accuracy of HO, PN
and NU classes ranges from 71% to 74%, whereas the
best and worst recognition performance are attained
for cells of SP and AR classes, i.e. 88% and 44%,
respectively.
In our opinion, on the one hand, misclassifications
of HO, PN and SP samples are related to their simi-
larities of staining pattern and texture. Indeed, the
discrimination between such classes is a burdensome
issue also for well-trained specialists. On the other
hand, errors on NU and NP classes are related to the
small cardinality of such sets. Moreover, the variabil-
ity among AR samples is high, since such class con-
tains those cells corrupted during the slide preparation
that exhibit irregular shape and texture. Finally, tak-
ing notice of the absolute performance, the 75.9% of
cells are correctly classified.
In summary, we observe that the overall perfor-
mance of the presented cells classifier outperforms
that reported in (Soda, 2007). Furthermore, a di-
rect comparison of this results with respect to (Perner
et al., 2002) and (Sack et al., 2003) is not possible,
since their recognition task differs from ours. Indeed,
in those papers the authors used a different data set,
which is not only constituted by samples diluted at
1:160, but also containing cells that were negative,
i.e. they did not exhibit a detectable fluorescence in-
tensity.
With reference to the performance achieved in the
recognition of the whole well staining pattern, note
that we have to manage data related to individual cell
classification. The a priori knowledge based on estab-
lished medical information excludes the AR cell class
from the set of whole well pattern ones (see section
1). Therefore, υ, i.e. the index of well pattern class, is
computed from cell class indexes {HO, PN, SP, NU}.
For all the wells, we randomly subdivide their
cells into two equal partitions, and then each partition
is first used as a training set and then as test set. We
deem that such a ration is a good balance between the
need of keeping the training set representative as most
STAINING PATTERN CLASSIFICATION IN ANTINUCLEAR AUTOANTIBODIES TESTING
235

as possible and having enough test cells per well to
classify the staining pattern in accordance to the WS
criterion. In the two trials, the overall system mis-
classified only one out of the 37 wells, attaining an
hit rate equal to 97.3% and outperforming the results
reported in (Soda, 2007) (see section 1).
7 CONCLUSIONS
In this paper we have presented a system that supports
the staining pattern classification of IIF slides, whose
results show high accuracy. The approach, which pro-
vides a degree of redundancy that lowers the effect of
cell misclassifications, is based on the reliability es-
timation. The latter is unusual among the classifier
aggregation strategies.
We are currently engaged in populating a larger
database to consider not only the most relevant and
recurrent staining patterns, but also the minor ones.
Furthermore, we should apply boosting techniques to
improve binary recognition performance, especially
in the case of nuclear samples. The research goal is
a comprehensive CAD supporting all phases of IIF
diagnosis, i.e. both fluorescence intensity and staining
pattern classification.
ACKNOWLEDGEMENTS
The authors thank A. Afeltra and A. Rigon for their
collaboration in IIF images annotation. This work has
been funded by DAS s.r.l of Palombara Sabina (www.
dasitaly.com).
REFERENCES
Allwein, E. L., Schapire, R. E., and Singer, Y. (2001). Re-
ducing multiclass to binary: a unifying approach for
margin classifiers. J. Mach. Learn. Res., 1:113–141.
Bio-Rad Laboratories Inc. (2004). PhD System. USA.
Center for Disease Control (1996). Quality assurance for
the indirect immunofluorescence test for autoantibod-
ies to nuclear antigen (IF-ANA): approved guideline.
NCCLS I/LA2-A, 16(11).
Cordella, L., Foggia, P., Sansone, C., Tortorella, F., and
Vento, M. (1999). Reliability parameters to improve
combination strategies in multi-expert systems. Pat-
tern Analysis & Applications, 2(3):205–214.
Cordella, L., Foggia, P., Sansone, C., Tortorella, F., and
Vento, M. (2000). A cascaded multiple expert system
for verification. In 1st Int. Work. on Multiple Classifier
Systems, pages 330–339. Springer-Verlag.
Das s.r.l. (2004). Service Manual AP16 IF Plus. Italy.
De Stefano, C., Sansone, C., and Vento, M. (2000). To reject
or not to reject: that is the question: an answer in case
of neural classifiers. IEEE Transactions on Systems,
Man, and Cybernetics–Part C, 30(1):84–93.
Giacinto, G. and Roli, F. (2001). Dynamic classifier selec-
tion based on multiple classifier behaviour. Pattern
Recognition, 34(9):1879–1881.
Gunes, V., Menard, M., Loonis, P., and Petit-Renaud, S.
(2003). Combination, cooperation and selection of
classifiers: a state of the art. Int. Jour. of Pattern
Recognition and Artificial Intelligence, 17(8):1303–
1324.
Jelonek, J. and Stefanowski, J. (1998). Experiments on
solving multiclass learning problems by n
2
classi-
fier. In 10th Eur. Conf. on Mach. Learn., pages 172–
177. Springer-Verlag Lecture Notes in Artificial Intel-
ligence.
Kuncheva, L. (2002). Switching between selection and fu-
sion in combining classifiers: an experiment. IEEE
Transactions on Systems, Man and Cybernetics,
32(2):146–156.
Kuncheva, L., Bezdek, J., and R.P.W.Duin (2001). Decision
template for multiple classifier fusion: an experimen-
tal comparison. Pattern Recognition, 34:299–314.
Perner, P., Perner, H., and Muller, B. (2002). Mining knowl-
edge for HEp-2 cell image classification. Journal Ar-
tificial Intelligence in Medicine, 26:161–173.
Rigon, A., Soda, P., Zennaro, D., Iannello, G., and Afeltra,
A. (2007). Indirect immunofluorescence (IIF) in au-
toimmune diseases: Assessment of digital images for
diagnostic purpose. Cytometry - In press.
Sack, U., Knoechner, S., Warschkau, H., and et al.
(2003). Computer-assisted classification of HEp-2
immunofluorescence patterns in autoimmune diagnos-
tics. Autoimmunity Reviews, 2:298–304.
Soda, P. (2007). Early experiences in the staining pattern
classification of HEp-2 slides. In Computer Based
Medical Systems, pages 219–224. IEEE Computer So-
ciety.
Soda, P. and Iannello, G. (2006). A multi-expert system to
classify fluorescent intensity in antinuclear autoanti-
bodies testing. In Computer Based Medical Systems,
pages 219–224. IEEE Computer Society.
Soda, P. and Iannello, G. (2007). Reliability estimation in
the classifier aggregation framework. Technical re-
port, Universit
`
a Campus Bio-Medico di Roma.
Xu, L., Krzyzak, A., and Suen, C. (1992). Method of
combining multiple classifiers and their application to
handwritten numeral recognition. IEEE Transactions
on Systems, Man and Cybernetics, 22(3):418–435.
HEALTHINF 2008 - International Conference on Health Informatics
236
