
Support of Project Planning in Chemical Engineering via
Modeling and Simulation
Bernhard Kausch, Morten Grandt and Christopher M. Schlick
Chair and Institute of Industrial Engineering and Ergonomics
RWTH Aachen University, D 52062, Aachen, Germany
Abstract. The following approach shows a method that supports an experience
based generation of a project plan as well as the simulation supported examina-
tion and improvement of projects with flexible structure. Methods are briefly
introduced via an example from the chemical engineering industry. It can be
shown how various stochastically generated project constellations can be com-
pared using Petri net simulation. The example project is simulated with differ-
ent numbers of employees and different resource configurations. An analysis of
results shows the best combination of employees and resources that leads to a
decrease in project duration.
1 Introduction
Development projects are associated with great calculative risk since it is difficult to
predict the resources and personnel necessary for the course of a project. It would
therefore be beneficial for project planners to be able to estimate cost sources as early
as possible. This planning task is based primarily on existing know-how, i.e., experi-
ence during project management. Gröger’s [1] most recent data shows this is insuffi-
cient, and indicates that approximately only 13% of work in projects is actually valu-
able. Since even very small projects can quickly reach a high level of complexity, it is
impossible for even well versed project managers to prospectively view all identified
key factors and connect them to a collision-free workflow. Currently available tools
provide project managers with limited possibilities to regard all parameters in the
same way. Thus, to determine work capacity or productivity necessary for a project,
detailed experience about the project work must be acquired first through inclusion of
employees. To counter these problems the IAW, in collaboration with partners from
the Institute of Process Systems Engineering and the chemical engineering and soft-
ware industries, developed an analysis tool able to evaluate different workflow man-
agement alternatives that produce factor characteristics. The analysis includes model-
ing of development processes, transfer into a simulation model, and evaluation of
data gained through simulation campaigns.
Kausch B., Grandt M. and M. Schlick C. (2007).
Support of Project Planning in Chemical Engineering via Modeling and Simulation.
In Proceedings of the 5th International Workshop on Modelling, Simulation, Verification and Validation of Enterprise Information Systems, pages
157-162
DOI: 10.5220/0002418901570162
Copyright
c
SciTePress
2 Process-oriented Modeling and Simulation
Well-structured projects are easily presentable in an information technical manner
[2], which forms the system-based aspect of project planning tools. However, Wall-
meier [3] posits that only a portion of activities should be regarded as well-structured
routine tasks if these activities are seen as components of development projects [4]. A
further portion – the important stochastic factor necessary for the later simulation –
results only from intermediate results. Thus, planning tasks quickly become ex-
tremely complex and no longer manageable. As a result, and depending on applica-
tion background, different procedure models have been developed that allow for a
general structuring of the work processes. Possibilities for depicting temporal or tem-
porally abstract connections (SADT/IDEF [6]), attributes (DIN 66001 [7]) or their
quantifications (IUM [8]) are still missing. Killich [9] presents several additional
deficits of popular modeling methods. The C3 modeling method was developed for
the depiction of these important characteristics, and allows the mapping of complex
development processes by using 14 base elements, ten of which are shown below:
Validat e Batc h
Model 1
(Duratio n: 80,
Actor: HI )
Create Model
Revis ion 1
(Duratio n: 100,
Actor: HI )
Conduct Optimization
based on Re v 1
(Duratio n: 100,
Actor: HI )
Create Plant
Conce pt
prelimi nary p roduc t
(Duration: 150,
Actor: HI )
Approxim ate
sizing of alternati ves
(Duratio n: 600,
Actor: FH )
Approximate
siz ing of alternati ves
(Duratio n: 600,
Actor: HI )
A
s
p
e
n
A
s
p
e
n
B
-
J
a
c
Detaile d Informat ion
about the Mod el
Valid Informa-
tion about
Batc h Model
26
25
24
23
2827
87
93
Organizational
Unit 2
Organizational
Unit 1
t
1
t
0
t
0
<
t
1
t
3
t
1
<
t
2
t
2
t
2
<
t
3
Prozessoptimierung
auf Basis Rev. 1
durchf ühren
Batch Modell 1
validieren
Anlagenkonzept
Vorprodukte
Prozessoptimierung
auf Bas is Rev. 1
durchf ühren
Batch Modell 1
validieren
Anlagenkonzept
Vorprodukte
Prozessoptimierung
auf Bas is Rev. 1
durchf ühren
Batch Modell 1
validieren
Anlagenkonzept
Vorprodukte
Possibility 2
Further Possibilities
Possibility 1 Possibility 3
25
24
26
25
24
26
25
24 26
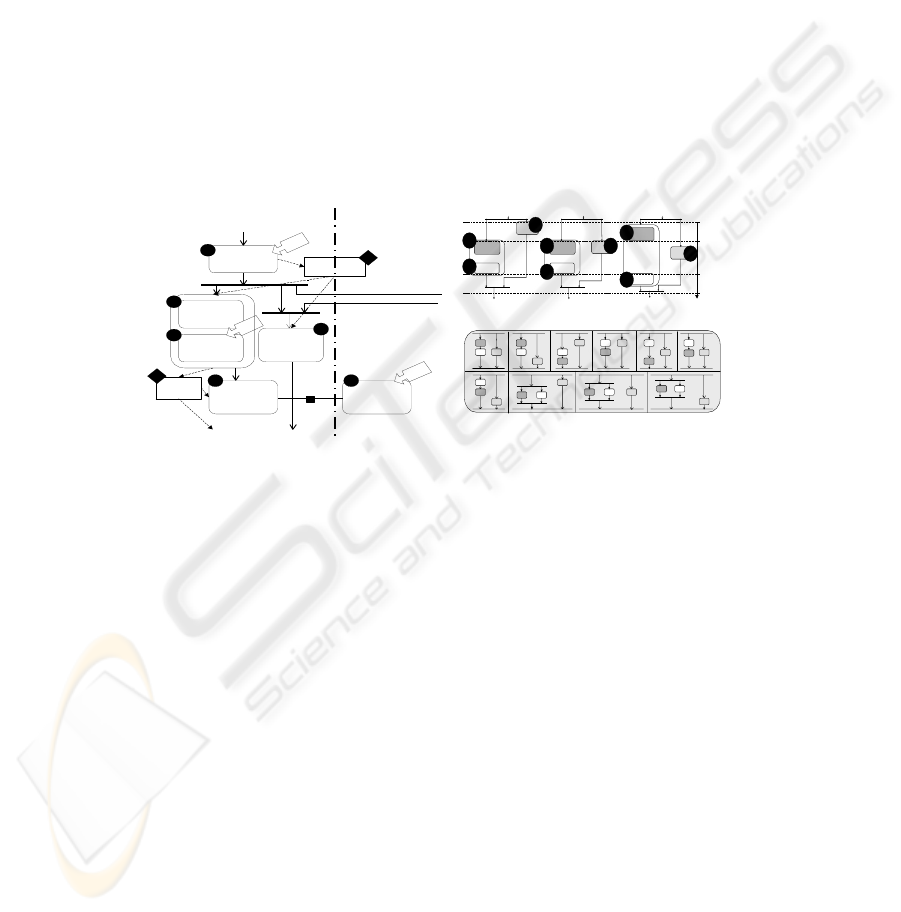
Fig. 1. Core elements of C3 and different stochastic decompositions of the blob.
The left side of Figure 1 shows an excerpt of a development process with two differ-
ent departments involved. First, activities 26, 24 and/or 25, as well as a further activ-
ity not shown here, on the right side follow activity 23. As example attributes of the
activities, the duration and required training of the participants were extended. In
activity 23, using the tool "Aspen", the detailed model information (87) was com-
piled, which is necessary for beginning activity 26 as well as the blob. The blob con-
tains activities 24 and 25, meaning these two activities can take place in arbitrary
order (see right side of Figure 1). By retaining this level of stochastic abstraction, the
simulation shows the effect of the different operational sequences on the total project.
The sequence of the activities in the blob that should be chosen depends on the num-
ber and qualification of the actors available, along with the availability of necessary
resources, such as Aspen. If activity 24 and 25 are completed, and if the information
about the batch model (element 93) necessary for the succeeding communication as
well as for further activities is compiled, synchronous communication of both organ-
izational units occurs (activities 27 and 28). Thus, at least two participants with re-
spective affiliation to the two organizational units involved for the same time are
needed for the communication task. If one of the two communication partners is not
available at the specific time, the work routine is suspended until suitable participants
158
can implement both activities. The tool “B-Jac” must also be available for activity 28.
Another input condition is represented by the synchronization node: activity 26 can
be started after the two predecessor activities, 23 and an additional activity not de-
picted on the right side, are completed along with input 87. The following section
deals with the simulation software architecture.
The connections described above were transformed into a Petri network simulation.
The resulting task net distinguishes between a) connections that represent the execu-
tion conditions, and thus the interaction of individual elements, and b) elements, e.g.,
persons, organizational units, activities, tools, or information. While the connections
(a) can be directly transferred into a Petri net, the behavior of individual elements (b)
was transferred into simulation by means of partial models. The simulation model
therefore consists of the task net itself, which–with regard to its structure–
corresponds to the C3 model, and of the partial models of the activities, persons, tools
and information. For the implementation, the Petri net simulator Renew [10] was
used.
Activity
24
Activity
23
Activity
25
Activity
26
Activity
28
Activity
27
Old Task 23 processed ?
Get new Task!
Necessary Tool and Information
avail able?
Trigger synchronizin g semaphore!
Activate new Task 24 (Attributes)
Activate new Task 25 (Attributes)
Infor-
mation
87
Infor-
mation
93
ID XY
Synchronizing
semaphore
Legend:
Activity
28
Old Task 23 proc essed?
Get new Task!
Necessary Tool and Inf ormat ion
available?
Trigger sy nchronizin g semaphor e!
Activate new Task 24 (Att ributes)
Activate new Task 25 (Attributes)
Infor-
mation
93
Activity
27
Partial net
“Tool”
linked
Partial Net
“Task” linked
Partial Net
“Person”
linked
Information
generation
Test if the conditions
for further activities
are completed
Fork / Splitting
node:
“Blob”
(Temporal
abstraction)
Synchronous
Communi-
cation
Synchronization
node:
Activity
24
Activity
25
Activity
28
Activity
27
Synchronizing
semaphore
Arc:
Test arc:
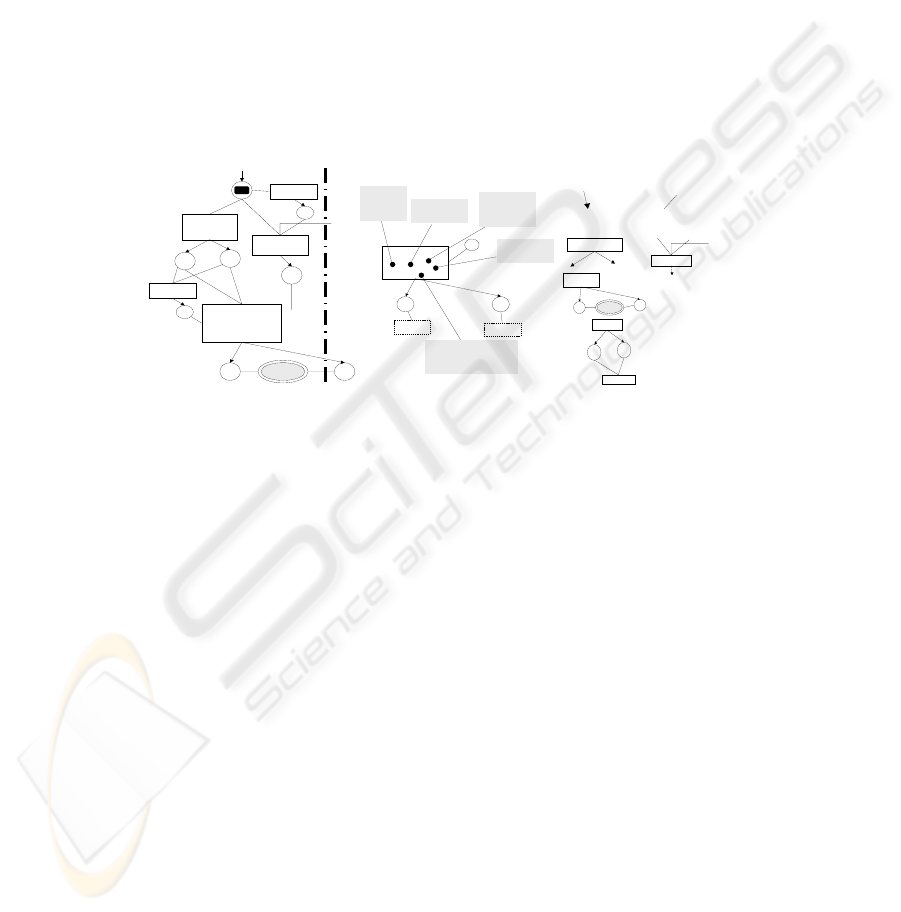
Fig. 2. Petri net model resulting from the C3 model in Fig. 1 and its substantial elements.
Figure 2 shows an excerpt of the whole task net with some substantial elements, such
as the use of resources and information, synchronous communication, the branching
out and the combination of the control flow. The basic Petri net functions were
adopted and subdivided according to the possibility of using subnets as tokens,
thereby keeping the partial nets of the activities, tools and information in the respec-
tive places. Thus, the dominant conditions can be reconstructed and analyzed at the
time of the execution of individual activities. Using the same structure, project spe-
cific partial nets differ only in the attributes used for parameterization of the individ-
ual elements; different partial nets can be reused in different project structures. The
partial net of the activity determines the boundary conditions necessary for the flexi-
ble execution of the individual activity. Another stochastic element, besides the de-
gree of freedom of the task sequences, is the actual duration used in the simulation
run, either subject to a normal distribution or to a beta distribution. This distribution
is integrated considering the fact that the actual duration of an activity must be ini-
tially estimated. Moreover, the qualification contains many further attributes. This
attribute determines to which organizational unit the implementing person should or
must belong to, which tools are suited for task execution and to which extent qualifi-
cation deviations are considered. The partial net of the tool provides the list of tools
generally available and reserves certain tools during their usage. Finally, the partial
net of the information contains only the different elements of information that are
159

generated in an activity and stored in a database, which are then made available for
subsequent activities.
The Petri net simulation now accomplishes the calculation of the total project dura-
tion, the level of parallelization (LP) and the grade of integration of the persons avail-
able (G
IP
). This is done by combining the stochastic elements, such as weakly struc-
tured task interdependencies and the dispersion of the duration of each task, with the
team constellation boundary condition and available tools.
3 Simulation
Prior to using the models to identify causes and effects [11], they must be checked to
see if they are valid representations of the systems to be studied. The C3 modeling
method has been used for the assessment and modeling of different development
processes in chemical engineering, performed in cooperation with experts and re-
searchers from this field. Additionally, VDI 3363 [12] suggests the comparison of
real data to simulation results. To show the results of one selected simulation model
later on, the Polyamide 6 process [13] was used as an example case of the research
project CRC476. The underlying process here, consisting of 79 activities executed
through coordination between eight organizational units, describes the different
phases of new development for the manufacturing of PA6. It contains five blobs and
13 synchronous communications with up to four participating organizational units.
The following section deals with the parameterization, the variables and hypotheses:
To determine the best constellation for the realization of this project, the numbers of
persons and tools were systematically varied. A minimum of nine different tools and
two different actors are necessary to conduct the project. This “basis” constellation is
then extended, first by additional actors [number of working persons (N
WP
)] able to
conduct each activity, and second, by a multiplication of tools [total number of tools
(TN
OT
)]. Additionally, the variance of task duration (V
TD
) was varied between 10%
and 30% with the Gaussian normal distribution (G) and with the right skewed beta
(β) distribution (α=6, β=3) (variation of the distribution: V
DT
). As a consequence of
this distribution, combined with the abstract elements in the process flow, several
thousand possible sequences arise. In total, 5222 runs with 155 selected different
constellations of independent variables were performed.
The most important dependent variables are total time of project duration (TT
PD
=
beginning of first task to end of last task) and total time of work (TTW), also seen as
total effort needed to execute project. Further dependencies are the level of paralleli-
zation (LP) and the grade of integration of the persons available (G
IP
). The average of
the personnel workload AG
IP
is the sum of G
IP
divided by the N
WP
and considered as
the average integration of working persons. The null hypotheses state that the total
time of project duration (TT
PD
) is independent of the number of working persons
(N
WP
) (H
01
) as well as of the total number of tools (TN
OT
) (H
02
) as of the variance of
task duration (V
TD
) (H
03
).
By analyzing these coherences, prognoses can be made about the cost of the develop-
ing process, realistic milestones, workload of actors and tools, time of the assignment
of actors and the application of tools and other resources.
160
4 Results
A detailed high dimensional five-way analysis of variance (ANOVA) enables analy-
sis of main and side effects. The first hint for an optimal project organization can be
gained by analyzing the effect of the variation of the most cost-intensive variable
N
WP
. At a 5% level of significance (α= .05), using a 95% confidence interval, highly
significant (p≤ .0001) differences between the groups of 2, 3, 4, 5 and 6 persons can
be discovered (see Fig. 5). Additionally, the percentage reduction of TT
PD
is given by
a sensitivity analysis. An increase above at least 6 persons does not significantly
affect the TT
PD
, though this is the one-dimensional view of the simulation result. The
other independent variables must also be taken into account.
240
220
Number of
working persons
180
B
a
s
i
s
=
9
T
o
o
l
s
+
P
o
l
y
m
e
r
P
l
u
s
+
A
h
e
a
d
+
M
o
r
e
x
+
A
h
e
a
d
+
E
x
c
e
l
+
F
B
W
+
g
P
r
o
m
s
+
M
o
d
K
i
t
+
D
a
t
a
b
a
s
e
s
+
K
o
m
P
a
k
t
3 Persons
4 Persons
5 Persons
6 Persons
8 Persons
7 Persons
200
Total Time of Project Duration
in [SU]
Total Number of Tools
Time in simulation units [SU]
Organizational Units
Activity
(Nr.)
Synchronous
Activities
Person Tas k IDWorkload Grafical
Acteur Nr.
Workload
Tasks
performed
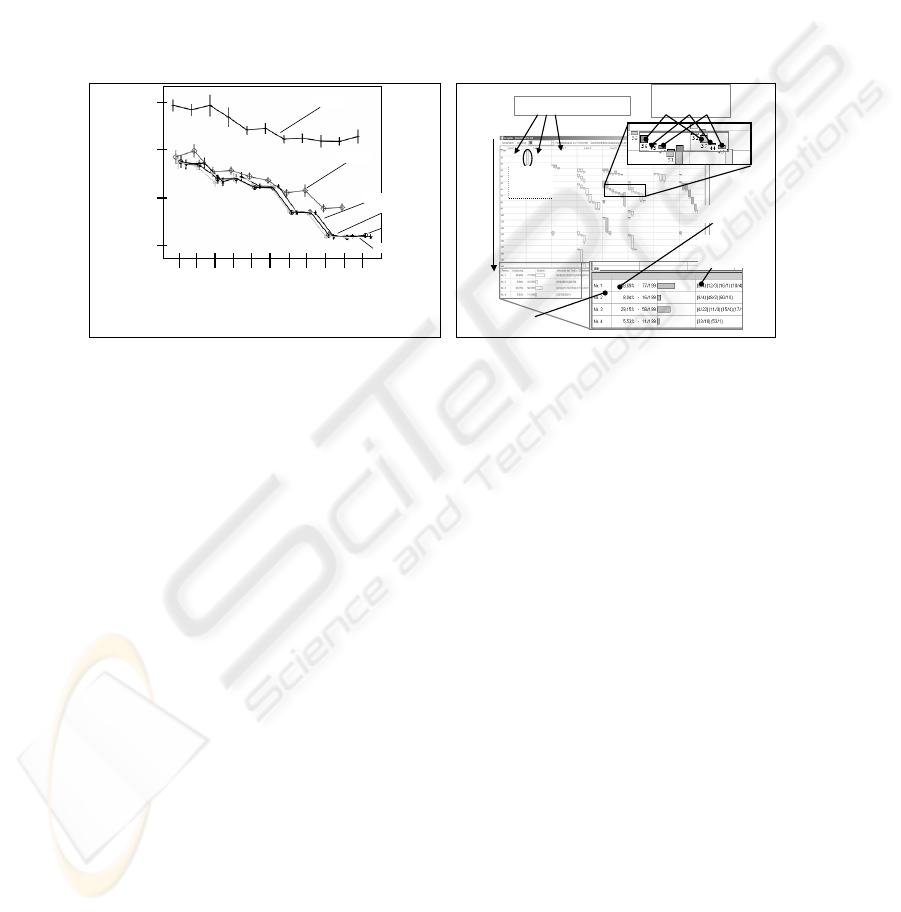
Fig. 5. Interdependencies between N
WP
, TN
OT
and TT
PD
and prototype of a user interface.
In summary, H
01
, H
02
and H
03
must be revoked. However, the ANOVA cannot ex-
plain which factor affects the dependent variable and to what extent a (estimated)
measure of effect strength
2
ˆ
ω
expresses the portion of total variance explained by a
single (statistically significant) effect [14]. The main effect strengths occur as fol-
lows: 69% of the variance of TT
PD
can be explained by variation of N
WP
, 15% by
variation of TN
OT.
The LP is explained by 57% with the N
WP
, 23% with TN
OT
. AG
IP
is highly affected by N
WP
: 99% of the effect detected on this variable can be ex-
plained by the variation of N
WP.
The sensitivity analysis is more detailed in terms of
optimizing the project progression, taking into consideration necessary personnel and
financial effort. As shown in Fig.2, six is the optimal number of persons involved in
the project. With increasing personnel assignment the total time of project duration
could be decreased by more than 36% or 89 [SU]. With 1[SU]
ˆ
=
0.5d the total project
duration could be reduced more than two months.
5 Conclusion and Outlook
A new simulation model based on the C3 modeling language was developed and
offers project planners a suitable technique for quantitative comparisons of several
alternative project structures. The influences of persons as well as tools were investi-
gated in the first simulation runs. These experiments produced satisfactory results, as
161

stated by experts of different leading chemical engineering companies. However, for
further validation additional an empirical survey and further extensions are planned in
close cooperation with enterprises. Furthermore, the correlations of individual factors
are empirically calculated through the modeling of several example processes to en-
sure a transfer of the realizations to planned work processes.
Acknowledgements
The research was funded by the German Research Foundation (DFG) according to
the Collaborative Research Center no. 476, Improve.
References
1. Gröger, M.: Wertschöpfungspotenzial Projektmanagement In:. REFA-Nachrichten 1/2006,
Pp. 4-7, 2006.
2. Horn, S.: Die schemabasierte Modellierung und Steuerung von Projektvorgängen, Institut
für Informatik, Universität Erlangen, Nürnberg, 2003.
3. Wallmeier, S.: Potenziale in der Produktentwicklung. Möglichkeiten und Grenzen von
Tätigkeitsanalyse und Reflexion, VDI-Verl., Düsseldorf, 2001.
4. Badke-Schaub, P. & Frankenberger, E.: Management kritischer Situationen. Produk-
tentwicklung erfolgreich gestalten. Berlin: Springer. 2004.
5. Vogel, G. H.: Process development: from the initial idea to the chemical production plant
Weinheim : Wiley-VCH, 2005.
6. Khneisseh, A; Schach, R.: Application of Coloured Petri-Nets for the Business Process
Modelling in Construction Companies, In: 22nd Conference on Information Technology in
Construction, Dresden July 19 - 21, conference transcript, p. 63 – 68, 2005.
7. Awiszus, B. Current approaches for an integrated product and process modeling. Proceed-
ings of PDT Europe 1999 Stavanger, QMS Sandhurst, UK, S. 353-360, 1999.
8. Keller, S.: Entwicklung einer Methode zur integrierten Modellierung von Strukturen und
Prozessen in Produktionsunternehmen. Fortschritt-Berichte VDI, Reihe 16, Technik und
Wirtschaft, Nr.117, VDI Verlag, Düsseldorf, 2000.
9. Killich, S.; Luczak, H.; Schlick, C.; Weissenbach, M.; Wiedenmaier, S.; Ziegler, J.: Task
modelling for cooperative work. In: Behaviour & Information Technology, Hampshire, 18
5, S. 325-338, 1999.
10. Kummer, O.; Wienberg, F.; Duvigneau, M.: Renew – The Reference Net Workshop. Avail-
able at: http://www.renew.de/, 2005. Release 2.02.
12. Daalen, C.E.V.; Thissen, W.A.H.; Verbraeck, A.: Methods for the modeling and analysis of
alternatives, in: W.B. Rouse (Ed.), Handbook of Systems Engineering and Management,
Wiley, New York, 1999, p. 1236.
13. VDI 3633:Simulation von Logistik-, Materialfluss- und Produktionssystemen. Hrsg.: VDI-
Gesellschaft Fördertechnik Materialfluss Logistik.Berlin: Beuth-Verlag, 2001.
14. Eggersmann, M.: Analysis and Support of Work Processes Within Chemical Engineering
Design Processes, Published in: Fortschritt-Berichte VDI, Nr. 840, Düsseldorf, 2004.
15. Hays, W.L.: Statistics for the social sciences. New York: Holt Rinehart, and Winston,
1973.
162
