
FROM DATABASE TO DATAWAREHOUSE
A Design Quality Evaluation
Maurizio Pighin and Lucio Ieronutti
IS&SE-Lab, Dept. of Math and Computer Science, University of Udine
Via delle Scienze 206, 33100, Udine, Italy
Keywords: Datawarehouse, design quality, data quality.
Abstract: Data warehousing provides tools and techniques for collecting, integrating and storing a large number of
transactional data extracted from operational databases, with the aim of deriving accurate management
information that can be effectively used for supporting decision processes. However, the choice of which
attributes have to be considered as dimensions and which as measures heavily influences the effectiveness
of a data warehouse. Since this is not a trivial task, especially for databases characterized by a large number
of tables and attributes, an expert is often required for correctly selecting the most suitable attributes and
assigning them the correct roles. In this paper, we propose a methodology based on the analysis of statistical
and syntactical aspects that can be effectively used (i) during the data warehouse design process for
supporting the selection of database tables and attributes, and (ii) then for evaluating the quality of data
warehouse design choices. We also present the results of an experiment demonstrating the effectiveness of
our methodology.
1 INTRODUCTION
There are different factors influencing the
datawarehouses (hereinafter, DWs) effectiveness
and the quality of related decisions. For example,
while the selection of good quality operational data
enables to better target the decision process in the
presence of alternative choices (Chengalur-Smith et
al., 1999), poor quality data causes information
scrap and rework that wastes people, money,
materials and facilities resources (Wang and Strong,
1996a) (Wang and Strong, 1996b) (Ballau et al.,
1998) (English, 1999). Indeed, the quality of original
data inevitably limits the quality of the decisions
taken analysing the data. As a result, the
effectiveness of a DW is strongly constrained by the
quality of data selected for the analysis. Then, it is
fundamental to select appropriate measures and
dimensions during the DW design process.
We have recently started at facing the problem of
data quality in DWs (Pighin and Ieronutti, 2006);
while most approaches proposed for assessing data
quality are related with the semantics of data, our
goal is to propose a context independent
methodology focused on statistical and syntactical
aspects rather than centred on semantic ones. This
choice is primarily motivated by the following
considerations: in a real world scenario software
engineers typically need a support for selecting the
DW measures and dimensions since they could have
a partial vision of a specific operational database
(hereinafter, DB) and related semantics.
Additionally, software engineers generally do not
have a deep knowledge of the actual usage of the
information system. Indeed, different organizations
can use the same system, but each DB instantiation
stores data that are different from the point of view
of distribution, correctness and reliability. As a
result, the same DW design choices can produce
different informative effects depending on the data
actually stored into the DB. Another important
aspect to be considered for evaluating the quality of
DW design choices concerns information that can be
derived from the initial DB schema. For example, by
taking into account the data type of selected
measures or considering if the selected dimensions
belong or not to primary keys, it can provide
information on the suitability of taken design
choices.
This paper is structured as follows. In Section 2
we survey related work. In Section 3 we present the
set of indexes we propose for measuring different
aspects of data. In Section 4 we describe how these
indexes are combined for obtaining information on
178
Pighin M. and Ieronutti L. (2007).
FROM DATABASE TO DATAWAREHOUSE - A Design Quality Evaluation.
In Proceedings of the Ninth International Conference on Enterprise Information Systems - DISI, pages 178-185
DOI: 10.5220/0002344601780185
Copyright
c
SciTePress

the DW design quality. Section 5 presents an
experimental evaluation demonstrating the
effectiveness of proposed indexes in supporting the
DW design process. Finally, Section 6 concludes the
paper by discussing ongoing and future work.
2 RELATED WORK
In the literature, different researchers have been
focused on data quality in operational systems and a
number of different definitions and methodologies
have been proposed, each one characterized by
different quality metrics. Although Wang (1996a)
and Redman (1996) proposed a wide number of
metrics that have become the reference models for
data quality in operational systems, in the literature
most works refers only to a limited subset of metrics
(e.g., accuracy, completeness, consistency and
timeliness).
Literature reviews e.g., (Wang et al., 1995)
highlighted that there is not a general agreement on
data quality metrics; for example, timeliness has
been defined by some researchers in terms of
whether the data are out of date (Ballou and Pazer,
1985), while other researchers use the same term for
identifying the availability of output on time
(Kriebel, 1978) (Scannapieco et al., 2004) (Karr et
al., 2006). Moreover, some of the proposed metrics,
called subjective metrics (Wang and Strong, 1996a)
e.g., interpretability and easy of understanding,
require a final user evaluation made by
questionnaires and/or interviews and then result
more suitable for qualitative evaluations rather than
quantitative ones.
Different researchers have been focused on
proposing automatic methods for conceptual schema
development and evaluation. Moreover, some of the
proposed approaches e.g., (Phipps and Davis, 2002)
include the possibility of using the user input to
refine the obtained result.
An alternative category of approaches employs
statistical techniques for assessing data quality. For
example, the analysis of data distributions can
provide useful information on data quality. In this
context, an interesting work has been presented in
(Karr et al., 2006), where a statistical approach has
been experimented on two real DBs.
A different category of techniques for assessing
data quality concerns Cooperative Information
Systems (CISs). In this context, the DaQuinCIS
(Scannapieco et al., 2004) project proposed a
methodology for quality measurement and
improvement for CISs. The proposed methodology
is primarily based on the premise that CISs are
characterized by high data replication, i.e. different
copies of the same data are stored by different
organizations. From data quality perspective, this
feature offers the opportunity of evaluating and
improving data quality on the basis of comparisons
among different copies.
With respect to above solutions, we aim at
proposing a semantics independent methodology
measuring objective features of data to derive
information useful both for supporting the selection
of DW measures and dimensions, and evaluating the
final quality of taken DW design choices. For such
purpose, we have defined a set of metrics measuring
different statistical and syntactical characteristics of
data. It important to highlight that our goal is not to
propose an alternative technique for the DW design
process, but present a methodology that, coupled
with other types of solutions e.g., (Golfarelli et al.,
1998), is able to effectively drive the DW design
choices. For example, it can be used for guiding the
attribute selection in the case of alternative choices
(i.e., redundant information).
3 PROPOSED INDEXES
Considering the whole set of definitions and metrics
that have been proposed in the literature for
assessing data quality of an operational DB, we
identified relevance and value added proposed by
Wang (1996a) as the most appropriate concepts for
our analysis. Indeed, we are interested in identifying
the set of attributes of a given DB storing relevant
information and that could add value in decision
processes. For example, an attribute characterized by
null values does not provide value added from the
data analysis point of view. In this case, the attribute
does not enhance the informative content of the DW
and the quality of derived decisions.
Although the selection of DB tables and
attributes is primarily guided by semantic
considerations, the designer can greatly benefit by
the availability of syntactical and statistical
information. For example, in the presence of
alternative choices, the designer can select the
attribute characterized by the most desirable
features. On the other hand, the designer can decide
to change his design choice if he discovers that the
selected attribute is characterized by undesirable
features.
For evaluation purposes, we identified a set of
indexes referring to the following types of DB
elements:
FROM DATABASE TO DATAWAREHOUSE: A Design Quality Evaluation
179

• Tables of a DB. At a general level, we define a
set of metrics highlighting which tables of a
given DB contain more/less relevant data.
• Attributes of a table. At a level of single table,
we define a set of metrics that help users in
identifying which attributes of the considered
table are more relevant from data analysis point
of view.
All indexes we propose are normalized into the
interval [0, 1], where 0 indicates that the set of data
belonging to the considered element (attribute or
table) does not provide value added, while 1
indicates that it can play an important role in
supporting decision processes.
3.1 Indexes for Tables
In this Section, we describe the set of metrics M
e=1..k
and corresponding indexes we propose for DB
tables. With these metrics, we aim at taking into
account that different tables could play different
roles and then result more/less suitable for extracting
measures and dimensions.
Given the table t
j
, the global indicators S
m,j
and
S
d,j
evaluating how much t
j
is suitable to extract
respectively measures and dimensions are derived
by differently combining the indexes derived from
the metrics M
e=1..k
. These indicators are used: (i) to
support the selection of the tables to be considered
for the DW construction, (ii) to differently weight
the indexes computed on the attributes belonging to
different tables. In particular, the two indexes S
m,j
and S
d,j
are derived as follows:
k
)t(M*C
S
je
k
1e
e,p
j,p
∑
=
=
where:
• p = d or m (d = dimension, m = measure);
• e = 1, ..., k identifies the metric;
• j identifies the table;
• C
p,e
corresponds to the table metric coefficient.
In the following, we first introduce a set of
elementary functions, and then describe proposed
metrics M
e=1..k
.
• cAttr(t
j
). It counts the number of attributes in the
table t
j
.
• cRec(t
j
). It counts the number of records
actually stored into the table t
j
.
3.1.1 Percentage of Records
The index computed by this metric indicates the
percentage of records stored into a table with respect
to the total number of DB records (or in the
considered subset).
It is important to note that into the original DB,
different tables can store data referring to different
time intervals (typically the most recent
transactional data). For example, into a real DB
often old transactional data are either deleted or
moved into secondary tables. Then, a temporal
normalization is required to correctly compare the
number of records stored into different tables.
For such normalization, the metric requires the
list of temporal attributes that are correlated to
transactional activities. If a table does not store
transactional data (e.g., stores information on
customers and suppliers), it does not contain any of
these attributes; for such tables, the normalization is
not needed. The identification of the above attributes
is a semantics dependent task and currently in our
methodology it is not an automatic procedure. For
computing proper indexes, the metric then needs the
list of such temporal attributes. More specifically, let
t
j=1..q
be the set of tables of a given DB, we identify
with opAttr
j=1..q
the temporal attributes correlated to
transactional activities; if the table t
j
does not store
transactional data, then opAttr
j
= null.
The evaluation procedure works as follows.
First, for each table t
j
, the metric computes days
j
corresponding to the temporal interval (e.g., number
of days) of data if opAttr
j
is not null, otherwise days
j
equals 0. Second, for each table t
j
of the DB, the
metrics computes f(t
j
) as follows:
⎪
⎪
⎩
⎪
⎪
⎨
⎧
≠
=
=
otherwise
null if
)c(tRec
opAttr
days
)daysmax(
*)t(cRec
)t(f
j
j
j
q..1j
j
j
Finally, the index for the table t
j
is derived by
normalizing f(t
j
) as follows:
∑
=
=
q
1j
j
j
j1
)t(f
)t(f
)t(M
If the analysis concerns the identification of the
tables that are more suitable to extract measures, the
corresponding coefficient is positive (C
m,1
> 0) since
tables storing transactional information are generally
characterized by an high number of records. On the
other hand, the coefficient for dimensions is
negative (C
d,1
< 0) since, for example, tables storing
information on products and clients are typically
characterized by a lower number of records than
transactional archives.
ICEIS 2007 - International Conference on Enterprise Information Systems
180

3.1.2 Percentage of Attributes
The index computed by this metric indicates the
percentage of attributes belonging to the considered
table with respect to the total number of DB
attributes. The index for this metric is computed as
follows:
∑
=
=
q
1j
j
j
j2
)t(cAttr
)t(cAttr
)t(M
The coefficient for this metric is positive for
measures (C
m,2
> 0) since, for example, tables
storing information on business objects are typically
characterized by an high number of attributes. A
negative coefficient is used in the case of
dimensions (C
d,2
< 0) because transactional tables
generally have a lower number of attributes.
3.2 Indexes for Attributes
In our analysis, we consider two categories of
attributes: numerical (i.e., short, integer, float and
double) and alphanumerical (i.e., character and
string) attributes. For each attribute belonging to
these categories, we define a set of metrics m
h=1..r
measuring different features of data.
The indicators s
d,i
and s
m,i
evaluating how much
an attribute a
i
is suitable to be used respectively as
dimension and measure are derived as follows:
r
)a(m*c
s
ih
r
1h
h,p
i,p
∑
=
=
where:
• p = d or m (d = dimension, m = measure);
• h = 1, ..., r identifies the metric;
• i identifies the attribute;
• c
p,h
corresponds to the attribute metric
coefficient.
In the following, we first introduce a set of
elementary functions, and then describe proposed
metrics and corresponding coefficients.
• cNull(a
i
) counts the number of null values of the
attribute a
i
.
• cValue(a
i
, v) counts the number of occurrences
of the value v into the attribute a
i
.
• cValues(a
i
). Applicable to alphanumerical
attributes, it counts the number of different
strings into the attribute a
i
.
• inst(a
i
). Applicable to alphanumerical attributes,
this function returns an array of cValues(a
i
)
integer values, where each value corresponds to
the number of instances of a particular string or
character belonging to the domain.
• inst(a
i
, nIntervals). Applicable to numerical
attributes, this function returns an array of
nIntervals integer values. In particular, this
function first subdivides the domain into
nIntervals intervals and then, for each interval, it
counts the number of values falling into the
corresponding range of values.
• Pkey(t
j
) identifies the set of attributes belonging
to the primary key of the table t
j
.
• cPkey(t
j
) counts the number of attributes
constituting the primary key of the table t
j
.
• cPkey(t
j
, a
i
) returns 1/ cPkey(t
j
) if the attribute a
i
belongs to cPkey(t
j
), 0 otherwise.
• Dkey(t
j
) identifies the set of duplicable keys of
the table t
j
.
• cDkey(t
i
) counts the total number of attributes
belonging to duplicable keys of the table t
j
.
• cDkey(t
j
, a
i
) counts the total number of instances
of the attribute a
i
in Dkey(t
j
) (the same attribute
can belong to more than one duplicable key).
3.2.1 Percentage of Null Values
Given the attribute a
i
belonging to the table t
j
, this
metric measures the percentage of data having null
values as follows:
ji
j
i
i1
ta
)t(cRec
)a(cNull
)a(m ∈=
Although simple, this metric provides a
fundamental indicator concerning the relevance of
an attribute; for example, attributes characterized by
an high percentage of null values can be considered
scarcely effective for supporting decision processes
(independently from their role). For this reason, both
coefficients assume negative values (c
m,1
and c
d,1
<
0), highlighting that the presence of an high number
of null values is an undesirable feature from both
dimensions and measures point of view. Indeed,
attributes having a high percentage of null values are
characterized by a poor informative content.
3.2.2 Degree of Clusterization
This metric measures the extent in which the
attribute assumes different values on the domain.
Depending on the type of the attribute, we adopt two
different procedures.
In the case of alphanumerical attributes, the
degree of clusterization is computed as follows:
ji
j
i
i2
ta
)c(tRec
)a(cValues
1)a(m ∈−=
FROM DATABASE TO DATAWAREHOUSE: A Design Quality Evaluation
181

For example, if the attribute assumes a small
number of different values (e.g., in the case of units
of measurement where only a limited number of
different values are admitted), this metric derives a
value that is close to 1. On the other extreme, if the
considered attribute is the primary key of the table,
the degree of clusterization equals 0 since the
number of different strings equals the total number
of records stored into the table.
A different procedure is used in the case of
numerical attributes. For such attributes, the degree
of clusterization is computed as follows:
nIntervals
)0,)nIntervals,a(inst(cValue
)a(m
i
i2
=
where the parameter nIntervals can be arbitrarily
chosen by the analyst (e.g., in our experiment
nIntervals = 1000).
More precisely, the procedure is composed by
the following steps: (i) the domain of numerical
values is discretized into nIntervals intervals, (ii) the
number of values falling into different ranges is
derived, and (iii) the percentage of empty intervals is
then computed. For example, if the attribute values
are uniformly distributed throughout the domain, the
computed index is close to 0 since for each
subinterval there is at least one value falling in it.
If the analysis concerns the evaluation of how
much an attribute is suitable to be used as
dimension, the corresponding coefficient is positive
(c
d,2
> 0), highlighting that attributes assuming a
limited number of values can be effectively used for
exploring the data. For example, an attribute storing
information on the payment type (e.g., cash money
or credit card) belongs to this category and it is
suitable to be used as dimension. On the other hand,
the coefficient for measures is negative (c
m,2
< 0),
since typically attributes characterized by an high
degree of clusterization are not suitable to be used as
measures, since they do not contain discriminatory
and predictive information. For example, an attribute
storing transactional data (then, suitable to be used
as measure) is generally characterized by an high
number of different values (e.g., purchase money or
the number of elements sold).
3.2.3 Dispersion of Values
This metric provides information on how much data
of an attribute tends to spread over the domain.
Depending on the data type of the attribute, we
adopt two different procedures.
In the case of a numerical attribute, the
dispersion of values is computed as follows:
)]}a(mean)a[max()],amin()a(meanmax{[
)a(stdDev
)a(m
iiii
i
i3
−−
=
where stdDev corresponds to the traditional standard
deviation function and max(a, b) returns the
maximum value between the two values a and b.
In the case of alphanumerical attributes, the
dispersion of values is computed as follows. First of
all, a vector v of integer values is created for
normalization purposes; each vector element
corresponds to an attribute value and represents the
number of instances of that value. Since the vector v
represents the extreme situation, its first value equals
jiij
ta)1)a(cValues()t(cRec]1[v
∈
−
−
=
while the other values equal 1. The dispersion of
values is then computed as follows:
)(
))((
1)(
3
vstdDev
ainststdDev
am
i
i
−=
For example, when strings are equally
distributed throughout the domain, the dispersion of
values equals 1. On the other extreme, if most data
assume the same value, the index is closer to 0.
If the analysis concerns the evaluation of how
much an attribute is suitable to be used as a measure,
the coefficient is negative (c
m,3
< 0), since attributes
suitable to be used as measures are generally not
characterized by an uniform distribution but by other
types of distribution (e.g., normal distribution). On
the other hand, if the analysis concerns dimensions,
the coefficient is positive (c
d,3
> 0), since the more
values are uniformly distributed on the domain, the
more effectively the analyst can explore the data.
3.2.4 Type of Attribute
This metric returns a value according to the data
type of the attribute. More specifically, the index is
derived as follows:
⎪
⎩
⎪
⎨
⎧
=
Doubleor Float is if1
Integeror Short is if50
String is if0
)(
4
i
i
i
i
a
a.
a
am
Typically numerical attributes are more suitable
to be used as measures rather than being used as
dimensions; for this reason, the coefficient for
measures is positive (c
m,4
> 0). On the other hand, in
the case of dimensions, the coefficient is negative
(c
d,4
< 0) since business objects definitions are
generally coded by alphanumerical attributes.
Moreover, alphanumerical attributes are rarely used
as measures due to the limited number of applicable
mathematical functions (e.g., count function).
3.2.5 Keys
This metric derives a value both taking into account
if the considered attribute belong or not to primary
and/or duplicable keys, and considering the total
number of attributes constituting the keys.
ICEIS 2007 - International Conference on Enterprise Information Systems
182
The primary key of a given table t
j
can either
correspond to a single attribute (cPkey(t
j
) = 1) or
composed by a set of attributes (cPkey(t
j
) > 1). On
the other hand, in a given table t
j
more than one
duplicable key can exist, each one (possibly)
characterized by a different number of attributes. It
is also important to note that an attribute can belong
to more than one duplicable key (cDkey(t
j
, a
i
) > 1).
For the computation, we introduce the additional
parameter w
∈ [0, 1] for differently weighting
attributes belonging to primary and secondary keys
(in our experiments, w = 0.5).
Given the attribute a
i
belonging to the table t
j
,
the index is computed as follows:
⎪
⎪
⎪
⎩
⎪
⎪
⎪
⎨
⎧
+
⎟
⎟
⎠
⎞
⎜
⎜
⎝
⎛
+
=
=
otherwise
0 if
)w1(
w*
)t(cDkey
)a,t(cDkey
)a,t(cPkey
)t(cDkey)a,t(cPkey
)a(m
j
ij
ij
jij
i5
If a
i
is the primary key of the table t
j
and the
table does not contain duplicable keys, the
corresponding index equals 1, while the indexes for
the other attributes equal 0.
The coefficient for dimensions is positive (c
d,5
>
0) since attributes belonging to primary or secondary
keys often identify lookup tables and then they are
the best candidates for DW dimensions. On the other
hand, the coefficient for measures is negative (c
m,5
<
0) since attributes belonging to primary and/or
duplicable keys typically are not used as measures.
4 DW METRIC
Our methodology characterizes each attribute with a
couple of global indexes G
m,i,j
and G
d,i,j
indicating
how much the attribute a
i
belonging to the table t
j
is
suitable to be used respectively as measure and as
dimension. These indexes are computed as follows:
jii,pj,pj,i,p
tas*SG ∈=
where:
•
p = d or m (d = dimension, m = measure);
•
i identifies the attribute;
•
j identifies the table;
•
S
p,j
corresponds to the table index;
•
s
p,i
corresponds to the attribute index.
Once all these indexes are computed, our
methodology derives two lists of attributes: the first
one contains all the DB attributes ordered according
to G
d
, while the second one ordered according to G
m
.
We define with rank
d
(a
i
) and rank
m
(a
i
) the functions
deriving the position of a
i
respectively into the first
and second attributes list. We use these ranking
functions to evaluate the effectiveness of our
methodology in correctly identifying the set of
attributes that are more suitable for the DW design
(see Section 5).
The global index I(DW) measuring the final DW
design quality is derived by using the above indexes.
More specifically, let A
d
be the set of n
d
attributes
chosen as dimensions and A
m
the set of n
m
attributes
to be used as measures, the index measuring the total
DW quality is computed as follows:
md
ta
Aa
j,i,d
ta
Aa
j,i,m
nn
GG
)DW(I
ji
di
ji
mi
+
+
=
∑
∑
∈
∈
∈
∈
The following tables summarize the coefficients
we used for the experiment described in Section 5
(Table 1 refers to coefficients for table metrics,
while Table 2 concerns attributes).
Table 1: List of coefficients for table metrics.
C
d
C
m
M
1
- Percentage of records
-1 1
M
2
- Percentage if attributes
-1 1
Table 2: List of coefficients for attribute metrics.
c
d
c
m
m
1
- Percentage of null values
-1 -1
m
2
- Degree of clusterization
1 -1
m
3
- Dispersion of values
1 -1
m
4
- Type of attribute
-1 1
m
5
- Key
1 -1
Although coefficients can take arbitrary values,
in this phase of our research we assign unitary
values (i.e., -1 or +1). However, we intend to
investigate if an accurate tuning of the coefficients
may lead to more effective results. Table 2
summarizes the set of coefficients employed in our
experiments.
5 EXPERIMENTAL
EVALUATION
We experimented our methodology on a subset of an
enterprise commercial DB of a real world business
system. The considered data consists of 22 tables,
528 attributes and millions of records. For the
experimental evaluation, we asked an expert to build
a DW selecting the attributes that are the most
suitable to support decision processes. Then, we
tested our metrics evaluating the measured quality of
selected attributes.
In the first phase of the evaluation, we have
considered the metrics we propose for the DB tables.
Table 3 summarizes the indexes derived by the
metrics S
m
and S
d
.
FROM DATABASE TO DATAWAREHOUSE: A Design Quality Evaluation
183
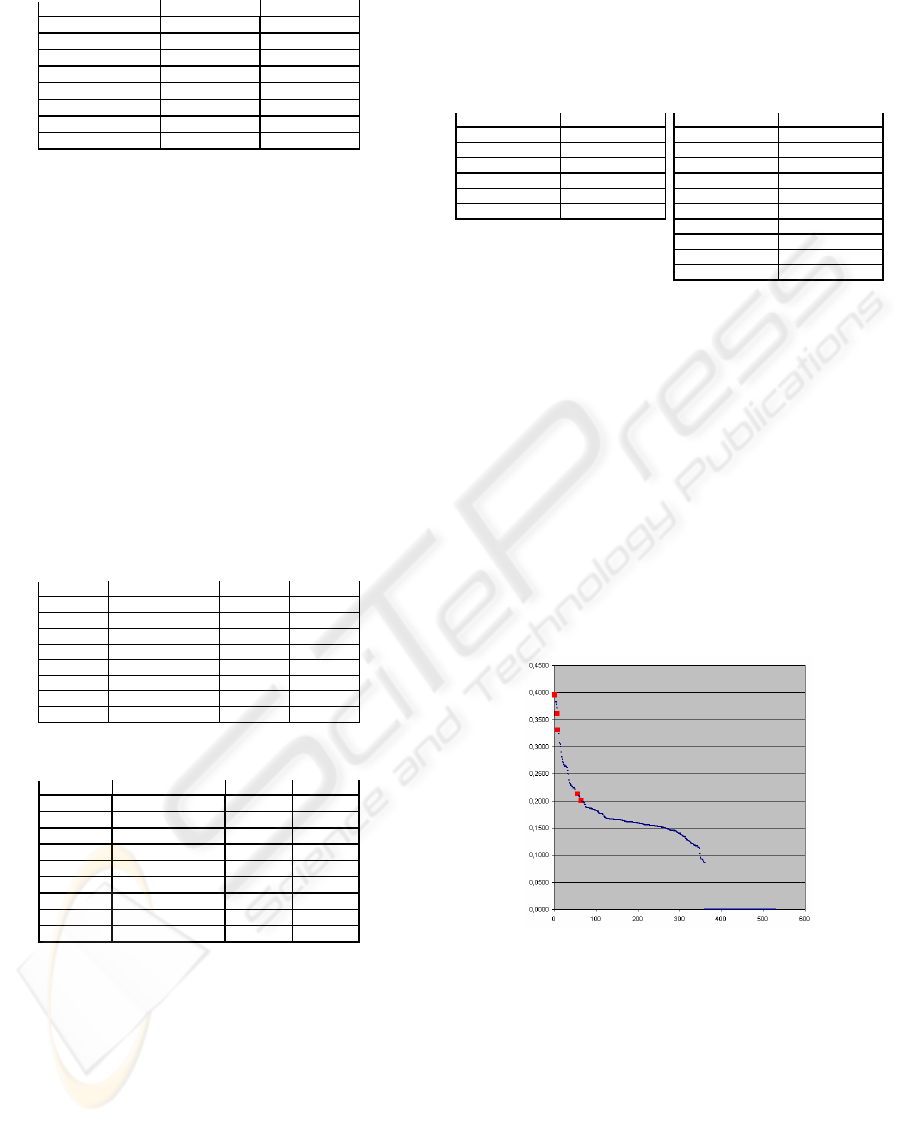
Table 3: List of tables ranked according to S
m
.
Table S
d
S
m
xsr 0,5554 0,4446
intf 0,6884 0,3116
…
art 0,7322 0,2678
dii 0,7418 0,2582
…
smag 0,7491 0,2509
tbd 0,7494 0,2506
Derived quality measurements for the DB tables
are consistent with our expectations; for example,
the procedure correctly highlights that the table
xsr is
very suitable for extracting measures. Indeed, this
table stores selling information and its transactional
aspects are detected by our metrics. On the other
hand, the procedure highlights that while
smag can
not be effectively used to extract measures, it is
suitable to extract dimensions. Indeed, this table
stores information on products categories.
In the second phase of the experiment, we have
considered the metrics we propose for DB attributes.
Using the indexes computed in the previous phase,
for each attribute we derived the global indexes G
m
and G
d
, summarized respectively in Table 4 and 5
(the last column indicates the attribute rank).
Table 4: Attributes ranked according to G
d
.
Table Attribute G
d
rank
d
Liof
lio_sigla_art
0,5934 1
Art
a_tipolog_art
0,5538 2
…
…
… …
Xsr
xr_valore
0,1660 348
Xsr
xr_qta
0,1644 349
…
…
… …
Xsr
xr_magg_ex_mag
0,0000 527
Xsr
xr_sconto_ex_vsc
0,0000 528
Table 5: List of attributes ranked according to G
m
.
Table Attribute G
m
rank
m
xsr
xr_qta 0,3958 1
xsr
xr_valore 0,3945 2
…
… … …
art
a_tipolog_art 0,1182 336
…
… … …
liof
lio_sigla_art 0,1029 347
…
… … …
xsr
xr_magg_ex_mag 0,0000 527
xsr
xr_sconto_ex_vsc 0,0000 528
It is interesting to note that in both lists
xr_magg_ex_mag and xr_sconto_ex_vsc occupy the last
two positions. This is due to the fact that these
attributes are characterized by an high percentage of
null values and then result unsuitable to be used both
as dimensions and measures. On the other hand,
while
lio_sigla_art and a_tipolog_art result the most
appropriate attributes to be used as dimensions, they
are unsuitable to be used as measures. This result is
in line with our expectations, since the first attribute
stores information on products codes and the second
one on products categories. On the other hand, the
attribute
xr_valore is suitable to be used as measure
and unsuitable as dimension. Also in this case, this
result is consistent with the semantics of data, since
the attribute stores pricing information.
Table 6: Ranking of measures (a) and dimensions (b).
Attribute Rank
m
Attribute Rank
d
xr_qta
1
tb_codice
3
xr_valore
2
ps_sigla_paese
5
xr_prov_age
7
t_cod_tipo
6
xr_val_sco
9
ag_cod_agente
8
a_ult_prz_pag
56
a_sigla_art
9
a_prz_pag_stand
64
sc_cod_s_conto
25
a_cl_inv
84
xi_prov
220
cf_gruppo_merc
221
cf_zona
224
a) b)
In the final phase of our experiment, we have
considered the DW built by the expert and evaluated
the rank of selected dimensions and measures. Table
6(a) illustrates DW measures and corresponding
ranks. In particular, with respect to the measures
choice, four out of six attributes rank within the first
ten positions (<2% of the whole set of attributes),
while the remaining two rank under the 70
th
position
(<13%). This is a valuable result considering that the
total number of attributes is 528.
Figure 1 allows one to better evaluate the quality
of the measures choice; in particular, the figure
represents the whole set of DB attributes ranked
according to the G
m
and highlights the selected
measures.
Figure 1: Derived quality for measures.
In Table 6(b), we report the DW dimensions and
related ranks. With respect to the dimensions choice,
five out of ten attributes rank within the first ten
positions (<2% of the whole set of attributes), two
out of ten under the 90
th
position (<18%), while the
remaining three attributes rank under the 230
th
position (<43%). The latter three attributes, although
useful for the DW, are poorly structured in the
original DB; the result is a lower DW quality. The
expert selected these attributes due to their semantic
meaning, but their informative content is poor due to
ICEIS 2007 - International Conference on Enterprise Information Systems
184
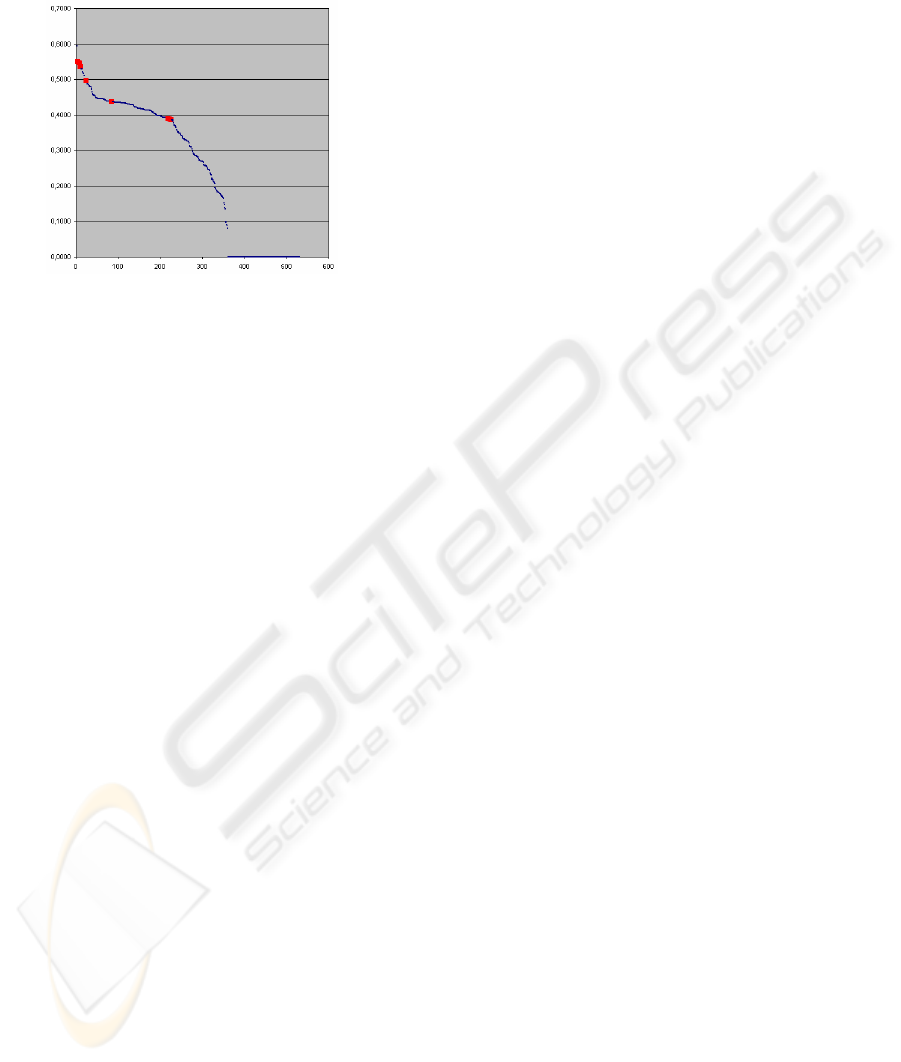
the quality and type of data they represent. Figure 2
shows the quality of DB attributes from dimensions
point of view; in the figure, selected DW dimensions
are highlighted.
Figure 2: Derived quality for dimensions.
6 CONCLUSION
In this paper, we have proposed a semantic
independent methodology for both supporting the
selection of DW measures and dimensions and
evaluating the quality of taken design choices. In
particular, we proposed a set of indexes measuring
statistical and syntactical aspects of data; derived
information supports the designer during the
selection of DW dimensions and measures.
Although we have employed unit values for the
coefficients, the experimental evaluation
demonstrated the effectiveness of our solution.
The proposed method is actually based on five
indexes for attributes and two indexes for tables; in
our future work we intend to introduce additional
indexes characterizing the attributes in order to
improve the accuracy of the measurement
(especially for dimensions). From this point of view,
we are currently evaluating the possibility of
including metrics measuring the data entropy and
using information on DB relations (e.g., computing
the rate between incoming and outgoing table
relations).
We have recently started to test our metrics on
three DBs of real world business systems; two of
them correspond to different instantiations of the
same DB schema, while the third is characterized by
a different DB schema but used to build the same
DW. Since considered systems are used by different
commercial organizations, information is
characterized by different data quality. We are then
interested in studying if our procedure is able to
correctly derive different quality measurements for
the considered DWs. The evaluation is also targeted
at highlighting possible limitations of the proposed
methodology.
REFERENCES
Ballau, D.P, Wang, R.Y., Pazer, H.L., Tayi G.K., 1998.
Modelling information manufacturing systems to
determine information product quality. Management
Science, 44(4).
Ballou, D.P., Pazer, H.L., 1985. Modeling data and
process quality in multi-input, multi-output
information systems. Management Science, 31(2),
150–162.
Chengalur-Smith, I.N., Ballou, D.P., Pazer H.L., 1999.
The Impact of Data Quality Information on Decision
Making: An Exploratory Analysis. IEEE Transactions
on Knowledge and Data Engineering, 11(6), 853-864.
Golfarelli, M., Maio, D., Rizzi, S., 1998. The dimensional
fact model: a conceptual model for data warehouses.
International Journal of Cooperative Information
Systems, 7(2-3), 215–247.
English, L.P., 1999. Improving Data Warehouse &
Business Information Quality: Methods for Reducing
Costs and Increasing Profits. Wiley and Sons.
Karr, A.F., Sanil, A.P., Banks, D.L., 2006. Data Quality:
A Statistical Perspective. Statistical Methodology,
3(2), 137-173.
Kriebel, C.H., 1978. Evaluating the quality of information
systems. Proceedings of the BIFOA Symposium.
Phipps, C., Davis, K., 2002. Automating Data Warehouse
Conceptual Schema Design and Evaluation.
Proceeding of DMDW, 23-32.
Pighin, M., Ieronutti, L., 2006. Quality of Operational
Data: a Challenge for Datawarehouse Design.
Proceedings of IBIMA Conference, 143-147.
Redman, T.C., 1996. Data Quality for the Information
Age. Artech House.
Scannapieco, M., Virgillito, A., Marchetti, C., Mecella,
M., Baldoni, R., 2004. The DaQuinCIS architecture: a
platform for exchanging and improving data quality in
cooperative information systems. Information Systems,
29(7), 551-582.
Wang, R.Y., Strong D.M., 1996a. Beyond Accuracy:
What Data Quality Means to Data Consumers. Journal
of Management Information Systems, 12(4).
Wang, R.Y., Strong D.M., 1996b. Data quality systems
evaluation and implementation. Cambridge Market
Intelligence Ltd., London.
Wang, R.Y., Storey, V.C., Firth, C.P., 1995. A framework
for analysis of data quality research. IEEE
Transactions on Knowledge and Data Engineering,
7(4), 623–640.
FROM DATABASE TO DATAWAREHOUSE: A Design Quality Evaluation
185
