
ON THE USE OF VARIOUS POWER LEVELS TO IMPROVE
WIRELESS LAN-BASED POSITIONING
Using Multiple Power Levels With Fingerprinting Algorithms
Hendrik Lemelson, Thomas King, Stephan Kopf and Wolfgang Effelsberg
Department of Computer Science IV, University of Mannheim, Germany
Keywords:
Wireless LAN, positioning systems, fingerprinting, transmission power, context-aware applications, location-
based services.
Abstract:
When talking about location-based services, one of the key factors influencing the overall service quality is the
positioning accuracy that the system can rely upon. Nowadays, wireless LAN hardware supports the variation
of the transmission power in a wide range. In this paper, two novel algorithms suitable for extension of
common wireless LAN-based positioning systems are presented. These novel algorithms exploit the additional
information that can be gained by using one or more non-standard transmission power levels. Our findings
indicate that the overall positioning accuracy and reliability can be increased with such an approach.
1 INTRODUCTION
In the past few years we have seen an on-going minia-
turization and increase of features on mobile devices.
This, in conjunction with increasing wireless band-
width available on these devices, opens the door for
new mobile applications. Especially in the research
focus here is a new type of application where the
user’s device supplies additional information to cre-
ate a more feature-rich and user-adaptive experience.
The application or service can vary its behaviour
depending on the user’s preferences, locational infor-
mation or other context information such as weather
data, available credit cards or simply, the time-of-the-
day (Chen and Kotz, 2000). These kinds of applica-
tions are called “context-sensitive applications”.
A subset of these context-sensitive applications
are the location-based ones. Leaving all other con-
text information aside, here, the service is only sup-
plied with information about the current user loca-
tion. This already increases the overall service qual-
ity a lot. Considerable research was done on location-
based services in the past few years and many promis-
ing approaches were found.
One of the major challenges in this area is the ac-
curate and reliable localisation of an object or user.
When talking about outdoor scenarios, satellite-based
systems such as GPS or Galileo (Kaplan and Hegarty,
2005) offer an almost optimal solution; however in
the indoor scenario there is still room for improve-
ment. Satellite-based systems fail to work here be-
cause the received signals are either too weak to be
used or the time-of-flight measurements are very im-
precise due to signal shading, reflection and multipath
propagation. One of the more promising approaches,
therefore, is the positioning based on wireless LAN
access points.
Even though wireless LAN is already a well
known technique, there is still much development
done especially regarding the hardware. One of the
new features that many up-to-date wireless LAN ac-
cess points offer, is the possibility to vary the trans-
mission power as needed.
Most promising positioning systems based on fin-
gerprinting and using wireless LAN though still take
the access points’ transmission power as fixed. Our
approach is to increase the amount of available infor-
mation for positioning by using multiple transmission
power levels. This paper describes the development
of novel algorithms that benefit from this increase in
available information. On the basis of several well-
known wireless LAN-based fingerprinting algorithms
we implemented novel fingerprinting algorithms ac-
cording to our approach and evaluated these to con-
firm their advantages.
225
Lemelson H., King T., Kopf S. and Effelsberg W. (2007).
ON THE USE OF VARIOUS POWER LEVELS TO IMPROVE WIRELESS LAN-BASED POSITIONING - Using Multiple Power Levels With Fingerprinting
Algorithms.
In Proceedings of the Second International Conference on Wireless Information Networks and Systems, pages 209-215
DOI: 10.5220/0002148802090215
Copyright
c
SciTePress

Fingerprinting algorithms are split into two
phases. In the offline phase, data is collected at
given reference positions. This data is used to cre-
ate so-called “fingerprints” for these reference po-
sitions. They reflect the unique properties of the
signals at each position. In the subsequent phase,
called positioning, live, or online phase, collected
live samples are compared to each fingerprint to es-
timate the position using an algorithm-specific met-
ric. To sample the signal strength of access points the
so-called active scanning approach is typically used
(King et al., 2007).
The remainder of this paper is structured as fol-
lows: In Section 2, an overview of related projects in
the area of positioning with wireless LAN and finger-
printing is given. Section 3 introduces the algorithm
we used as a basis and describes the extensions that
are necessary to use the algorithm with multiple trans-
mission power levels. In Section 4, an overview of the
evaluation testbed as well as the hard- and software
used is given. The methodology of the evaluation is
presented in Section 5. Finally, Section 6 concludes
the paper and gives an outlook to our future work.
2 RELATED WORK
In the area of indoor positioning, much effort and
work were done during the past few years (Want et al.,
1992; Priyantha et al., 2000). One of the newer
projects regarding this topic is the Landmarc position-
ing system (Ni et al., 2004). It uses RFID technology
to estimate the position of objects that are equipped
with RFID tags. One of the key ideas of this system
is the use of several concentric reading ranges to de-
termine properties of the signal space and to increase
the accuracy of distance estimates using this informa-
tion. The Landmarc system was the key motivation
to develop and examine a wireless LAN positioning
system that uses different transmission power levels.
Due to the bad signal propagation properties
that wireless LAN signals show indoors (Rappaport,
2001), the general consensus is that a fingerprinting-
based approach is a good solution for such a scenario.
We chose to base our novel algorithms on the RADAR
positioning system (Bahl and Padmanabhan, 2000)
and the system described in (Haeberlen et al., 2004).
Both positioning systems use wireless LAN and fin-
gerprinting but utilize different metrics. To refer to
the latter one, we use the name RICE for the remain-
der of this paper, even though this is not its official
name.
In this paper, only the results regarding the RICE
positioning system are presented due to the limited
space available.
The RICE positioning system adopts a probabilis-
tic approach. The fingerprints for the reference posi-
tions contain either histograms of the collected signal
strengths of each access point or values for average
and standard deviation of the signal strengths com-
puted from the histograms. The values represent a
normal distribution with these parameters. For both
variants, in the positioning phase a value is computed
for each reference position using the collected live
sample and the corresponding fingerprint. This value
reflects the overall probability to be at that position.
The algorithm then selects the reference position with
the highest probability. We use the variant based on
the Gaussian distributions in our evaluation.
As the RADAR system offers a feature called K-
Nearest-Neighbors (Bahl and Padmanabhan, 2000)
that was not available in the original implementation
of the RICE algorithm we extended the RICE system
to support this feature as well for comparability and
fairness. How the extension works in detail is ex-
plained in Section 3.2.
3 ALGORITHMS
The following sections provide a brief overview over
the original implementation of the RICE algorithm,
the K-Nearest-Neighbors extension and our two novel
algorithms that use multiple transmission power lev-
els.
3.1 Original Algorithm
The original RICE algorithm that was taken as a ba-
sis for some of our novel algorithms uses normal dis-
tributions to describe the distribution of the received
samples’ signal strengths. In contrast to the one using
histograms, this variant is more robust and requires
a reduced amount of offline samples to compute the
fingerprints.
In the positioning phase a sample is collected and
compared to all stored fingerprints using the follow-
ing metric:
The probability P
r,ap
(s
ap
) to receive the signal of
a certain access point ap with a certain signal strength
s
ap
at a given reference position r is defined by:
P
r,ap
(s
ap
) =
s+0.5
s−0.5
d f(avg
r,ap
, stddev
r,ap
) (1)
where d f is the density function of the normal
distribution with the average avg
r,ap
and the standard
deviation stddev
r,ap
for the access point ap. These
values are taken from the fingerprint for position r.
Because the probability for a single value is zero by
definition, we consider the probability for an interval
WINSYS 2007 - International Conference on Wireless Information Networks and Systems
226

of s ± 0.5 instead. The interval of s ± 0.5 is used to
map the discrete signal strength values received from
the hardware (-102dB to 0dB) to the continuous num-
berspace of the normal distribution.
The overall probability computed for one refer-
ence point is now defined by:
P
r
(s) = Π
n
i=1
P
r,ap
i
(s
ap
i
) (2)
Hereby, n is the number of access points that are
found in the collected live sample, s
ap
i
is the signal
strength collected for the access point ap
i
and r is the
current reference position of which the fingerprint is
taken as a comparator.
After having compared the collected sample to the
fingerprints of all reference positions, the algorithm
selects the reference point as the estimated position
that has the highest overall probability.
3.2 K-Nearest-Neighbors
As mentioned earlier, we have extended the RICE
algorithm by a feature called K-Nearest-Neighbors
taken from the original RADAR positioning system.
The details of this modification are described in (King
et al., 2006). Such an approach was necessary to en-
sure a fair comparison between our novel and the ex-
isting algorithms.
The K-Nearest-Neighbors extension not only uses
the best matching reference position to make a posi-
tion estimate but takes the K best matches into consid-
eration. The coordinates of these K best matching ref-
erence positions are averaged and the result of these
computations is taken as the position estimate. Sensi-
ble values for K are 2 to 4, according to the authors of
RADAR.
3.3 Power Level Aware Algorithms
Using the RICE or RADAR algorithms with a single
transmission power level that simply differs from the
stock one does not require any modifications as long
as the fingerprints and the live samples are collected
using the same transmission power level.
Using more than one transmission power level
though, requires some changes to the way the algo-
rithm handles the multiple samples and results. The
first thing to mention here is, that of course for each
used transmission power level the algorithm has to
be supplied with a fingerprint database for that power
level. Furthermore, if a power level is used multiple
times, the algorithm should be given a distinct finger-
print database for each occurrence.
In the positioning phase, the algorithm has to be
supplied with live samples for each used transmission
power level or occurrence of a transmission power
level as well. Afterwards, for each reference posi-
tion and sample a probability is computed using the
sample itself and the corresponding fingerprint.
P
r,tx
(s
tx
) = Π
n
i=1
P
r,ap
(s
ap
i
,tx
) (3)
Here, n is again the number of access points that
are found in the collected sample for power level tx,
s
ap
i
,tx
is the signal strength collected for ap
i
in power
level tx and r is the current reference position whose
fingerprint is taken as the comparator.
When the algorithm has finished the computation
of the probabilities for all transmission power levels,
there are several ways to handle these results.
3.3.1 Distinct
One way is to handle each probability independently
from the others. For each power level, the reference
position with the highest probability is selected using
the computed probabilities for that power level. This
results in one position estimate for each power level.
Since these estimated positions for the single power
levels can differ from each other, they have to be post-
processed afterwards to produce one final result. This
can be done by computing the centroid over all posi-
tion estimates like it is done by K-Nearest-Neighbors
for example.
The advantage of this approach is that no changes
to the core algorithm itself are necessary. Only the
sourrounding logic that supplies the algorithm with
the fingerprint databases and the live samples and
that processes the results has to be adapted. It has
to supply the corresponding samples and fingerprint
databases for each power level and to handle the mul-
tiple results in an appropriate manner.
The direct benchmarks for this algorithm devel-
oped by our team in Mannheim is the RICE algorithm
extended by the K-Nearest-Neighbors feature. Using
a similar approach, our algorithm still has the advan-
tage of using K times the most probable position esti-
mate instead of using the K best position estimates.
3.3.2 Combined
A second possible way of handling the various sub-
probabilities is to merge them into one final probabil-
ity per position. In this case, all sub-probabilities for
each reference position are multiplied, thus resulting
in one final probability per position. The goal of this
approach is to exploit interference effects between the
single transmission power levels in such a way that
some power levels can absorb outlying values of an-
other power level. This is similar to supplying more
than one live sample to the original algorithms, again
ON THE USE OF VARIOUS POWER LEVELS TO IMPROVE WIRELESS LAN-BASED POSITIONING - Using
Multiple Power Levels With Fingerprinting Algorithms
227

with the major difference of using different transmis-
sion power levels and fingerprint databases in our ap-
proach:
P
r
(s) = Π
tx
n
tx=tx
1
P
r,tx
(s
tx
) (4)
When given a sample set s, the overall probability
P
r
(s) to be at the reference position r is the product of
all sub-probabilities for the transmission power lev-
els tx
1
to tx
n
occurring in the sample set to be at that
reference position (also see Equation 3).
4 EVALUATION SETUP
In the following, we briefly describe the setup of the
evaluation.
4.1 Evaluation Environment
The evaluation environment is the second floor of the
building A5,6 B at the University of Mannheim in
which the offices of our department of Computer Sci-
ence are located. The area is split up into two hall-
ways, several offices and three smaller rooms in the
middle of the hallways (see Figure 1). The two hall-
ways are measured 30 x 6 meters and 15 x 4 meters
respectively covering an area of approximately 240
square meters.
Figure 1: Floor plan of the evaluation environment.
4.2 Hard- and Software
To build up the wireless LAN infrastructure, five
WRT54GL V1.1 access points manufactured by
Linksys/Cisco are used. They are spread over the
evaluation environment as depicted by the black
squares in Figure 1. These access points do not
support the variation of the transmission power per
se. But as their firmware is based on Linux and
is Open Source, several alternatives to the manufac-
turer’s firmware exist. In addition, some of these do
support the variation of the transmission power. We
decided to use the firmware DD-WRT v23 RC1 de-
veloped by the DD-WRT project
1
. It offers the pos-
sibility to vary the transmission power in 1 mW steps
from 1 mW to 251 mW and can be controlled using a
web interface or via ssh and telnet.
To collect the offline as well as the live samples,
we used an IBM Thinkpad R51 laptop computer run-
ning Suse Linux 10.1. Due to driver limitations,
we could not collect our data with the internal Intel
2200bg network card. It was therefore switched off
and a plug-in Lucent Silver PCMCIA card was uti-
lized instead.
On the software side, the samples were collected
with the LocEva framework (King and Kopf, 2007)
which is available in Java. The application to col-
lect the samples uses the Java Native Interface and
a small wrapper written in C to interact with the op-
erating system kernel’s wireless extensions interface
by system calls. This makes it possible to request the
communication parameters and connection informa-
tion from the wireless LAN card’s driver.
Regarding the variation of the access points’ trans-
mission power levels, the application used to collect
the samples was extended by the ability to switch
all access points simultaneously to one transmission
power level. This is done by sending commands to
the web interface of the devices using HTTP requests
and monitoring the status replies to verify the success-
ful execution. As the wireless link was occupied for
sensing, we used a wired ethernet link to communi-
cate with the infrastructure.
4.3 Data Collection
To get a sufficient amount of data for the evaluation
and to achieve stable statistical results, 186 reference
points were laid out in the evaluation environment us-
ing a grid of one meter side length (see the grey dots
in Figure 1). The samples collected at these positions
are the foundation for the fingerprint databases in our
evaluation.
Additionally, 63 live points were randomly spread
over the hallways (see the black dots in Figure 1). The
samples collected at these positions are used to emu-
late a user requesting a position estimate.
The selected transmission power levels for the
evaluation are 3 mW, 13 mW, 23 mW, 33 mW, 43 mW,
53 mW and 63 mW. The lower boundary 3mW was
chosen due to some fluctuations in the signal strength
we observed below that transmission power level. As
we can see in Figure 2, the signal strength decreases
from 0 mW to 3 mW and only afterwards begins to
1
DD-WRT Project Website: http://www.dd-wrt.com
WINSYS 2007 - International Conference on Wireless Information Networks and Systems
228
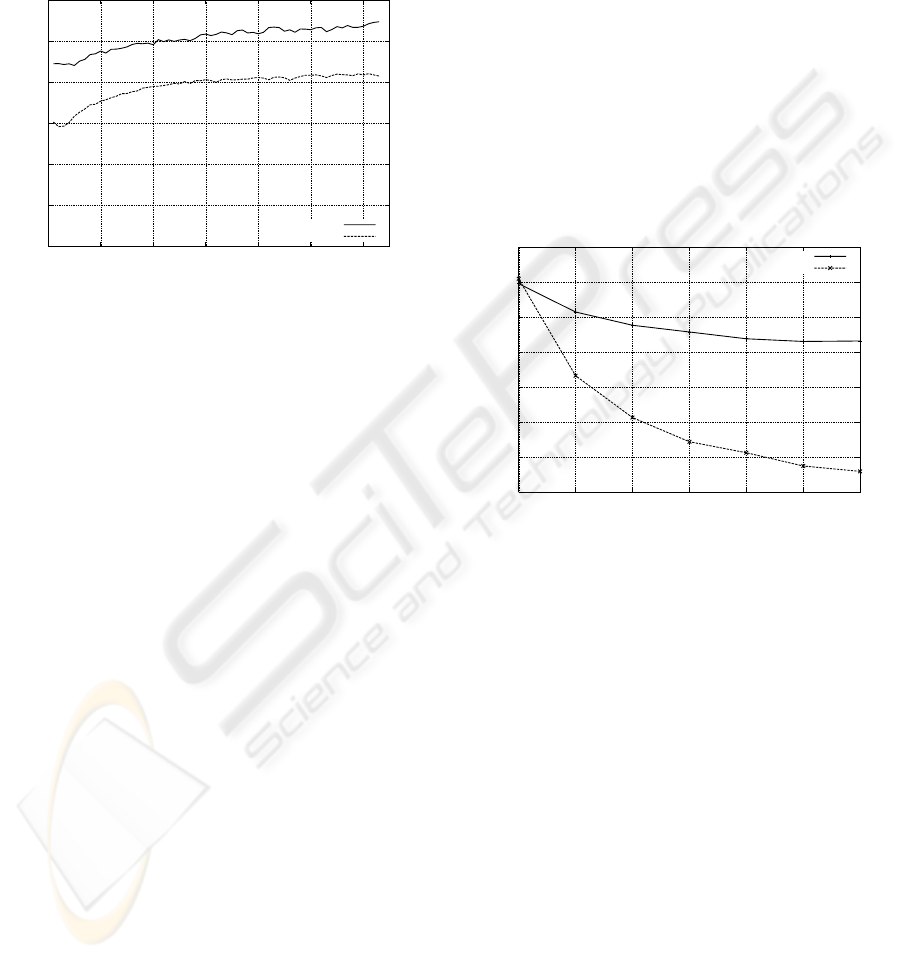
increase almost monotonically. The upper bound-
ary for our measurements was selected to stay below
governmental regulations regarding the maximal al-
lowed EIRP (Effective Isotropic Radiated Power) for
devices using the 2.4 GHz band in Germany. Finally,
the stepsize of 10 mW was chosen to get noticeable
differences between adjacent power levels.
−100
−90
−80
−70
−60
−50
−40
0 10 20 30 40 50 60
Signal strength [dB]
Transmission powerlevel [mW]
8m away
24m away
Figure 2: Irregularities regarding the signal strength.
During the data collection phase, 110 samples per
power level were collected for each reference position
and live position. Hereby, the application switched
all access points to the next power level automatically
after having collected 110 samples. This was repeated
until all power levels had been processed.
The collected samples contain a timestamp, the
MAC address of the collecting wireless LAN card, the
current position, the current transmission power level,
and for each received access points the MAC address,
the channel and the RSSI (received signal strength in-
dicator) value. All samples were stored in a logfile for
easy reference during the following evaluation.
5 EVALUATION
In this section, the results of the evaluation of our
novel algorithms are presented.
The key questions for this evaluation was whether
a combination of several different power levels or at
least the multiple use of one non-standard power level
would outperform the others. For this reason, we eval-
uated different combinations of transmission power
levels, namely 127 different permutations of the se-
lected seven power levels as well as 49 doublets. A
doublet in this context means that one power level was
used not only once but up to seven times by supplying
the algorithm with multiple samples and fingerprint
databases for a given transmission power level.
For each permutation and doublet, a total of 500
runs were performed for each algorithm. For each run
the algorithms were given 20 randomly selected sam-
ples per power level and reference position to build
the fingerprint database. Afterwards, one sample per
power level and live position was supplied to com-
pute a position estimate. The difference between the
estimate and the real position, called positioning er-
ror, was calculated and stored for later reference and
analysis. In addition, the average positioning error as
well as an error distribution was computed and stored.
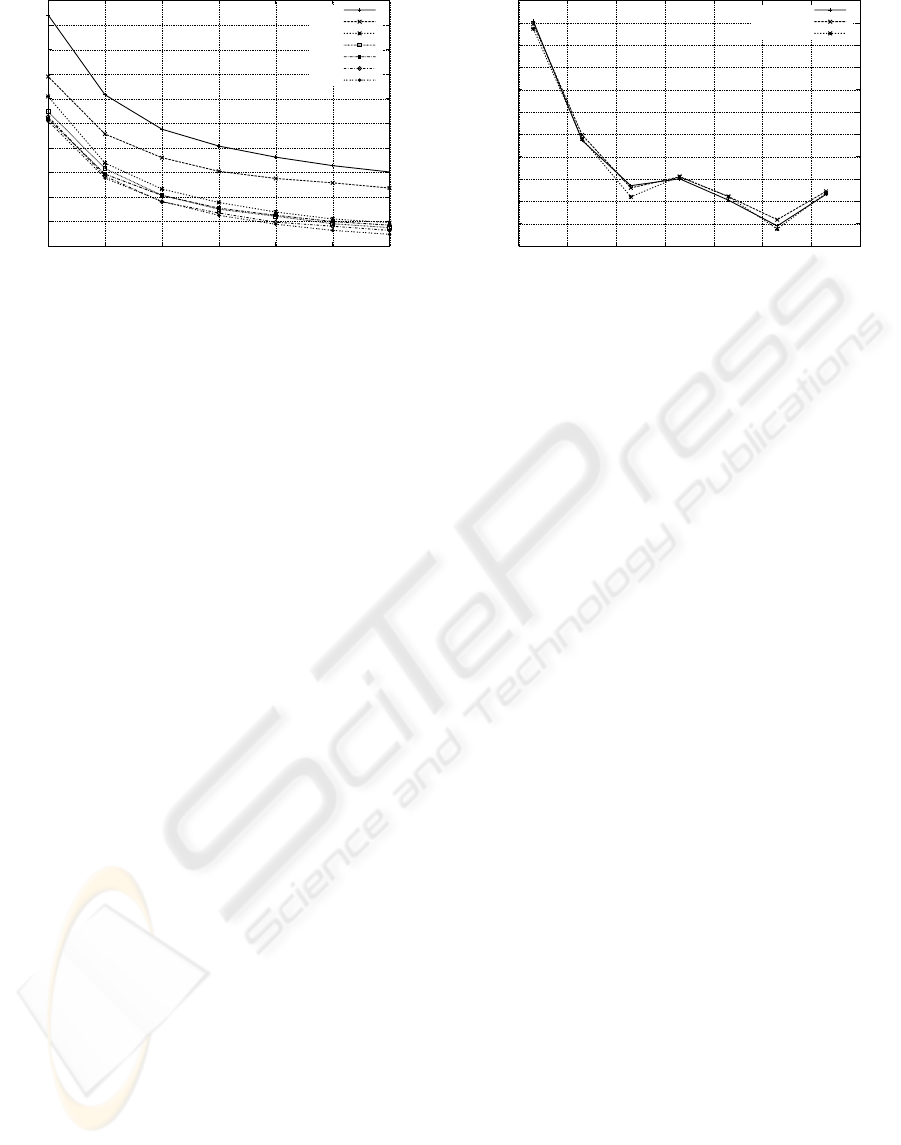
5.1 Number of Power Levels
This section summarizes the results on the influence
of the total number of used power levels on the accu-
racy of the position estimate. As we can see in Figure
3, the number of transmission power levels has a con-
siderable influence on the average error.
2
2.2
2.4
2.6
2.8
3
3.2
3.4
1 2 3 4 5 6 7
Avgerage error [m]
Number of transmission powerlevels
COMBINED
DISTINCT
Figure 3: Influence of the number of transmission power
levels.
The more power levels are used, the better the re-
sults are due to the higher amount of data available for
positioning. This can be compared to feeding more
than just one online sample to the original variants of
the algorithms.
Also visible is the advantage the DISTINCT algo-
rithm takes by computing a single position estimate
for each power level and merging these afterwards to
one final result. Instead of using all the data to com-
pute just one position at the end, this approach pro-
duces better results and a later saturation of the gain.
At first, when several position estimates are com-
puted by using several live samples, it is likely that the
estimated positions are located somewhere around the
real position. The error vectors of the single position
estimates therefore are likely to point into different
directions. If these vectors are merged, the interme-
diate errors interfere with each other resulting in a re-
duction of the overall error (Bahl and Padmanabhan,
2000).
ON THE USE OF VARIOUS POWER LEVELS TO IMPROVE WIRELESS LAN-BASED POSITIONING - Using
Multiple Power Levels With Fingerprinting Algorithms
229
2
2.2
2.4
2.6
2.8
3
3.2
3.4
3.6
3.8
4
1 2 3 4 5 6 7
Average error [m]
Number of transmission powerlevels
3mW
13mW
63mW
43mW
23mW
33mW
53mW
Figure 4: Influence of the transmission power level. when
increasing the number of power levels.
Secondly, averaging several position estimates
makes it possible to also reach positions in between
the grid points that would not be accessible by sim-
ply matching to grid positions. This has a smooth-
ing effect on the overall error distribution because
of the finer granularity of the possible positions
(see Figure 6).
5.2 Selection of Power Levels
The selection of power levels clearly influences the
results as well. As we recognise in Figure 4, some
of the power levels perform far better than others, no
matter if a transmission power level is used only once
or up to seven times.
While it might not be suprising that the very low
settings perform worse due to their very instable sig-
nals, a mere raising of the transmission power is
clearly also not the best strategy. According to our
evaluation, the best results can be achieved by us-
ing a transmission power level of 53 mW. A further
increase of the transmission power reduces the accu-
racy again (see Figure 5). The reason for this behavior
are the low fluctuations the signals have in that power
level and the good differentiation between different
reference positions in signal space. These fluctuations
are also the reason for the unexpected good result of
the powerlevel 23 mW. In this power level the stan-
dard deviation of the signal strengths was lower than
those of the adjacent power levels such resulting in a
better position accuracy.
Of course, this can not be generalized based on
our test environment as e.g. hardware properties as
well as the structural environment could influence the
results. To verify the general validity, tests using dif-
ferent hardware as well as a different testbed are nec-
essary.
From our collected results, it is clear, that the use
of different power levels performs worse compared to
3.1
3.2
3.3
3.4
3.5
3.6
3.7
3.8
3.9
4
4.1
4.2
0 10 20 30 40 50 60 70
Avgerage error [m]
Transmission powerlevel [mW]
COMBINED
DISTINCT
RICE
Figure 5: Influence of the transmission power level.
using the best power level several times. The 53mW
doublet of a certain size n outperforms all the permu-
tations of the same size regardless of their composi-
tion in nearly all setups. The reason here is that using
only the best intermediate results leads to a better es-
timate than taking worse estimates into consideration,
which is done when using different power levels. Ad-
ditionally, no exploitable synergies between different
power levels are visible that could absorb this disad-
vantage.
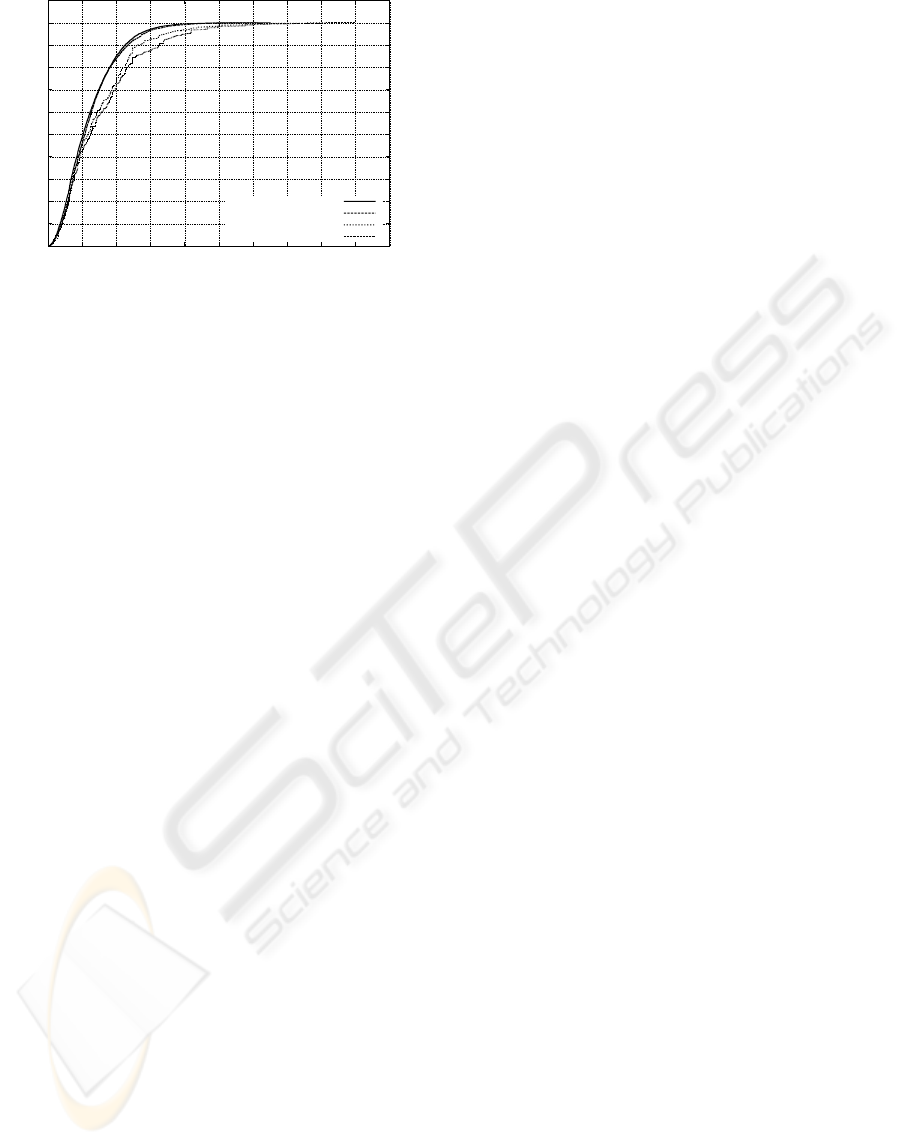
5.3 Advantages of Different Power
Levels
When comparing the original algorithm to our novel
algorithms, only minor differences in the accuracy of
the position estimates are detectable. Using the same
power level, the results of the original algorithm given
20 samples per reference position to build the finger-
print database and s samples during the online phase
are - leaving statistical fluctuations aside - the same
as those of the COMBINED variant using the power
level s times (see Figure 6). This suggests that the use
of several different fingerprint databases for the same
power level does not make much sense if the number
of samples used for each fingerprint is high enough
to create stable values. In this case, the fingerprints
in the different databases for the same power level are
very similar, making more than one database obsolete.
5.4 Advantages of Multiple Power
Levels
Another interesting observation is the high benefit of
computing several independent position estimates and
averaging these afterwards in comparison to summa-
rizing the computational results for all online sam-
ples and then making one position estimate. The first
method achieves far better and more stable results. As
WINSYS 2007 - International Conference on Wireless Information Networks and Systems
230
0
0.1
0.2
0.3
0.4
0.5
0.6
0.7
0.8
0.9
1
1.1
0 2 4 6 8 10 12 14 16 18 20
Probability
Positioning error [m]
DISTINCT
RICE (K=4)
COMBINED
RICE (7 samples)
Figure 6: Similar results regarding the COMBINED Variant
and the original algorithm given 7 samples, and the DIS-
TINCT variant and the original algorithm merging the 4
best matches respectively.
already mentioned earlier, when merging the position
estimates for each power level, the probability of the
error vector pointing to different directions is quite
high.
A good strategy to define the parameters for a
wireless LAN based positioning system based on fin-
gerprinting would thus be the following: At first, a
well suited transmission power level should be se-
lected. In our case, this would be 53 mW as this trans-
mission power level produced the best results (see
Figure 5).
Secondly, as the gains in position accuracy by in-
creasing the amount of samples tend to fade out at
higher amounts, it seems to make sense to supply up
to three live samples per position estimate to the algo-
rithm (see Figure 3).
Keeping in mind that the merging of several posi-
tion estimates highly increases the accuracy, at least
two to four position estimates should be computed
and merged afterwards. In opposition to the original
approach, a further increase of the number of com-
puted neighbors would not decrease the overall posi-
tion accuracy as the single estimates are calculated in
independent runs.
Finally, the fingerprints stored in the database
should be computed using enough offline samples to
allow the values to stabilize.
6 CONCLUSIONS
In this paper, we presented novel algorithms using
multiple transmission power levels for fingerprinting-
based positioning with wireless LAN.
We experimentally verified that the usage of mul-
tiple different transmission power levels for our wire-
less LAN positioning algorithms has minor advan-
tages. In addition, the use of multiple fingerprint
databases has almost no positive influence on the
achieved results when using one transmission power
level.
We further demonstrated that the selection of a
special non-standard transmission power level has a
remarkable influence on the positioning accuracy and
that the merging of several independently computed
sub-estimates helps to increase the quality of the re-
sults significantly. We presented a strategy for a good
selection of the number of supplied live samples as
well as the number of sub-estimates that leads to an
overall gain in accuracy and stability.
REFERENCES
Bahl, P. and Padmanabhan, V. N. (2000). RADAR: An In-
Building RF-Based User Location and Tracking Sys-
tem. In Proc. of the 19th IEEE InfoCom.
Chen, G. and Kotz, D. (2000). A Survey of Context-
Aware Mobile Computing Research. Technical Report
TR2000-381, Dartmouth College.
Haeberlen, A., Flannery, E., Ladd, A. M., Rudys, A., Wal-
lach, D. S., and Kavraki, L. E. (2004). Practical Ro-
bust Localization over Large-Scale 802.11 Wireless
Networks. In Proc. of the 10th ACM MobiCom.
Kaplan, E. and Hegarty, C., editors (2005). Understand-
ing GPS: Principles and Applications. Artech House
Incorporated, second edition.
King, T., Haenselmann, T., Kopf, S., and Effelsberg,
W. (2007). Overhearing the Wireless Interface for
802.11-based Positioning Systems. In Proc. of the 5th
IEEE PerCom.
King, T. and Kopf, S. (2007). Loclib - A Loca-
tion Library. Website: http://www.informatik.uni-
mannheim.de/pi4/lib/projects/loclib/.
King, T., Kopf, S., Haenselmann, T., Lubberger, C., and Ef-
felsberg, W. (2006). COMPASS: A Probabilistic In-
door Positioning System Based on 802.11 and Digital
Compasses. In Proc. of the 1st ACM WiNTECH.
Ni, L. M., Liu, Y., Lau, Y. C., and Patil, A. P. (2004).
LANDMARC: indoor location sensing using active
RFID. Wireless Networks, 10:701–710.
Priyantha, N. B., Chakraborty, A., and Balakrishnan, H.
(2000). The Cricket Location-Support System. In
Proc. of the 6th ACM MobiCom.
Rappaport, T. S. (2001). Wireless Communications: Princi-
ples and Practice. Prentice Hall PTR, second edition.
Want, R., Hopper, A., Falcao, V., and Gibbons, J. (1992).
The Active Badge Location System. ACM Transac-
tions on Information Systems, 10(1):91–102.
ON THE USE OF VARIOUS POWER LEVELS TO IMPROVE WIRELESS LAN-BASED POSITIONING - Using
Multiple Power Levels With Fingerprinting Algorithms
231
