
USING 3D FEATURES TO EVALUATE CORK QUALITY
Beatriz Paniagua-Paniagua
1
, Miguel A. Vega-Rodríguez
1
, Hiroshi Nagahashi
2
Juan A. Gómez-Pulido
1
and Juan M. Sánchez-Pérez
1
1- Dept. Technologies of Computers and Communications. Extremadura University
Escuela Politécnica. Campus Universitario, s/n. 10071. Cáceres. Spain
2- Imaging Science and Engineering Laboratory. Tokyo Institute of Technology
R2-51, 4259 Nagatsuta-cho, Midori-ku, Yokohama 226-8503, Japan
Keywords: Image processing, cork quality classification, 3D feature extraction.
Abstract: In this paper we study different 3D features in cork material. We do this in order to solve a classification
problem existing in the cork industry: the cork stopper/disk quality classification. Cork Quality Standard
sets seven different cork quality classes for cork stopper classification. These classes are based on a
complex combination of cork stopper defects. In previous studies we only analysed those features that could
be detected/acquired with a 2D camera. In this study we work in a 3D environment, in order to extract those
features that we could not be extracted in a 2D approach. As a conclusion we can say that the most
important 3D cork quality detection feature takes into account dark and deep cork areas (usually, these areas
indicate deep and important defects). Furthermore, the 3D features have widely improved the results
obtained by similar features with a 2D approach, due to the 3D approach includes more information. This
fact allows us to extract more complex features, as well as improve the classification results.
1 INTRODUCTION
Oak is a tree that mostly grows in the western shores
of the Mediterranean Sea. Because of this fact, the
cork industry has a big economic importance and
great research interest in the native zones of this
material.
The most important industrial application of cork
is the production of disks and stoppers for sealing
wines, ciders, and champagnes. In the cork industry,
stoppers and disks are classified in different quality
classes based on a complex combination of its
defects. Due to this high heterogeneity degree,
traditionally, the classification process has been
carried out by human experts manually.
At the moment, there are several models of
electronic machines for the cork stoppers
classification in the market. The performance of
these machines is acceptable for high quality
stoppers/disks, but for medium or low quality, the
number of samples classified erroneously is large. In
conclusion, the stoppers/disks should be re-
evaluated by human experts later. This increases the
process price and the production time because a
human expert needs a minimum training period of 6
months to attain minimum classification accuracy,
although the learning process can last years.
Furthermore, a human classifier can introduce some
mistakes on the classification due to his/her
subjectivity degree. In conclusion, more research
efforts are necessary in the automatic cork
classification field.
We have to add to these reasons the fact that
Spain produces 31% (ASECOR, 2006) of the
worldwide cork. All these motivations have lead us
to the development of this research, whose final
main objective is the construction of a computer
vision system for cork classification based on
advanced methods of image processing and feature
extraction in order to avoid the human evaluation in
the quality discrimination process.
In this work we try to prove the accuracy of new
3D features in cork quality classification. In
previous works (Paniagua-Paniagua et al, 2006a;
Paniagua-Paniagua et al, 2006b), a wide study about
feature extraction was made. Now, we try to analyse
the automatic feature extraction of cork quality,
within a 3D approach. We have focused this study
on feature extraction, and several new cork quality
3D features have been obtained. We will test the
79
Paniagua-Paniagua B., A. Vega-Rodríguez M., Nagahashi H., A. Gómez-Pulido J. and M. Sánchez-Pérez J. (2007).
USING 3D FEATURES TO EVALUATE CORK QUALITY.
In Proceedings of the Second International Conference on Signal Processing and Multimedia Applications, pages 79-84
DOI: 10.5220/0002136700790084
Copyright
c
SciTePress
performance for each 3D feature, to see the
individual reliability of each quality discriminator.
However, the main final objective is the
development of a system that uses a complex
combination of features to make the automatic cork
quality classification.
The rest of the paper is organized as follows:
section 2 describes briefly the acquisition system
and data we have used. In section 3 we present the
theoretical bases of this work. Section 4 shows the
results and statistical evaluation for the new 3D
features studied, while section 5 exposes the final
conclusions.
2 TOOLS AND DATA
As a first step, we need to acquire again all the
images in our Cork Image Database (CID), but in
this case with a 3D approach. For this purpose, we
have used a total of 350 cork disks (there are seven
different quality classes, 50 disks per class).
Furthermore, a laser camera system of the
ShapeGrabber Company was used (ShapeGrabber,
2005a; ShapeGrabber, 2005b). The storage is made
with “3pi” files, created by the ShapeGrabber
Software to represent scanned data in ASCII.
When scanning with the ShapeGrabber system,
the data are acquired following the rule: one profile
at a time. A profile is the data collected from the
processing of one full laser line. The points are
ordered in a profile in ascending order along the X-
axis. For each of these points, the coordinates of the
point (x, y, and z), the intensity value and the order
of the point in the profile are given. We will use this
information to extract the 3D cork quality features in
which this paper is focused on.
3 METHODS
This is the methodology we have followed in this
research.
3.1 Background Thresholding
After the data acquisition and before going further in
our research, an automatic thresholding algorithm
was developed. This was made because the acquired
images had some superfluous areas (acquisition
surface that does not correspond to cork, see figure
1) that we needed to remove from each of the 3D
images in our CID. That is, we needed to delete the
background from the 3D cork images, in order to
perform the 3D feature extraction research.
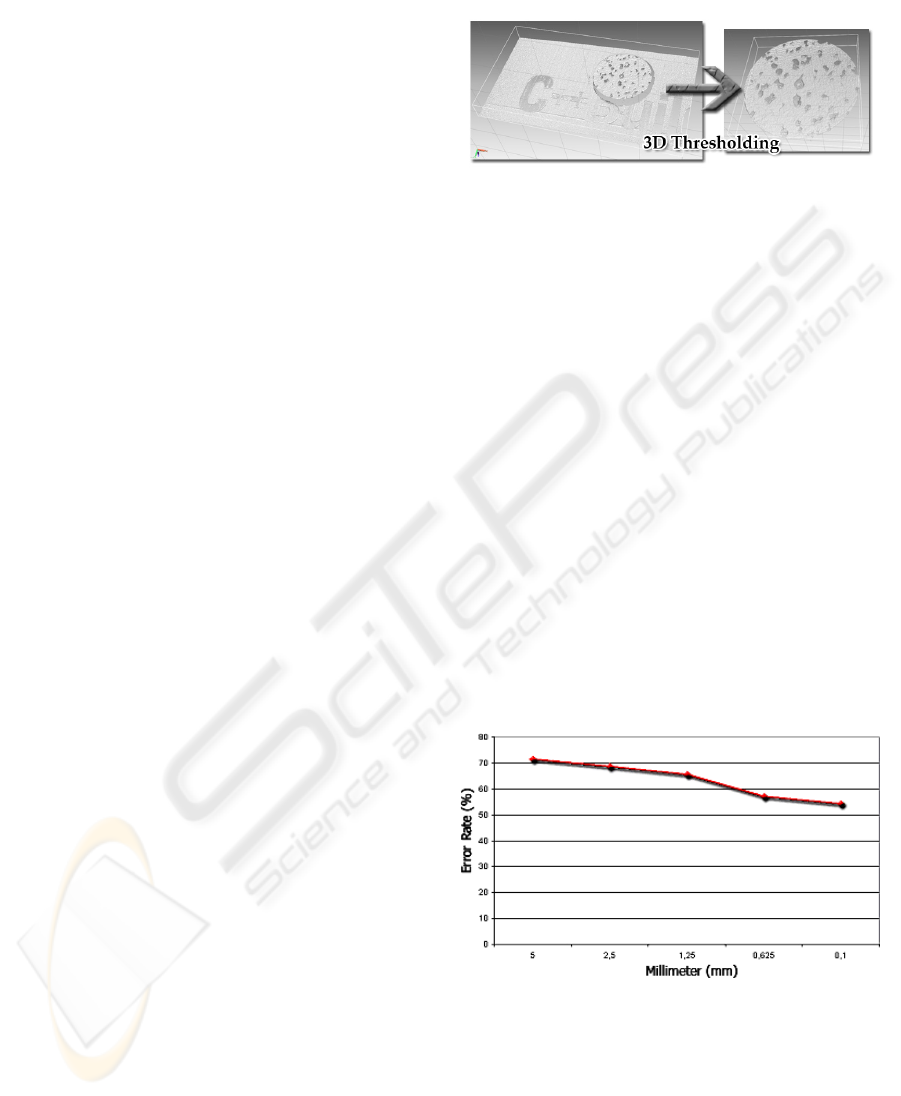
Figure 1: 3D images before and after the 3D thresholding.
To do that, we only consider those 3D points that
have a lower depth of Z-axis value than those points
that belong to the background.
3.2 Initial Feature Extraction
The following step was the extraction of a 3D
feature suitable for doing some preliminary tests
with our 3D laser camera. Concretely, the feature
extracted is conformed by the percentage in the cork
area occupied by 3D points that are not only dark
(intensity) but also deep (coordinate Z). A cork
stopper with a high value in this feature will glimpse
having a low quality, because the higher this value
is, more deep defects will exist within the cork.
3.3 Resolution Study
Then, we decided to develop an initial study to
discover the optimal resolution value for using the
3D laser-camera in the acquisition of cork images.
Figure 2: Decreasing error rate tendency when the
resolution increases.
Figure 2 shows the error rate obtained in the cork
quality classification, using the previous 3D feature
and a minimum Euclidean Distance classifier. We
can see that when the resolution increases, the error
rate decreases.
SIGMAP 2007 - International Conference on Signal Processing and Multimedia Applications
80
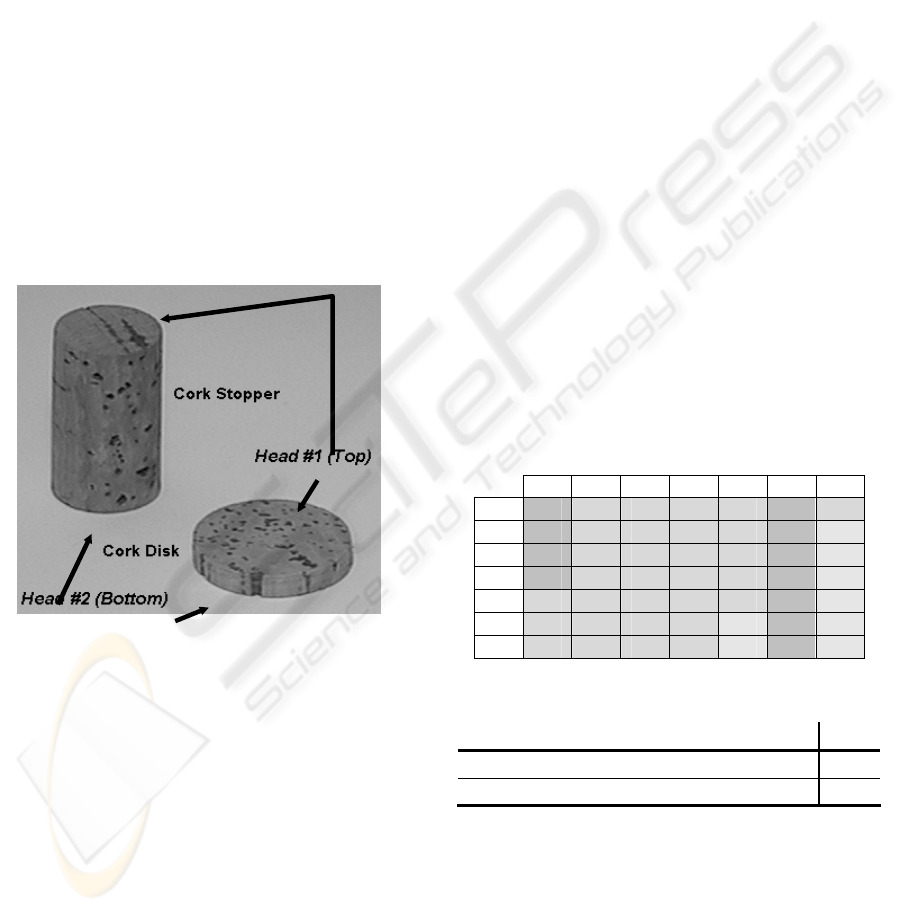
3.4 Classification Criterion Selection
Our classification system acquires images from both
heads of the stopper/disk (see figure 3). Because of
that fact, we have carried out studies in which, using
our initial 3D feature (see section 3.2), we have
selected the optimal stopper-head criterion. The
three studied criteria are:
- The feature is computed by choosing the best
result obtained between both heads in the acquisition
process. The final error rate for this criterion was
59.42%.
- The feature is computed by choosing the worst
result obtained between both heads in the acquisition
process. The final error rate in this case was 70.28%.
- The feature is computed by choosing an
average value from the two obtained in both heads.
That is, we have to obtain the feature for each head
and make an average between them. In this situation
we obtained the best classification, being the error
rate 52.57%.
Figure 3: The two heads of a cork stopper/disk.
In conclusion, the best classification criterion is
the one that contemplates an average value between
both stopper heads. We have used it in all our
experiments.
3.5 3D Features Extraction
After making the acquisition of our whole CID with
the optimal resolution (in this case, the highest for
our 3D camera, 0.1 mm), we perform the last and
most important stage: extraction and
experimentation of new 3D cork quality features.
The studied features have been designed in a
heuristic way, by analizing the human experts
classifications and considering the visual features
they choose in their classifications. The conclusions
of this analysis make us chose the following 3D
features for our research:
Maximum depth of the defects within the cork
surface (and some variants).
Weighted sum of the defects according to their
relative depth.
Amount of defect pixels in a concrete depth
level.
4 RESULTS
All the results in this section have been obtained by
using a classifier of minimum Euclidean distance
(Shapiro and Stockman, 2001). We will use
confusion matrix in order to show the results.
As for the maximum depth of the defects, it seems
logical to think that the depth of the defects (cracks
and holes) will make a differentiation between the
different cork quality classes, because usually the
deeper a defect is, the more important this defect is.
However, the obtained results are not as good as we
expected (table 1). There is not tendency towards the
main diagonal in the confusion matrix, and all the
classifications are around classes 0 and 5. The error
rate is high (table2), being 80.28%.
Table 1: Confusion matrix for the Maximum Depth.
C0 C1 C2 C3 C4 C5 C6
C0
21 4 4 2 3 15 1
C1
15 2 6 2 1 24 0
C2
20 3 4 1 1 21 0
C3
14 5 3 2 3 23 0
C4
9 2 2 4 4 29 0
C5
9 2 2 1 0 36 0
C6
3 2 2 2 0 41 0
Table 2: Final results for the Maximum Depth.
C0 C1 C2 C3 C4 C5 C6 TOT.
Right 21 2 4 2 4 36 0
69
Wrong 29 48 46 48 46 14 50
281
Because of the bad results obtained, we decided
to make an observation of the 3D data in our
database. Doing this we realized that it could be
possible that the bad results were produced by a side
deviation in some cork stoppers. This fact makes the
cork stopper sides irregular for the research, as we
show in figures 4 and 5.
USING 3D FEATURES TO EVALUATE CORK QUALITY
81
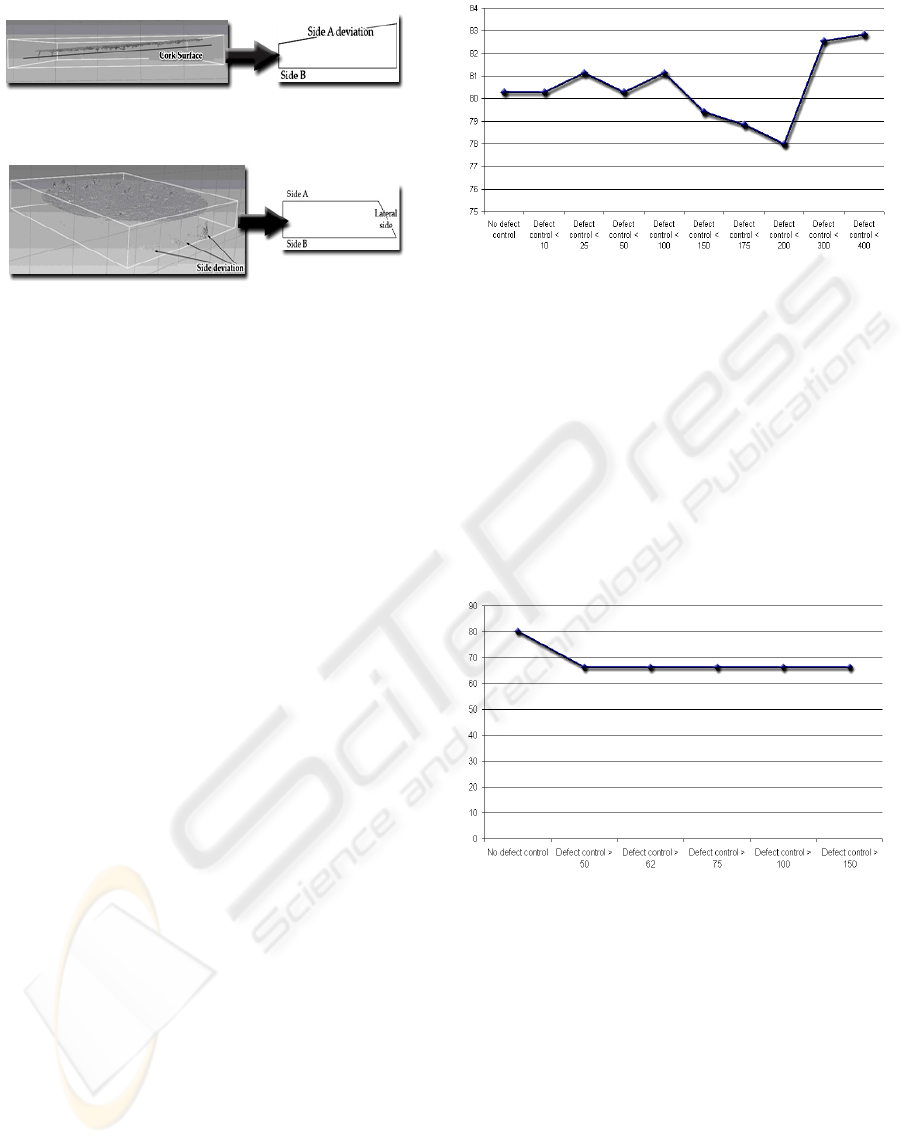
Figure 4: Deviations in the head surface of the cork disk.
Figure 5: Deviations in the lateral side surface of the cork
disk.
But this fact is not strange in industrial
environments, due to the cork stoppers production
machines can introduce some mistakes in some
stoppers, and because cork is a porous material to
which the environmental temperature can affect.
Due to these deformations in the data, it was decided
to make some additional experimentation with this
3D feature. In this new set of experiments we added
two important details to the 3D max depth feature:
(a) We only considered the very dark pixels (these
are clearly defects, and there is not confusion with
the deviated sides); (b) Searching for a depth level
that was representative, we considered as maximum
depth level the maximum depth with at least X dark
pixels. That is, we were looking for big deep areas.
We tested in our research several different values for
X: 10, 25, 50, 100, 150, 175, 200,… Figure 6 shows
the results obtained.
As we can see, for the experiment detailed, the
best results were obtained in case of X = 200, that is,
the maximum depth must have at least 200 dark
pixels (error rate = 78%). This value is clearly an
inflection point in the graph.
An error rate of 78% improved our previous result
(80.28%) but it was still a bad result. For this reason,
a second set of experiments was made (figure 7). In
this case, we apply the inverse reasoning: we search
for a maximum depth with not a lot of pixels,
because it seems normal that there are not many very
deep defects in a cork stopper, and if many deep
defects exist maybe this can be a cluster of pixels
due to a cork side deviation and not due to defects.
Figure 7 presents the results obtained. Almost all the
experiments obtain the same result, an error rate of
66.28%.
Figure 6: First set of experiments with the maximum
depth.
This is the best result we have obtained with the
maximum depth feature. Observe that cork
classification is different from other classification
problems, such as character recognition: even a
human expert, sometimes, can not make a clear
decision about if a stopper/disk absolutely belongs to
a certain class or a contiguous one. Therefore, using
only one classification feature (the maximum depth)
and for this complex classification problem, an error
rate of 66.28% is an encouraging result.
Figure 7: Second set of experiments with the maximum
depth.
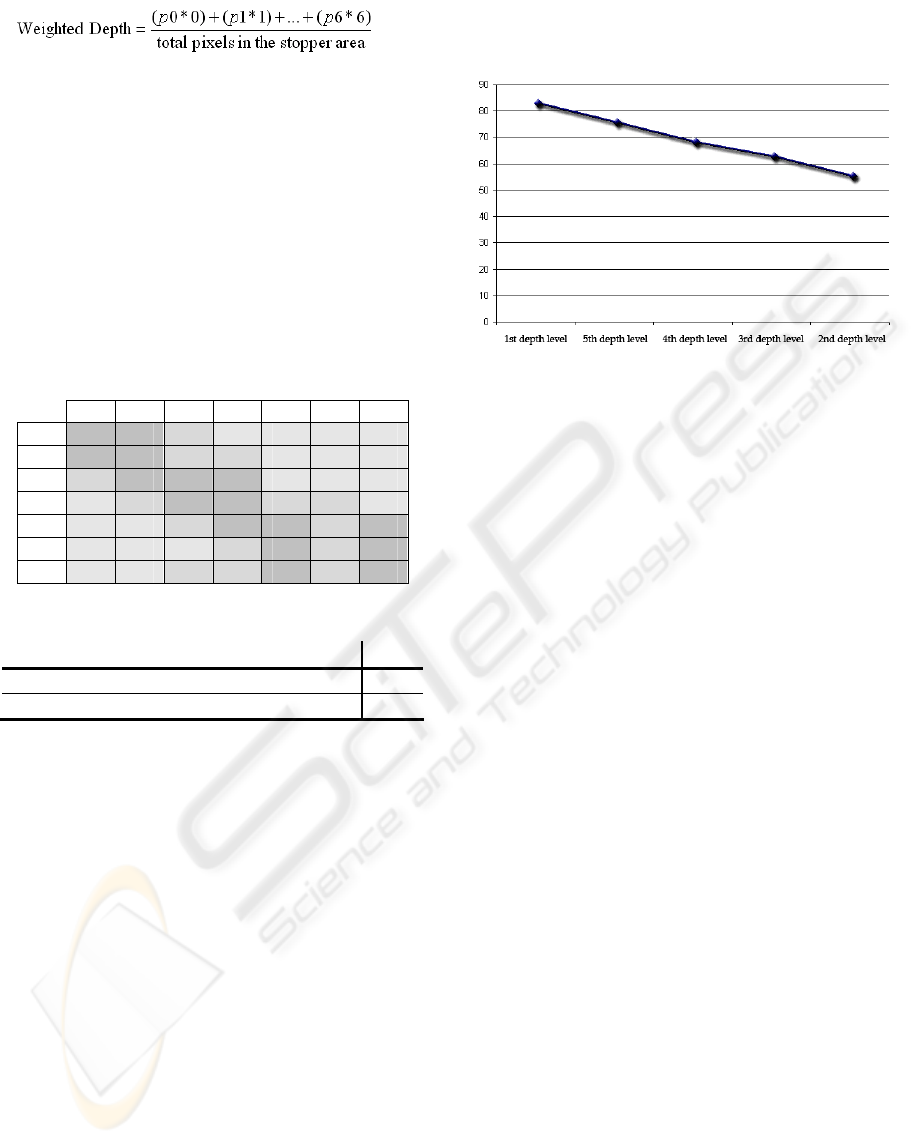
Regarding the weighted sum of the defects
according to their relative depth, we use equation 1.
For this 3D feature, we have divided the cork
stopper pixels in 7 different depth levels (from 0 to
6), being p
x
in the equation the amount of pixels in
the X depth level. Each level supposes a different
weight in the final sum (if the pixel is deeper, the
defect associated with this pixel will be more
serious). This feature was chosen in order to
consider the possible severity of cork defects. Thus,
the greater depth level is, the bigger the severity of
those defects is.
SIGMAP 2007 - International Conference on Signal Processing and Multimedia Applications
82
(1)
Table 3 shows the confusion matrix obtained by this
3D feature, while table 4 shows its final results. The
confusion matrix offers very good results. The
tendency towards the main diagonal is very clear,
except for class 5 due to the influence of classes 4
and 6. The error rate obtained with this feature is
51.14%. This result improves the results we have
obtained in previous works (Paniagua-Paniagua et
al, 2006a; Paniagua-Paniagua et al, 2006b), showing
the importance of using 3D features, and not only
2D features in the cork classification.
Table 3: Confusion matrix for the Weighted Depth.
C0 C1 C2 C3 C4 C5 C6
C0
35 14 1 0 0 0 0
C1
20 22 7 1 0 0 0
C2
1 10 29 10 0 0 0
C3
0 1 14 33 1 1 0
C4
0 0 1 12 22 4 11
C5
0 0 0 4 20 6 20
C6
0 0 1 4 13 8 24
Table 4: Final results for the Weighted Depth.
C0 C1 C2 C3 C4 C5 C6 TOT.
Right 35 22 29 33 22 6 24
171
Wrong 15 28 21 17 28 44 26
179
Finally, we evaluate the 3D feature that considers
the amount of defect pixels in a concrete depth level.
With this study we want to know if there is some
depth level among the defects that is more important
in order to obtain a good classification results. In
this case we study 5 different depth levels (from 1 to
5): level 0 is not studied because it has not a real
importance, being not a defect but the cork surface;
in the same way, depth level 6 is not considered
because there are not so much pixels for this level in
most 3D cork images. Figure 8 displays the final
results (error rates after doing a cork classification
only based on the defect pixels in a concrete depth
level).
Thanks to this study we have empirically proved
that the different depth levels have different
importance in cork quality classification. We can see
that the extreme levels (1 and 5) are the levels with
less importance (the worst classification results), and
that the defects with a medium depth are the most
important in the classification process. In particular,
the defect pixels in the second depth level are those
that have more importance, obtaining this feature the
best result (error rate = 55.42%).
Figure 8: Final results (error rates) for the depth levels
study.
5 CONCLUSIONS
The study in the 3D field has improved our cork
quality classification. We think this is because in this
field the extracted features can be more complex and
give more information about the cork quality that
those obtained in a 2D environment. After making a
deep study about different 3D cork quality features,
the obtained results are those displayed in figure 9.
Observe that all the 3D features have obtained
certain discriminatory information that improves the
cork classification according to its quality (all the
features obtain better results than the random
classification), although the goodness of the
obtained results widely varies. The best result is
produced by using the 3D feature “Weighted Depth”
(error rate = 51.14%). This result improves our
previous works (Paniagua-Paniagua et al, 2006a;
Paniagua-Paniagua et al, 2006b), where the best
error rate obtained was 65.71%, because of the
complex conditions of heterogeneity and
overlapping in this classification problem.
Moreover, our result even improves other related
works, in which the best error rate was 57.5%
(Chang et al, 1997). For all these reasons, the result
obtained in this research is a very encouraging
result. On the other hand, the 3D features offer us
new classification details that could not be perceived
with our previous 2D works.
USING 3D FEATURES TO EVALUATE CORK QUALITY
83
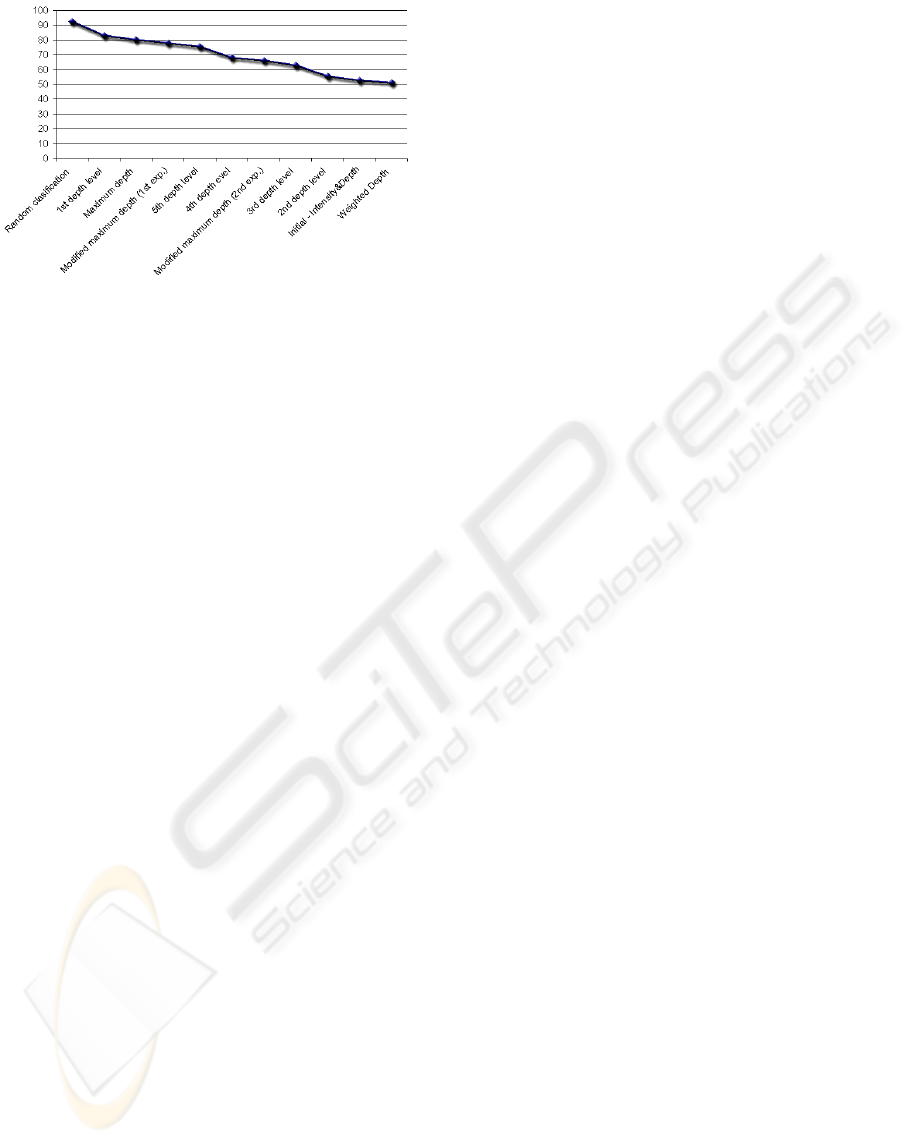
Figure 9: Summary of all the results (error rates) obtained
with this study of 3D features.
As future work, we will improve the performance
of the system (processing time) by using FPGAs
(Vega-Rodríguez et al, 2004), and we will extend
our research to other classification factors, as Gabor
Wavelets (Tang et al, 2003).
ACKNOWLEDGEMENTS
This work has been developed in part thanks to the
OPLINK project (TIN2005-08818-C04-03).
REFERENCES
ASECOR (Agrupación Sanvicenteña de Empresarios del
CORcho), 2006. Production statistics in the term 2006,
http://www.asecor.com.
Chang J., Han G., Valverde J. M., Griswold N. C., Duque-
Carrillo J. F., Sánchez-Sinencio E., 1997. Cork
Quality Classification System using a Unified Image
Processing and Fuzzy-Neural Network Methodology.
In IEEE Trans. on Neural Networks, 8(4), pp. 964-
974.
Paniagua-Paniagua B., Vega-Rodríguez M.A., Gómez-
Pulido J.A., Sánchez-Pérez J.M., 2006a. Comparative
Study of Second-Order Gray Level Texture Statistics
to Evaluate Cork Quality. In The 6th IASTED
International Conference on Visualization, Imaging,
and Image Processing, Palma de Mallorca, Spain pp.
447-452.
Paniagua-Paniagua B., Vega-Rodríguez M.A., Gómez-
Pulido J.A., Sánchez-Pérez J.M., 2006b. Comparative
Study of Thresholding Techniques to Evaluate Cork
Quality. In The 6th IASTED International Conference
on Visualization, Imaging, and Image Processing,
Palma de Mallorca, Spain pp. 441-446.
ShapeGrabber Inc., 2005a. ShapeGrabber CentralTM
Manual.
ShapeGrabber Inc., 2005b. ShapeGrabber Laser System
SG Series Manual.
Shapiro L.G., Stockman G.C., 2001. Computer Vision, Ed.
Prentice Hall, New Jersey.
Tang L., Tian L., Steward B.L., 2003. Classification of
Broadleaf and Grass Weeds Using Gabor Wavelets
and an Artificial Neural Network. In Transactions of
the American Society of Agricultural Engineers, vol.
46, no. 4, pp. 1247-1254.
Vega-Rodríguez M.A., Sánchez-Pérez J.M., Gómez-
Pulido J.A., 2004. Using Computer Vision and FPGAs
in the Cork Industry. In IEEE Mechatronics and
Robotics 2004, MechRob'04, Aachen, Germany, pp.
265-270.
SIGMAP 2007 - International Conference on Signal Processing and Multimedia Applications
84
