
A DISTRIBUTED VISION SYSTEM FOR BOAT TRAFFIC
MONITORING IN THE VENICE GRAND CANAL
D. Bloisi, L. Iocchi, G. R. Leone, R. Pigliacampo
Dip. di Informatica e Sistemistica, University of Rome ”La Sapienza”, via Salaria 113, Rome, Italy
L. Tombolini
ECOTEMA-Ingegneria per l’Ambiente srl, Cannaregio 463, Venice, Italy
L. Novelli
Archimedes, via Tagliamento 9, Rome, Italy
Keywords:
Motion detection and Tracking, Distribuited surveillance, Boat traffic monitoring.
Abstract:
In this paper we describe a system for boat traffic monitoring that has been realized for analyzing and com-
puting statistics of trafic in the Grand Canal in Venice. The system is based on a set of survey cells to monitor
about 6 Km of canal. Each survey cell contains three cameras oriented in three directions and covering about
250-300 meters of the canal. This paper presents the segmentation and tracking phases that are used to detect
and track boats in the channel and experimental evaluation of the system showing the effectiveness of the
approach in the required tasks.
1 INTRODUCTION
Wave motion has been recognized as one of the ma-
jor causes of damage to the basement structures of
historical buildings in Venice since the early 1960’s,
with the increase in boat mass and speed consequent
to the diffusion of large diesel engines. Since then, the
Venetian Municipal Authorities have been involved
in defining rules and tradeoffs suitable for the need
of mobility of goods, inhabitants and tourists on one
hand, and the need of preservation of historical her-
itage on the other hand. Measures such as speed limits
and strict traffic behavior rules, though, were proven
to be only partly effective, due to the lack of continu-
ous and autonomous traffic monitoring systems.
In the 1990’s the public water-bus fleet was
equipped with GPS satellite receivers and a first rough
speed and trajectory monitoring system was put in
place. In the years 2004-2005 a modern wide-range
general fleet control system (SALOMON) was built
up. The major feature of this system is the ability of
the on-board equipment to define an extremely accu-
rate boat position while holding a complete map of the
city waterways with their related speed limits; in this
way, the speed detected by the on-board Differential
GPS receiver is immediately compared with the rele-
vant speed limit and a signal is immediately issued to
the boat driver in case of infringement. SALOMON
system was proven to be very effective and precise;
however, because of the need of a permanent install-
ment of the intelligent navigation unit on the boats,
its use is currently limited to the major resident fleets
only.
In early 2006, the Municipal Administration
launched the ARGOS project (Automatic Remote
Grand Canal Observation System) for boat traffic
monitoring, measurement and management along the
Grand Canal of Venice based on automated vision
techniques. This new system will answer to the spe-
cific requirements for the boat navigation rules in
Venice while providing a combined unified view of
the whole Grand Canal waterway. Such features far
exceed the performance of any commercially avail-
able product. Therefore, a specific software has to
be developed, based on the integration of advanced
automated image analysis techniques. The ARGOS
system will provide a unified man-machine interface
both for the data detected through automatic vision
and the ones detected by the former GPS-based sys-
tems. In turn, the precise GPS positioning data pro-
duced by the boats equipped with SALOMON naviga-
tion units will be used for ARGOS cameras automatic
549
Bloisi D., Iocchi L., R. Leone G., Pigliacampo R., Tombolini L. and Novelli L. (2007).
A DISTRIBUTED VISION SYSTEM FOR BOAT TRAFFIC MONITORING IN THE VENICE GRAND CANAL.
In Proceedings of the Second International Conference on Computer Vision Theory and Applications - IU/MTSV, pages 549-556
Copyright
c
SciTePress
geometric calibration.
In this paper we describe the implementation of
the computer vision based system that allows for de-
tecting and tracking the boats in the canal. After a
brief overview of the ARGOS project given in Sec-
tion 2, we will describe Segmentation and Tracking
processes in Sections 3 and 4. Section 5 describes
some applications of the described modules and ex-
perimental evaluation of the system performance.
2 PROJECT OVERVIEW
The ARGOS system is going to control a waterway of
about 6 km length, 80 to 150 meters width, through
some observation posts (Survey Cells). The system
is based on the use of groups of IR/VIS cameras, in-
stalled just below the roof of several buildings lean-
ing over the Grand Canal (a first prototype of a sur-
vey cell is visible in Figure 1) . Detected images
will be rectified and stitched together so as to gen-
erate a composite plain view, similar to a radar im-
age. Each survey cell is composed of 3 optical sen-
sors: one center wide-angle (90 degree), orthogonal
to the navigation axis, and two side deep-field cam-
eras (50-60 degree). The resulting overall view field
along the waterway could stretch over 250-300 me-
ters end-to-end. The three cameras are connected to a
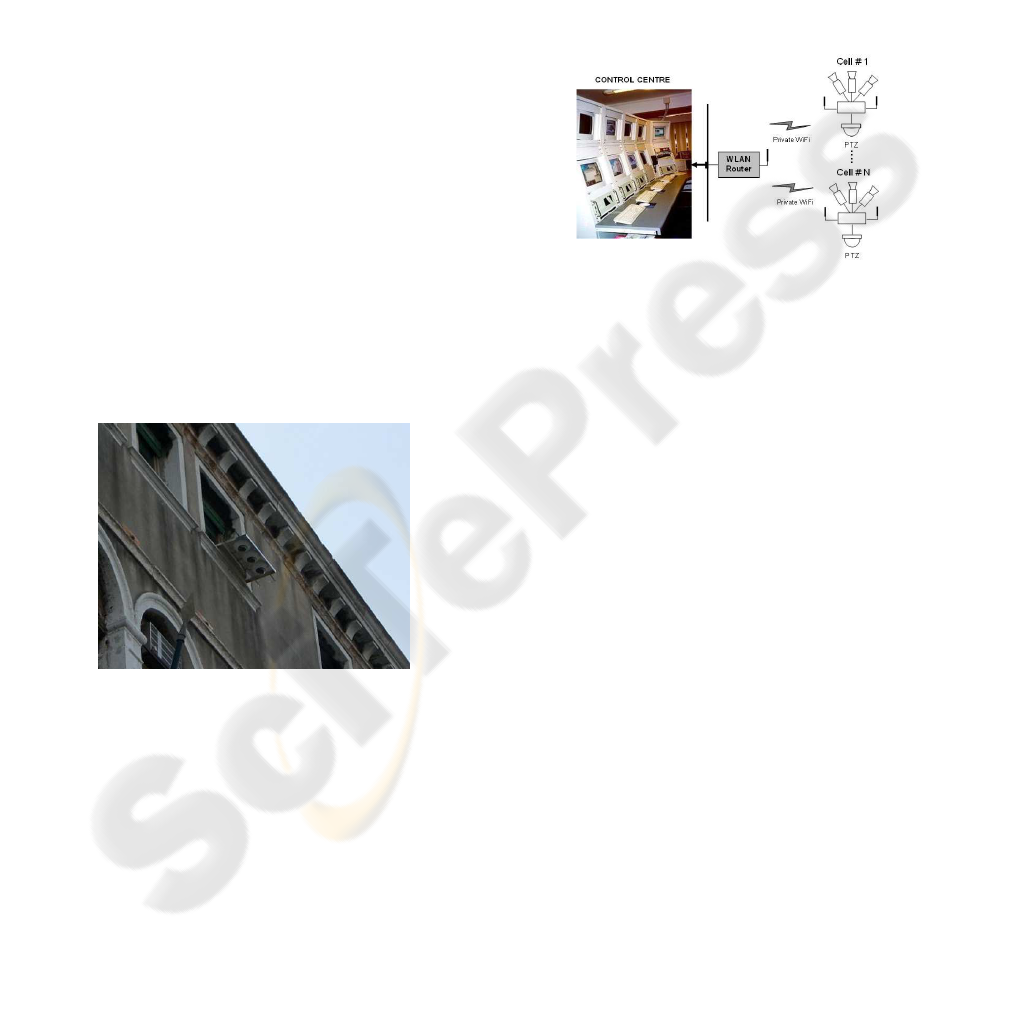
Figure 1: The survey cells are installed on the top of several
buildings leaning over the Grand Canal.
local computer where images are processed through
a two-level analysis software: a module for image
re-sampling, rectification and stitching of contiguous
images which, in turn, feeds a second software layer
capable of detecting moving targets, delimiting them,
finding their geometrical center and filtering the time
and position data by means of tracking algorithms to
compute position, speed and direction of each tar-
get. The fields of view of each camera shall slightly
overlap so as to allow the software to continuously
follow and track the motion of each target through
the whole composite view field of the survey cell,
keeping each target labelled by a unique identifier
(Track ID). Each survey cell is also equipped with a
pan-tilt-zoom (PTZ) camera, for the automatic high-
resolution tracking of selected targets. Due to the im-
possibility of wiring the survey cells together, all the
system data traffic shall be conveyed through a private
radio channel. As this channel has a limited band-
width, most of the computation load shall be borne by
the survey cells themselves. The system has to be de-
signed for 24/7 all-weather day-night operation. The
global system architecture is depicted in Figure 2.
Figure 2: All the system data traffic shall be conveyed
trough a private radio channel.
The main ARGOS functions are: 1) Optical de-
tection and tracking of moving targets present in the
FOV; 2) Computing position, speed and heading of
any moving target within the FOV of each camera;
3) Elaboration at survey cell level of any event (tar-
get appears, exits, stops, starts within the cells FOV)
and transmission of any event to the Control Cen-
ter; 4) Connecting all the track segments related to
the same target in the different cameras FOV into a
unique trajectory and track ID; 5) Recording all the
video frames together with the graphical information
related to track IDs and trajectories; 6) Rectifying all
the camera frames and stitching them into a compos-
ite plain image so as to show a plan view of the whole
Grand Canal; 7) Allowing the operator to graphically
select any target detected by the system and automat-
ically activating the nearest PTZ camera to track the
selected target.
In order to achieve ARGOS objectives we de-
signed and developed a computer vision software
which is a pipeline of image analysis and tracking
techniques: we apply background subtraction and op-
tical flow to the streams coming from the cameras to
obtain observations (i.e., to detect the part of the im-
age where the boats are); this information (position,
dimension, versus, and velocity of a boat) is used by
a set of Kalman Filters to track the targets over time.
The next two sections explain our approach in de-
tails.
3 SEGMENTATION
Our goal is to detect the moving targets in the sce-
nario (the boats): given a frame sequence from a
fixed camera, we have to detect the zones of the
images representing all the objects that are passing
through. A common and effective technique to do
that is called background subtraction. The back-
ground image is not fixed but must adapt to: grad-
ual illumination changes and sudden ones (such as
clouds), motion changes (camera oscillations), high
frequency background objects (waves in our case),
changes in the background geometry (such as parked
boats). A simple way to build the background is to
assign to a pixel the mean of all correspective ones
in a set of images. But this method does not work
well with illumination changes. Different methods
for background modelling, updating and subtraction
have been proposed. Two classification directions
can be identified: how the background is modeled,
how the model is updated. Statistical models have
been widely used: either in the form of single Gaus-
sians (Wren et al., 1997; Jabri et al., 2000) or mix-
ture of Gaussians (Stauffer and Grimson, 2000; El-
gammal et al., 2000), but also other models (median
(Cucchiara et al., 2003), minimum-maximum values
(Haritaoglu et al., 2000), etc.) proved effective. The
choice of the model mostly depends on the kind of
scenario in which the application runs.
In our case single Gaussian models are not ade-
quate because we deal with outdoor environment with
fluctuating background. This means that the distrib-
ution concerning a certain pixel often has more than
one peak. So our approach is based on a mixture of
Gaussians. The system computes the bar chart for
every pixel (i.e., the approximation of the distribu-
tion) in the RGB color space and it clusters the raw
data in sets based on distance in the color space. In
order to save computational time, only the two bigger
clusters are considered. If cardinality of the clusters
are comparable, both the values are recorded, other-
wise only the dominant one is considered. This solu-
tion allows for balancing efficiency with the need of
representing fluctuations in the background.
When two boats are very near it is common to
have an error called under segmentation due to the
perspective of the camera view: the foreground im-
age has only one bigger blob instead of two or more.
To improve the detection in this situation we consider
also the optical flow which correlates two consecu-
tive frames. Every feature which is present in both
the frames has a motion vector (direction,versus and
value) which is not null if the position in the two
frames is different. Optical flow is a good approxi-
mation of the motion over time in image coordinates.
The system considers two directions for the central
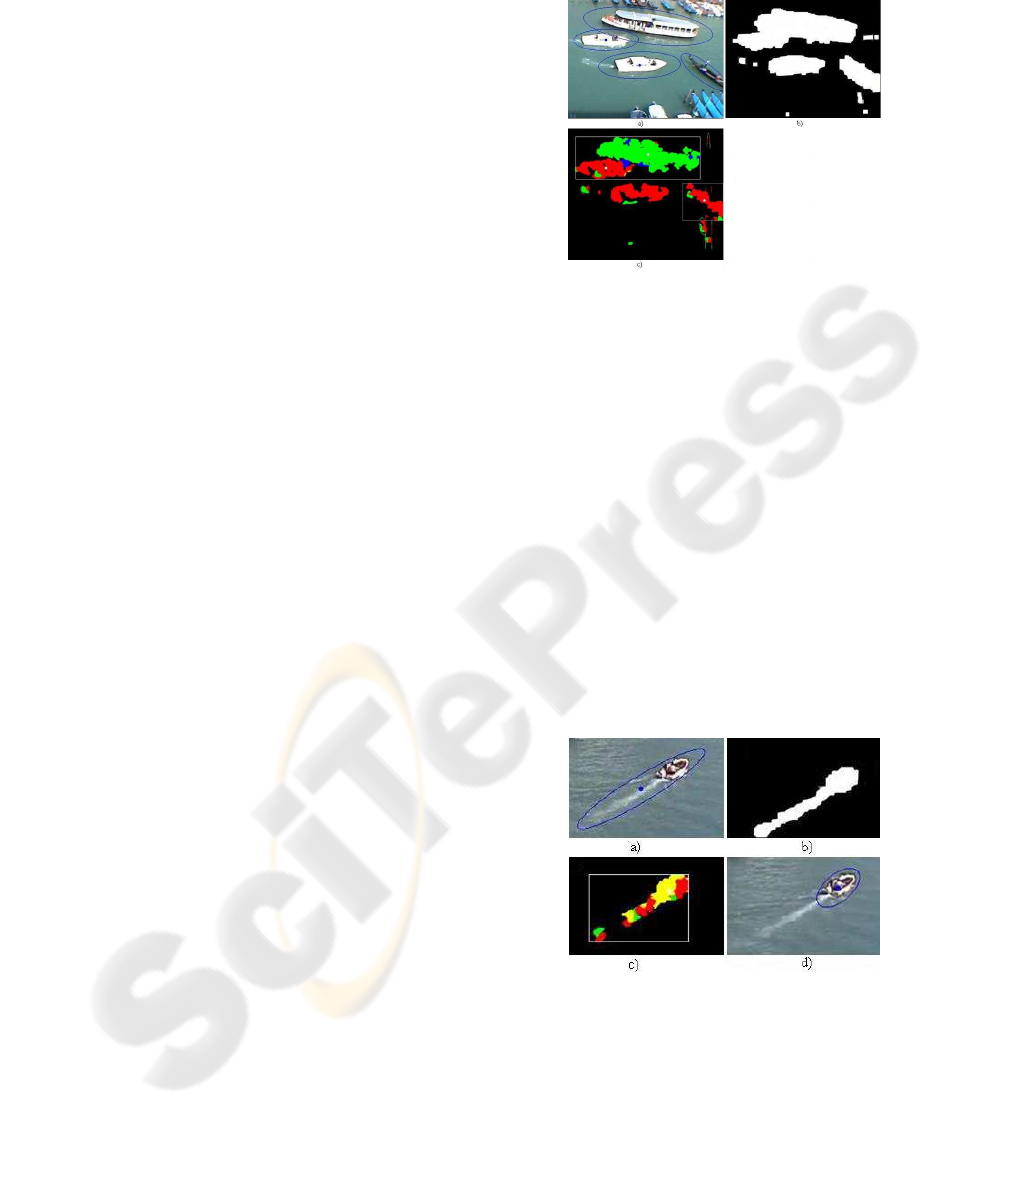
Figure 3: An example of under-segmentation: a) there are
four boats in the scene but b) the system detects three blobs.
c) Using optical flow the system understands the different
directions of the boats and a) gives correct ellipses detec-
tions.
camera (left to right and right to left) and four di-
rections for the left and right cameras (because the
perspective is not orthogonal) A typical example of
under-segmentation correctly solved with optical flow
is showed in Figure 3. Optical flow is often useful
also when we have a single boat with a long wake on
the back. Figure 4-b shows another typical segmen-
tation error: the dimension of the boat is estimated
more than double than the real one. Using optical
flow (Figure 4-c) the system detects a big yellow blob
that corresponds to the boat and other little ones in
different directions which are the water waves. Also
in this case optical flow provides a correct detection
(Figure 4-d)
Figure 4: Example of wrong segmentation caused by water
waves: b) The blob in the foreground image is much bigger
than the real boat and a) the system gives a wrong detection
result but c) using optical flow the system distinguishes the
boat from the waves and d) we obtain the correct detection.
However, this approach fails when a boat is in-
volved in particular maneuvers. For example, when
a boat turns around itself, the optical flow may detect
different directions for the different parts of the boat

(e.g., one for the prow and another for the stern) and
discard (for some frames) detection of such a target.
Moreover, it is not useful when boats travel close by
in the same direction. From an analysis of the per-
formance of the segmentation process on many live
video streams from our application scenario, we have
evaluated that situations where optical flow worsen
the performance of the segmentation process are very
limited, with respect to the advantages in refining seg-
mentation when two boats moving in different direc-
tions come close and in presence of long waves after
the tracked boat. In summary, the algorithm used for
image segmentation consists of the following steps:
Background formation: a set S of n frames is used to
build the background image B which represents only
the static (i.e. non-moving) part of the scenario. This
procedure is done continuously to adapt to the sce-
nario’s changes. Foreground computation: the dif-
ference between the current image I from the camera
and the B image of the background gives the fore-
ground image F. This image is a binary image and
contains only elements which are not in the back-
ground (new elements in the scenario); an example is
Figure 3-b). Blob formation: the binary image B is
analyzed in order to find connected components (i.e.,
blobs). Optical flow refining: for every detected blob
optical flow is computed. If there is only one domi-
nant moving direction (more than 70%) the blob is
confirmed, otherwise the blob is split in the different
directions detected. In addition, optical flow is used
to eliminate wave noise. Ellipse approximation: el-
lipses calculated on the size of the blobs represent an
approximation of the boats detected. The centroids of
the ellipses are used to track the boats over time (see
Section 4).
4 MULTI-HYPOTHESIS KALMAN
FILTER TRACKING
An optimal recursive data processing algorithm for
tracking moving targets over time is the Kalman Fil-
ter (Welch and Bishop, 2004; Maybeck, 1979). Such
a filter represents an efficient solution to the gen-
eral problem of estimating the state of a discrete-time
controlled process. When developing a multi-object
tracking method, one usually has to deal with track
initiation, track update including prediction and data
association and track deletion. The process is di-
vided into two fundamental steps: association: as-
signment of each incoming observation to a specific
target track; estimate: the receivedobservationis used
to provide a state estimate of the associated track.
Each time a new observation is received, it must be
associated to the correct track among the set of the
existing tracks, or, if it represents a new target, a
new track must be created. Thus, the tracking sys-
tem needs some mechanisms of Data Association and
tracks management (see (Hall and Llinas, 2001)).
This is a single hypothesis approach which means that
at all times an observation is associated to only one
of the existing tracks. If a wrong association hap-
pens (i.e. an observation is associated to a wrong
track) the system cannot recover from this error. In
our case, especially when we have a very crowded
scene, it is not straightforward to assign an observa-
tion to a certain track. For this reason we use a multi-
hypothesis Kalman filter tracking system. Every time
there is an observation that could be assigned to more
than one track the system considers the two hypothe-
ses for every candidate track (i.e. every track is di-
vided in two new ones). This is called track split.
This technique leads to the proliferation of the num-
ber of tracks and we need to detect and delete redun-
dant track (track merging. In the next paragraph we
illustrate with more details the single and multi hy-
pothesis tracking phases.
4.1 Single Hypothesis Tracking
4.1.1 Data Association
The technique used for the data association is the
Nearest Neighbor rule. When a new observation is
received, all existing tracks are projected forward to
the time of the new measurement. Then the observa-
tion is assigned to the nearest such estimate.
More generally, the distance calculation is computed
to reflect the relative uncertainties (covariances) as-
sociated with each track and observation. The most
widely used measure of the correlation between two
mean and covariance pair {x
1
,P
1
} and {x
2
,P
2
},
which are assumed to be Gaussian-distributed random
variables, is:
P
ass
(x
1
,x
2
) =
exp(−
1
2
(x
1
− x
2
)(P
1
+ P
2
)
−1
(x
1
− x
2
)
T
)
p
2π | (P
1
+ P
2
) |
(1)
If this quantity is above a given threshold, the two
estimates are considered to be feasibly correlated.
An observation is assigned to the track with which
it has the highest association ranking. In this way, a
multiple-target problem can be decomposed into a set
of single-target problems.
4.1.2 Track Formation
The nearest-neighbor rule is very simple and intu-
itive, but presents some difficulties. A first problem is
in creating initial tracks for multiple targets, because
some components of the vector state are not directly
measurable. In the case of a single target, two ob-
servations can be accumulated to derive an estimate
of such components. For multiple target, there is no
obvious way to deduce such initial values: the first
two observations could represent successive position
of a single object or the initial detection of two dis-
tinct objects. Every subsequent observation could be
the continuation of a known track or the start of a new
one.
So when a new observation is obtained, if it is not
highly correlated with an existing track, a new track is
created and a new Kalman filter is initialized with the
position (x,y) observed and given to all the not ob-
served components (e.g., velocity) a null value with
a relatively high covariance. If the subsequent ob-
servations confirm the track existence, the filter will
converge to the real state.
4.1.3 Track Deletion
In many cases, some objects are not observed for a
while, with the uncertainty in the state estimate in-
creasing. Moreover the presence of noisy sensors can
determine spurious observations, which give rise to
spurious tracks. Thus, the tracking system needs an
additional mechanism to recognize and delete tracks
that do not receive any subsequent confirming obser-
vations.
We have considered, as indicative measure of the un-
certainty in the state estimate of each target, the filter’
s gain relative to the track:
K
t
= P
−
t
H
T
(HP
−
t
H
T
+ R)
−1
(2)
and experimentally established a threshold for the
track deletion: if the received observations do not
confirm a certain track for a period of time, the gain
value grows exceeding the threshold and the track is
deleted.
4.2 Multi Hypothesis Tracking
4.2.1 Track Splitting
When two objects are sufficiently close together, the
observations are highly correlated with more than one
track. In these cases a misassignment can cause the
Kalman-filtering process to converge very slowly, or
fail to converge altogether. Moreover, tracks updated
with misassigned observations (or not updated at all)
will tend to correlate poorly with subsequent obser-
vations and may, therefore, be mistaken as spurious
by the track deletion mechanism; mistakenly deleted
tracks then necessitate subsequent track initiation and
a possible repetition of the process.
The choice of a multi-hypothesis tracking has been
made to give a solution to the problem of assignment
ambiguity: when the correct association is not
known, more association hypothesis are created. The
new observation received is used to update all the
tracks with which it has a probability association
that exceeds the threshold value. A copy of the not
updated track is also maintained (track splitting).
Subsequent observations can be used to determine
which assignment is correct.
4.2.2 Track Merging
One important issue of the track splitting technique
is a proliferation in the number of tracks. Because
track splitting does not decompose multiple-target
tracking into independent single-target problems, the
deletion mechanism described in section 4.1.3 is not
sufficient. For example, two hypothesis tracks may
lock onto the trajectory of a single object; because
both tracks are valid, the standard track-deletion
mechanism cannot eliminate either of them.
The deletion procedure has to be modified to detect
redundant tracks and, therefore, cannot look at just
one track at a time. At each step, for each track
the correlation with all the other tracks is calculated
using equation (1). If the association probability be-
tween two tracks exceeds a threshold (experimentally
established), one of the two tracks is deleted, keeping
only the most significant hypothesis.
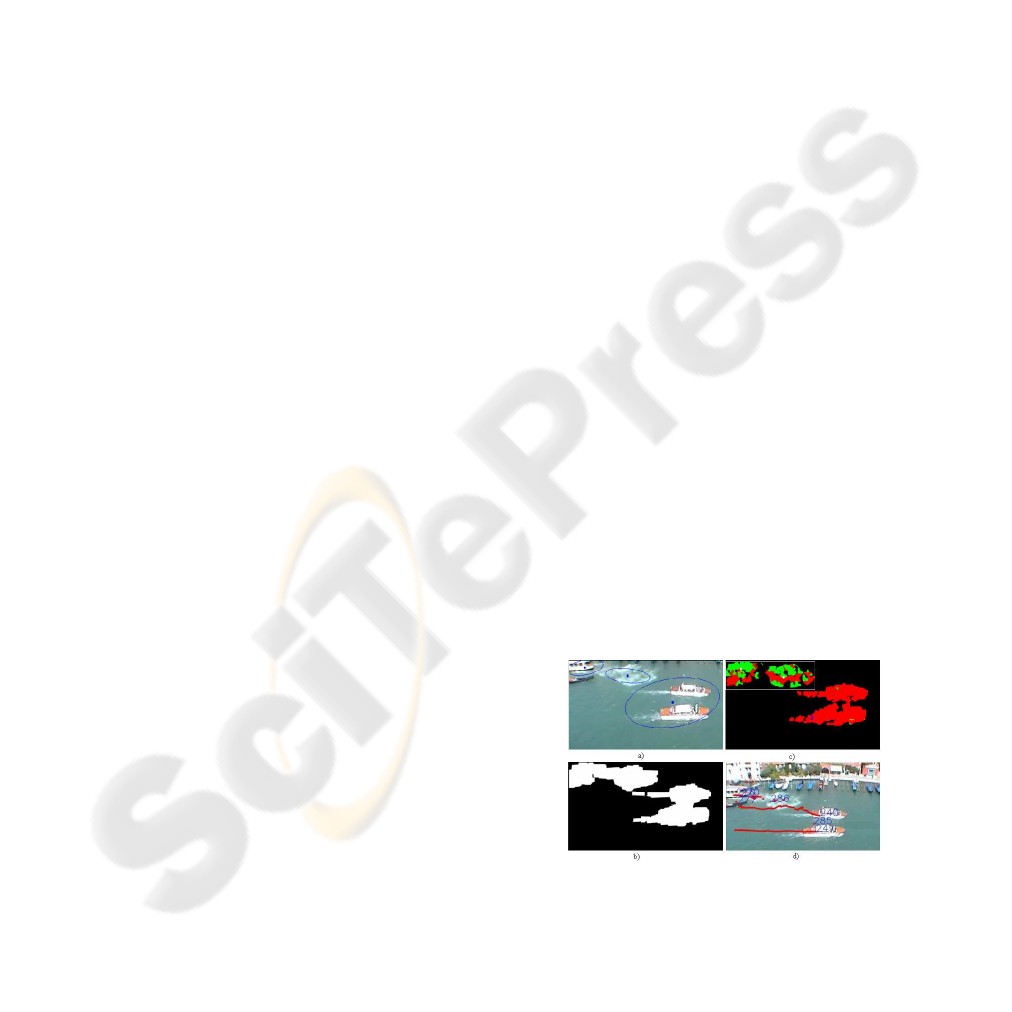
Figure 5: a)Two boats very near are detected as one be-
cause there is a b)Foreground under segmentation error and
c)Optical flow does not solve the problem but d)With the
multi-hypothesis method the system continues to track the
boats separated over time.
A successful example of this tracking method is
shown in Figure 5: when two boats are very near
they are detected as one (ellipse in Figure 5-a) be-
cause there is a foreground under segmentation error
(Figure 5-b) and also the optical flow does not solve
the problem because the boats go in the same direc-
tion(Figure 5-c). Thanks to the multi-hypothesis ap-
proach the system considers the wrong observation
as a new track but it continues to track over time
the former two because of the history of the obser-
vations(Figure 5-d).
5 APPLICATION AND RESULTS
In order to make available all the information gath-
ered by the system in a useful way for the Venice Mu-
nicipal Authorities, we have developed different visu-
alizations of the results of the system.
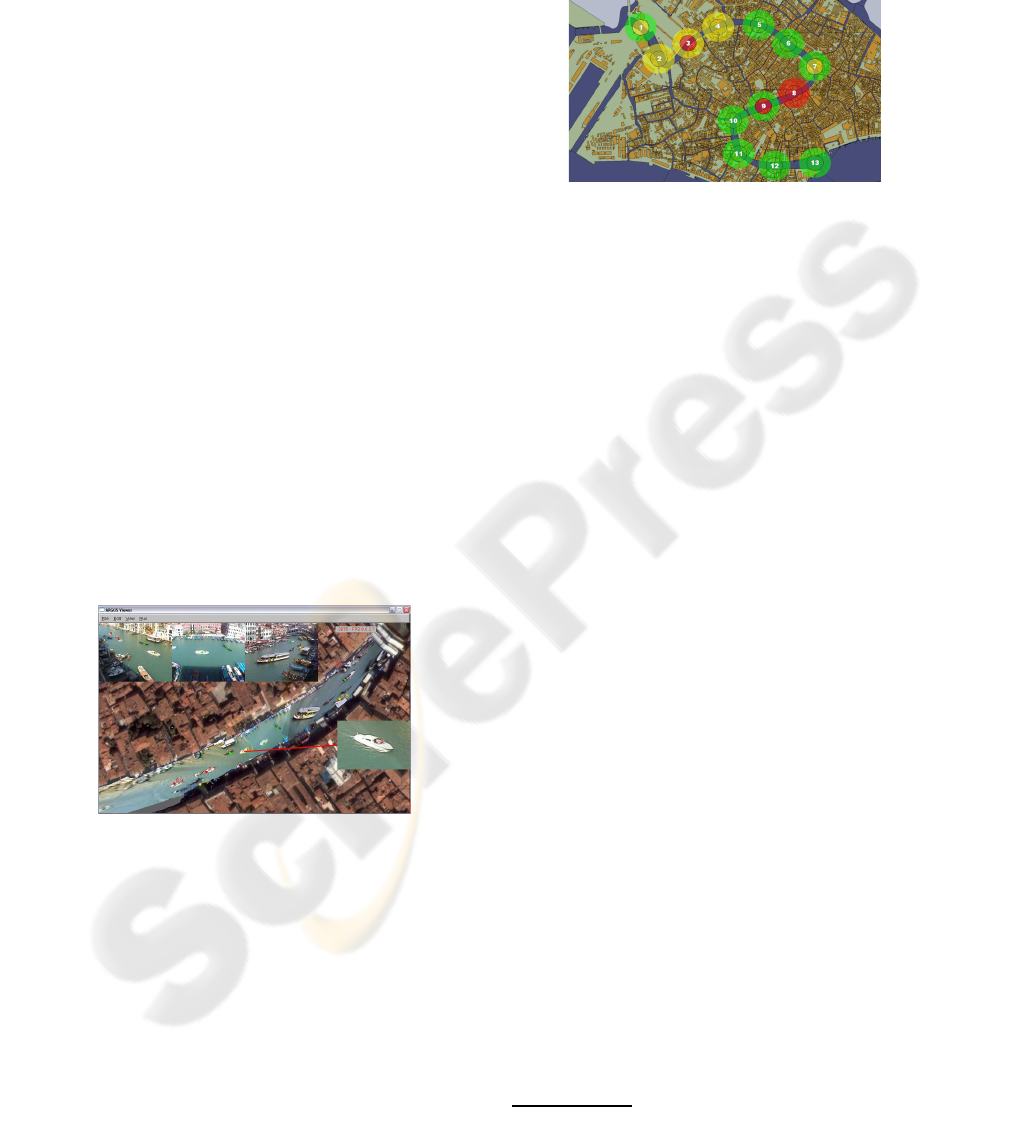
The main control windowshowsa live global view
of the Grand Canal, integrating a GIS map with live
information about position and velocity of the boats
currently in the canal (see Figure 6). More specifi-
cally, we plot a colored dot in the current map location
of each target with associated a few smaller dots rep-
resenting its recent track. The color denotes the speed
of the vehicle and other icons may appear close by to
indicate specific events (such as, moving in a wrong
way, stopping in a forbidden area, etc.) In addition,
flow and density analysis are performed and displayed
in order to have a global view of the traffic present in
the canal at every time (example in Figure 7).
Figure 6: The main control window shows a live global
view of the Grand Canal with live information about po-
sition and velocity of the boats currently in the canal.
The relevant information that must be extracted to
achieve the functionalities described above can be di-
vided in two groups: statistics measures and event de-
tection.
The first kind of information is necessary to con-
tinuously monitor the traffic in the Canal. In particu-
lar, we want to calculate the traffic of boats moving in
each direction for each survey-cell at different times
of the day, as well as the boat density in the differ-
ent areas of the Canal. To this end track analysis has
been performed in order to compute the quantities of
interest. For example, for computing the flow of boats
passing within the area monitored by a survey cell we
can define two virtual lines in the Canal and count the
number of boats (i.e., tracks) passing these lines.
Figure 7: Density analysis are performed and displayed in
order to have a global view of the traffic present in the canal
at every time.
Another important measure is the velocity of the
boats, since this is the main cause of wave motion
that has been recognized as one of the major causes of
damage to the basement structures of historical build-
ings in Venice. The velocity is computed by analysis
of the world coordinates of the tracks: in particular to
increase robustness to noise we compute the length of
the path done in the last n frames (e.g., n = 10) as the
sum of the distances between consecutive points and
divide this value for the time duration of the path.
As for event detection, the main situations that
must be automatically detected are: speed limits, i.e.,
detecting boats going at a velocity greater than a given
threshold; parallel travel, i.e., detecting boats that
move parallel and close each other for long time
1
;
wrong directions, i.e., detecting boats moving in the
wrong direction in one-way pieces of the Canal; for-
bidden stops, i.e., detecting boats stopping in forbid-
den areas.
Event detection is again based on specific analysis
of the determined tracks. Speed limit is checked using
two thresholds (that have been fixed to 5 Km/h and 7
Km/h) and each target is labeled with a color: green
for speed below 5 Km/h, yellow for speed between
5 and 7 Km/h and red for speed above 7 Km/h. The
visualization of colored dots in the GIS map makes
it possible to quickly detect speed limit violations.
Moreover, the system automatically records the tracks
moving at a velocity above 7 Km/h for some time, al-
lowing for subsequent analysis and post-processing.
Parallel travel is detected by track analysis, in which
we first detect parallel motion (by projecting the po-
sition of one boat to the direction line of the other)
and then computing the distance between the two di-
rection lines. A pair of parallel boats that maintain
this distance below a given threshold for more than a
1
This is currently forbidden by Municipal Authorities.
given amount of time will generate an automatic alert.
Also in this case automatic recording will allow sub-
sequent analysis. Finally, the other eventsare detected
by defining zones in the canal that activate the corre-
sponding checking procedures: for wrong direction
we simply check that boats move in the right direc-
tion, for stops detection we monitor the time in which
a boat remains within a limited area.
5.1 Performance Evaluation
The performance results reported here refer to the ca-
pability of the system to provide accurate traffic sta-
tistics and event detection. It is important to notice
that, although one goal of the project is to achievebest
performance in associating a single track to each boat
(i.e., avoiding track splitting) for its entire presence
in the monitored area, statistics and events described
above do not strictly require such a property. It is in-
deed sufficient that the boat is continuously tracked
over short periods of time. Consequently, the follow-
ing evaluation tests have been performed to measure
the performance of the system in counting and short-
term tracking of passing boats.
All the tests have been executed with the same
configuration of the software (i.e., with no specific
optimization for a given functionality) on real images
taken from a survey cell installed in Venice. The tests
have been executed on long sequences of recorded
videos that have been taken at the same frame rate
of the software (about 5 fps).
Counting evaluation test. The first evaluation test
has been set as follows. A virtual line has been put
across the Canal in the field of view of a survey
cell, the number of boats passing this line has been
counted automatically by the system ˆn, and the same
value is manually calculated by visually inspection
n, the average percentage error is then computed as
ε = | ˆn− n|/n. This error measures the general perfor-
mance of the system, and it is useful to determine the
general capabilities of the system of estimating traffic
flow. However, this measure does not capture exactly
all the errors made by the system. For example, if a
boat is counted twice and another one is not detected,
the error ε is zero. An additional error measure is then
calculated by considering the probability of making
an error in counting a single boat passing the line
P(e) =
1
n
n
∑
t=0
δ(
ˆ
f
t
− f
t
)
where δ(·) is 0 when the argument is 0 and 1 other-
wise.
This experiment has been performed with three
different videos of about 20 minutes each taken in dif-
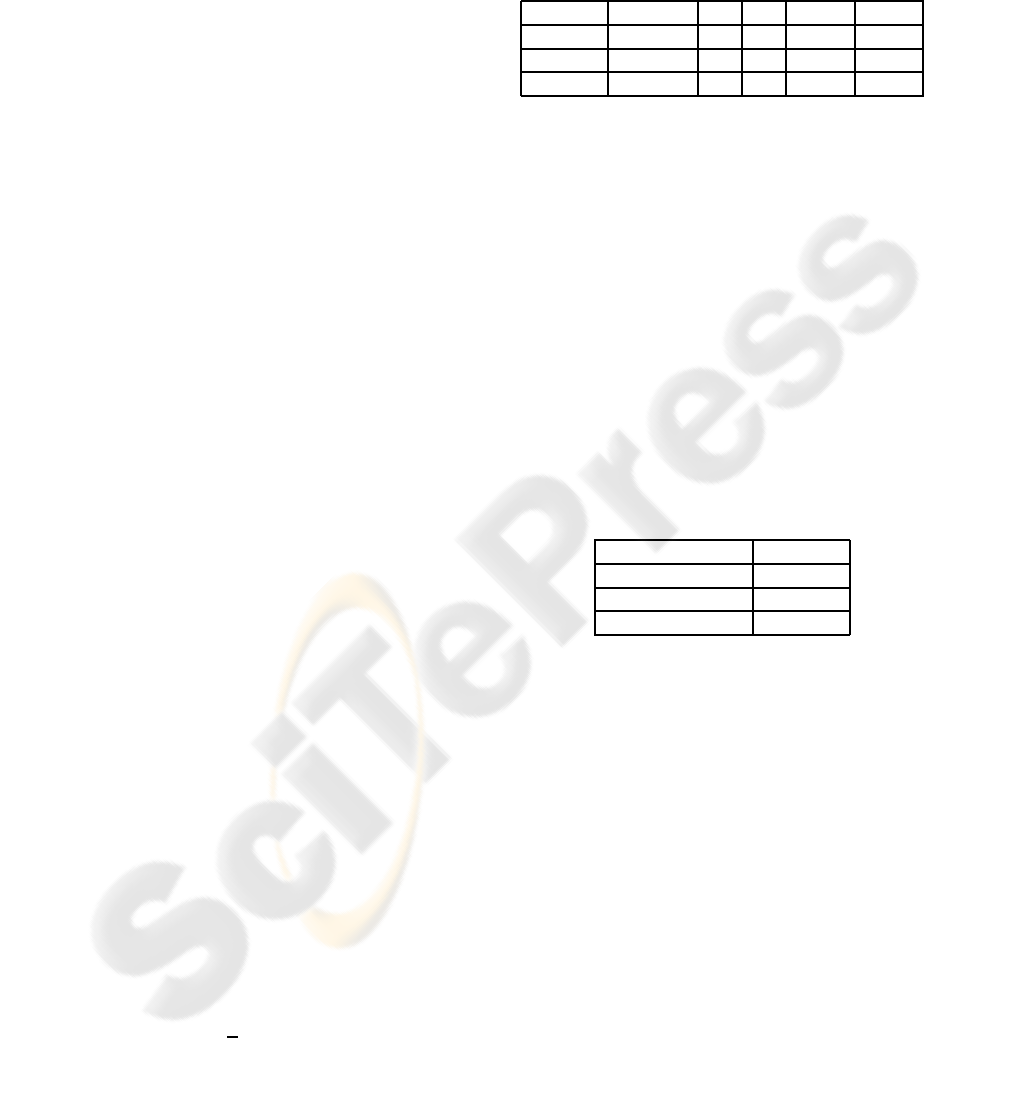
ferent days. The results are shown in Table 1.
Table 1: Counting errors.
duration n ˆn ε P(e)
Video 1 32 min 90 95 0.055 0.144
Video 2 30 min 69 72 0.043 0.130
Video 3 25 min 62 67 0.081 0.129
Short-term tracking evaluation test . This test has
been performed in order to evaluate the ability of the
system to correctly perform short-term tracking, i.e.
to maintain the same identifier to each target within a
limited amount of time. To this end we have defined
two passing lines in different places in the canal and
measured the consistency of the tracks. More specif-
ically, we denote with n the number of boats passing
through the two lines and with c the number of boats
that have the same id between the first and the second
line. Thus c/n represents the accuracy in short-term
tracking. We repeated the experiment several times
with different situations (single boat, two boats going
in the same direction and two boats going in opposite
direction). The results are shown in Table 2.
Table 2: Short-term tracking accuracy.
accuracy
Single boat 0.88
2 boats same dir. 0.75
2 boats opp. dir. 0.72
In addition to the quantitative test above, we have
performed qualitative tests. The live rectification of
the perspective images in an integrated view (see Fig-
ure 6) allows to visually monitor all the area dedi-
cated to a survey cell. The display of dots associated
to tracked boats on top of the live rectified image al-
lows for a comprehensive and augmented view that
has proven to be very useful to the operators in the
Municipal Control Center. Finally, automatic regis-
tration of events and image storage and retrieval facil-
ities allows for subsequent analysis and for effective
monitoring of the canal.
6 CONCLUSION
In this paper we have presented an implemented sys-
tem for distributed monitoring and analysis of boat
traffic in the Grand Canal of Venice. The system
is mainly based on two processes: segmentation and

tracking that computes tracks associated to the boats
moving in the waterway. The characteristics of these
processing modules are: robust and efficient segmen-
tation that uses up to two Gaussians for modelling
the background and optical flow to reduce segmenta-
tion errors; multi-hypothesis tracker based on Nearest
Neighbors data association and Kalman filters.
The system has proven to be effective in perform-
ing the tasks of monitoring and traffic analysis, as re-
ported by experimental results. Additional evaluation
will be performed in order to provide additional ex-
perimental evidence of the performance of the system
as well as to improve its performance.
ACKNOWLEDGEMENTS
The project has been realized thanks to the view of the
future and to the active participation of the City Coun-
cil of Venice. In particular, special thanks to Lord
Vice-Major of Venice, On. Michele Vianello, for his
foresight in applying innovative technologies in the
delicate and complex historical city as Venice. We
are also grateful to the Responsible Manager Arch.
Manuele Medoro and his staff for their constant sup-
port and commitment.
REFERENCES
Cucchiara, R., Grana, C., Piccardi, M., and Prati, A. (2003).
Detecting moving objects, ghosts, and shadows in
video streams. IEEE Transactions on Pattern Analysis
and Machine Intelligence, 25(10):1337–1342.
Elgammal, A. M., Harwood, D., and Davis, L. S. (2000).
Non-parametric model for background subtraction. In
Proc. of the 6th European Conference on Computer
(ECCV), pages 751–767, London, UK. Springer-
Verlag.
Hall, D. L. and Llinas, J. (2001). Handbook for multisensor
data fusion (Electrical engineering and applied signal
processing). CRC Press LLC.
Haritaoglu, I., Harwood, D., and Davis, L. S. (2000). W4:
Real-time surveillance of people and their activities.
IEEE Transactions on Pattern Analysis and Machine
Intelligence, 22(8).
Jabri, S., Duric, Z., Wechsler, H., and Rosenfeld, A. (2000).
Detection and location of people in video images us-
ing adaptive fusion of color and edge information.
In Proc. of 15th International Conference on Pattern
Recognition (ICPR’00), 4:4627.
Maybeck, P. S. (1979). Stochastic models, estimation and
control. vol I. ACADEMIC PRESS.
Stauffer, C. and Grimson, W. E. L. (2000). Learning
patterns of activity using real-time tracking. IEEE
Trans. on Pattern Analysis and Machine Intelligence,
22(8):747–757.
Welch, G. and Bishop, G. (2004). An introduction to the
kalman filter. Technical report, University of North
Carolina at Chapel Hill, NC 27599-3175.
Wren, C. R., Azarbayejani, A., Darrell, T., and Pentland,
A. (1997). Pfinder: Real-time tracking of the human
body. IEEE Trans. on Pattern Analysis and Machine
Intelligence, 19(7):780–785.
