
COLOR AND TEXTURE BASED SEGMENTATION
ALGORITHM FOR MULTICOLOR TEXTURED IMAGES
Irene Fondón, Carmen Serrano and Begoña Acha
University of Seville, Camino de los Descubrimientos s/n 41092, Seville, Spain
Keywords: Region-growing, segmentation, texture analysis, color segmentation.
Abstract: We propose a color-texture image segmentation algorithm based on multistep region growing. This
algorithm is able to deal with multicolored textures. Each of the colors in the texture to be segmented is
considered as reference color. In this algorithm color and texture information are extracted from the image
by the construction of color distances images, one for each reference color, and a texture energy image. The
color distance images are formed by calculating CIEDE2000 distance in the L
*
a
*
b
*
color space to the colors
that compound the multicolored texture. The texture energy image is extracted from some statistical
moments. The method segment the color information by means of an adaptative N-dimensional region
growing where N is the number of reference colors. The tolerance parameter is increased iteratively until an
optimum is found and its growth is determined by a step size which depends on the variance on each
distance image for the actual grown region. The criterium to decide which is the optimum value of the
tolerance parameter depends on the contrast along the edge of the region grown, choosing the one which
provides the region with the highest mean contrast in relation to the background. Additionally, this color
multistep region growing is texture-controlled, in the sense that an extra condition to include a particular
pixel in a region is demanded: the pixel needs to have the same texture as the rest of the pixels within the
region. Results prove that the proposed method works very well with general purpose images and
significantly improves the results obtained with other previously published algorithm (Fondón et al, 2006).
1 INTRODUCTION
In the literature there are many different region-
growing algorithms. Most of them applied to grey-
scale images and some of them extended to color
images. Hojjatoleslami and Kittler (Hojjatoleslami
and Kittler, 1998) presented a region-growing
method based on two different contrast measures but
it has a poor efficiency. Adams and Bischof (Adams
and Bishop, 1994) proposed a method for grey-scale
images, where the seeds are selected manually. The
method depends on the order in which the pixels are
analyzed. Fan et al.
(
Fan
et. al., 2001) extended the
previously mentioned technique to color images.
Then, they improved the algorithm selecting
automatically the seeds and proposed a new method
for pixel labeling (Fan
et. al., 2005). Cheng (Cheng,
2003) published a region-growing approach to color
segmentation using 3D clustering and relaxation
labeling. The three last methods mentioned take only
into account the color information but not the texture
one and for many natural scenes it is very important
to consider both. Finally, Maeda et al. (Maeda et al.,
1999) have proposed a region-growing algorithm
that joins color and texture information by applying
fuzzy sets, performing a region-growing procedure
based on a fixed homogeneity parameter. This
method is not adaptative. There are some adaptive
region-growing algorithms (Hao et. al, 2000), (Pohle
and Toennies, 2001), but they are specifically
designed to work with a particular kind of image and
are computationally inefficient. In a previous work
an adaptive and efficient algorithm for general-
purpose color and textured images segmentation was
proposed by the authors (Fondón et al, 2006).
Nevertheless, when multicolored textures are present
in the image, the results are not completely
satisfactory. In this paper we propose a new method
that solves this problem.
258
Fondón I., Serrano C. and Acha B. (2007).
COLOR AND TEXTURE BASED SEGMENTATION ALGORITHM FOR MULTICOLOR TEXTURED IMAGES.
In Proceedings of the Second International Conference on Computer Vision Theory and Applications - IFP/IA, pages 258-263
Copyright
c
SciTePress

2 ALGORITHM DESCRIPTION
2.1 Reference Colors and Texture
The algorithm will segment all pixels in the image
with color and texture similar to the ones present in
an area selected by the user.
2.2 Color Information
2.2.1 L
*
a
*
b
*
Color Space
A perceptually uniform color space is needed so that
distances between colors measured in this space are
correlated with color differences according to human
perception. We have chosen the L
*
a
*
b
*
color space
that is a perceptually uniform orthogonal Cartesian
coordinate system (Plataniotis and Venetsanopoulos,
2000).
2.2.2 Anisotropic Diffusion
Anisotropic diffusion is used for the denoising step.
This is a non linear filtering method stronger in the
homogeneous parts of the image and weaker in the
edges
(Perona and Malik
,
1990).
2.2.3 Reference Colors
In order to find the reference colors, we perform a
clustering operation with the well-known k-means
algorithm in the L
*
a
*
b
*
color space. To obtain the
value k of numbers of clusters automatically, we use
Dunn’s coefficient
(Maulik and Bandyopadhyay,
2002)
()
()()
⎪
⎭
⎪
⎬
⎫
⎪
⎩
⎪
⎨
⎧
⎪
⎭
⎪
⎬
⎫
⎪
⎩
⎪
⎨
⎧
′
=
≤≤
≠≤≤≤≤
n
kn
ji
ijkjki
cd
ccd
D
1
,11
max
,
minmin
(1)
where d(c
i
,c
j
) is the Euclidean distance between
cluster i and cluster j, that is, the inter-cluster
distance. d’(c
n
) is the intra-cluster distance for We
assume that, in multicolored textures, the number of
different colors is less or equal to 16. So, we
perform 16 clusterings beginning from k=1 to k=16.
We select the value of k that provides the highest
value of D, which leads to a maximum inter-cluster
distance and a minimum intra-cluster distance. Then,
the k reference colors are defined as the centroids of
the k clusters in L
*
a
*
b
*
color space. In Figure 1 we
can see an example.
2.2.4 Distance Images
(b)
(a)
(c)
Figure 1: From the original image (a) the user selects a
region, circled in red, where a multicolored texture is
present. The reference colors obtained with k-means
algorithm and Dunn coefficient are shown in images (b)
and (c).
Once the reference colors are obtained, the
distances between every single pixel of the image
and each of the reference colors are calculated. We
have chosen CIEDE2000 as the distance metric.
This measure has been extensively tested and
outperformed other existing color difference
formulae (Luo et. al.,
2001). Then, a new set of
images is built, where each pixel value will be the
CIEDE2000 color difference to each of the reference
colors. In order to obtain a better visualization, we
invert this image, that is, those pixels whose values
are similar to the reference ones, will appear light in
a dark background. These inverted images are called
the distance images In Figure. 2, there is an example
for the reference colors shown in Figure. 1.
2.3 Texture Information
The proposed method extracts texture features only
from the luminance component (L
*
) of the original
image and not from the chrominance ones (a
*
, b
*
).
This assumption is based on previous works: the
psychophysical studies of Poirson and Wandell
suggest that color and pattern information in the
human visual system are processed separately
(Poirson and Wandell,1996). Mojsilovic et al.(
Mojsilovic et al, 2000), state that human perception
of pattern is unrelated to the color content of an
image. Mäenpää and Pietikäinen (Mäenpää and
Pietikäinen, 2004) conclude that it seems that texture
information should be extracted from the luminance
component, whereas color is more a regional
property. The texture features employed in this
method are based on some local low statistical
moments (Tuceryan., 1994) In order to justify the
choice of first order statistics for texture feature
extraction, Zamperoni et al. (Zamperoni et al,1995)
state that although one can construct some patterns
for which the choice of first order statistics does not
work, the converse is true for a surprisingly high
COLOR AND TEXTURE BASED SEGMENTATION ALGORITHM FOR MULTICOLOR TEXTURED IMAGES
259
number of real images representing natural scenes of
a given type, as confirmed by the experiments
reported in Lowitz (Lowitz, 1983) and in Kim (Kim,
1986).
The algorithm calculates for every pixel, four
statistical moments m
pq
with p,q={0,1} by
processing the L
*
component with local masks
expressed in a normalized coordinate system. A
formal expression of these moments is shown in
equation (2).
()
1,0,,,
;
2
;
2
;,
1
2
2
2
2
2
=∈
−
=
−
=
∑∑
=
+
−=
+
−=
qpimageji
W
jn
y
W
im
x
yxnmf
W
m
nm
q
n
p
m
Wi
Wim
Wj
Wjn
pq
(2)
W is the window width, (i,j) are the pixel
coordinates for which the moments are computed,
(m,n) the coordinates of another pixel which falls
within the window, (x
m
y
n
) are the normalized
coordinates for (m,n), and f(m,n) is the value of the
L
*
component at the pixel with coordinates (m,n).
This normalized expression leads us to compare
among pixel moments and it is equivalent to the
finite convolution of the image with a mask. The
sizes of these masks have been fixed to the size of
the selection box. Usually, for each segmentation
this size will be different, so the algorithm will be
automatically adapted to the texture we want to
isolate. With all these parameters, we can build four
new images M
pq
with p,q={0,1} corresponding to
each statistical parameter. To this purpose we assign
to each pixel a value equal to the previously
calculated moment m
pq
. Afterwards, we defined new
images calculated from the energy of the moments.
We called them energy images E00, E01, E10 and
E11 and they represent the strength of each moment
around the pixel location. The computation of the
energies follows equation (3).
() ()
.,
1
,
2
2
2
2
2
2
∑∑
+
−=
+
−=
=
Wi
Wim
Wj
Wjn
pqpq
nmM
W
jiE
(3)
E
pq
(i,j) is the energy corresponding to the pixel
with coordinates (i,j) in the image M
pq
, W is the
window width, M
pq
(m,n) is the value of the pixel
with coordinates (m,n) in the moment image M
pq
and
p,q={0,1}Each pixel is now characterized with four
values, one from each energy image. They are
considered as coordinates in a four-dimensional
space. Subsequently, in order to assign each pixel to
one texture in the image, we apply the same
clustering procedure previously described in section
2.2.3 but in this four-dimensional texture space.
(a)
(b)
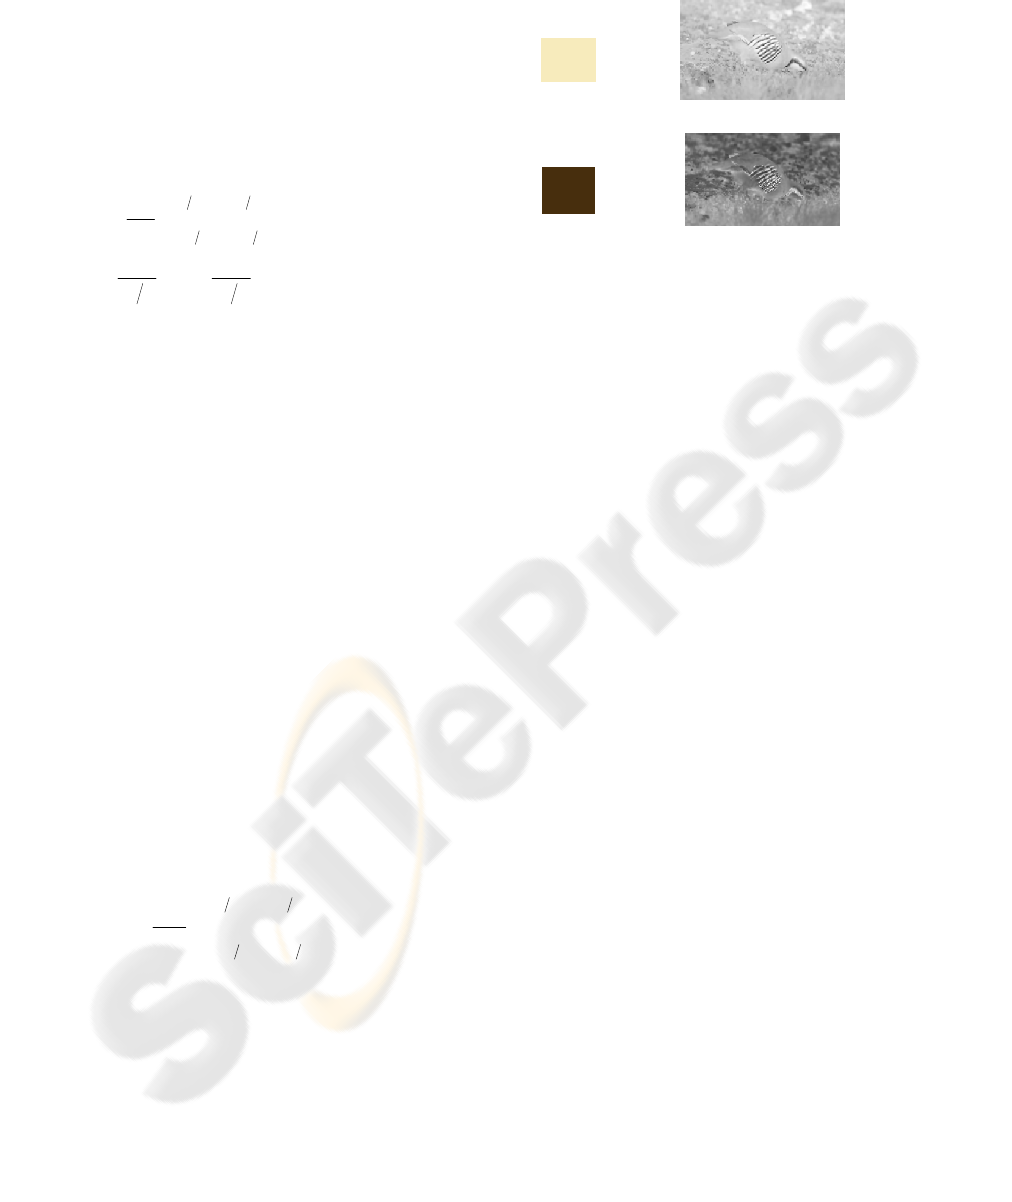
Figure 2: Two distance images obtained with CIEDE2000
color distance formulae, for the original image shown in
Figure 1. Image (a) corresponds to light yellow and (b) to
brown.
We again assume that, in natural scenes, the
number of different textures is less or equal to 16.
Once each pixel in the image has been classified, we
select only those pixels whose texture is equal to the
desired one, obtaining a black and white image in
which white pixels are those with the desired
texture, as shown in Figure 3. This image will be
used afterwards in the region-growing process.
2.4 Multistep Region Growing
As explained before, region-growing techniques
have two critical aspects: the seed selection and the
choice of the merging condition.
2.4.1 Seed Selection
We must notice that those pixels more similar to the
reference color have been assigned a high value
(note that we have inverted the distance image). In
order to select the seeds, the next three steps are
followed for each of the distance images: 1)
Selection of the local maxima of the image, which
represent the candidates to seeds. Not all these
candidates will be seeds for the region growing,
because these local maxima do not belong
necessarily to the region of interest. 2) Application
of a threshold to these candidate seeds. The
threshold is determined from the histogram of the
distance following an algorithm developed by the
authors (Acha et al, 2003). 3) Finally, texture
information is applied to reject some of the seed
candidates: the final seeds must have, not only the
desired color, but also the desired texture. That is,
among the group of color seeds, only those pixels
that appear white in the texture image are selected.
VISAPP 2007 - International Conference on Computer Vision Theory and Applications
260

Figure 3: The original image in Figure 2 is processed in
order to isolate the strips of the bird. Image (a) is the result
of the k-means algorithm for k=2. The value of D is
0.6944. Image (b) is the result for k=4 and D=0.7469.
Image (d) corresponds to k=8 and D=0.4304 finally, the
maximum D value is obtained for k=4, which leads to the
texture information shown on image (d).
2.4.2 Multistep Region Growing
We use a dynamic region growing method to
segment the distance images. In an ordinary region
growing, the merging condition is always the same.
For each seed, the algorithm grows a region with a
determined condition. With this multi-step
technique, the merging condition automatically
changes in order to find its optimum value, which
will correspond to the highest value of the contrast
parameter explained later on in this subsection.
Let us take a particular seed. The process begins
with a region growing with three conditions:
1) Not belonging to another region grown before.
2) The texture of the pixel must be the desired
one. That means that a pixel only will be added to
the region if it has a value equal to one (for
normalized values) in the texture image.
3) The new pixel must be similar to the pixels
that already are in the region for all the distance
images. This similarity is measured according to (4):
Nn
FF
F
FF
nn
nij
nn
,...,1,
22
min,max,
,
min,max,
=+
+
≤≤−
+
ττ
(4)
In equation (4), n is a subindex indexing the
reference colors, N is the number of reference
colors, F
max,n
and F
min,n
are the maximum and
minimum values of the pixels in the distance image
n inside the region, i and j are the coordinates of the
pixel, F is the value of the pixel in the distance
image n, and τ is the tolerance step, which will be
iteratively increased. Once a region is grown with a
particular τ, the next step is to verify whether the
region obtained is optimal. If it is not optimal, the
region growing will be repeated with a more relaxed
condition, that is, τ is increased. More specifically, τ
follows the expression:
n
σ
α
τ
⋅
=
(5)
In equation (5),
n
σ
is the standard deviations of
the region in the distance image n grown before and
α is variable with an initial value experimentally
fixed to 0.1. For each iteration, to relax the condition
and make the merging interval larger, we increase α
by 0.1. Then, the region growing is repeated with
this more relaxed condition.
The optimality criterion to choose the best region
during the region-growing process consists in
maximizing a contrast parameter. This contrast
parameter is calculated for each distance image as:
edgeOutsideedgeInside
edgeOutsideedgeInside
contrast
+
−
=
(6)
In (6)
edgeInside
and
edgeOutside
represent the
mean values of the pixels belonging to the inner
border and outer border of a region respectively. We
then, use the mean of so obtained contrast values to
determine whether the region is the best or not
At the beginning, the region growing has a very
restrictive merging condition. This will lead us to
obtain a small region. While repeating the process,
the contrast parameter of equation (6) is calculated.
While the grown region is inside the object, the
contrast parameter increases its value in a smooth
way, because pixels belonging to the inner border
and to the outer border of the region are similar.
When the region whose contrast is being calculated
matches the object, the contrast parameter has a high
value because pixels surrounding the region will
differ from those inside the region. If we continue
growing, the contrast parameter will be low again
because both the inner border and the outer border
are similar. Therefore when the contrast parameter
reaches its maximum we have obtained the best
region. A steep slope in the contrast parameter
evolution corresponds to those values of α for which
boundaries are reached. Once the whole boundary is
reached, if the tolerance is being enlarged again the
region will exceed the limits of the object and,
therefore, the contrast will decrease. In such a
situation the region growing will stop because the
stop condition has been attained.
(a)
(b)
(c)
(d)
COLOR AND TEXTURE BASED SEGMENTATION ALGORITHM FOR MULTICOLOR TEXTURED IMAGES
261
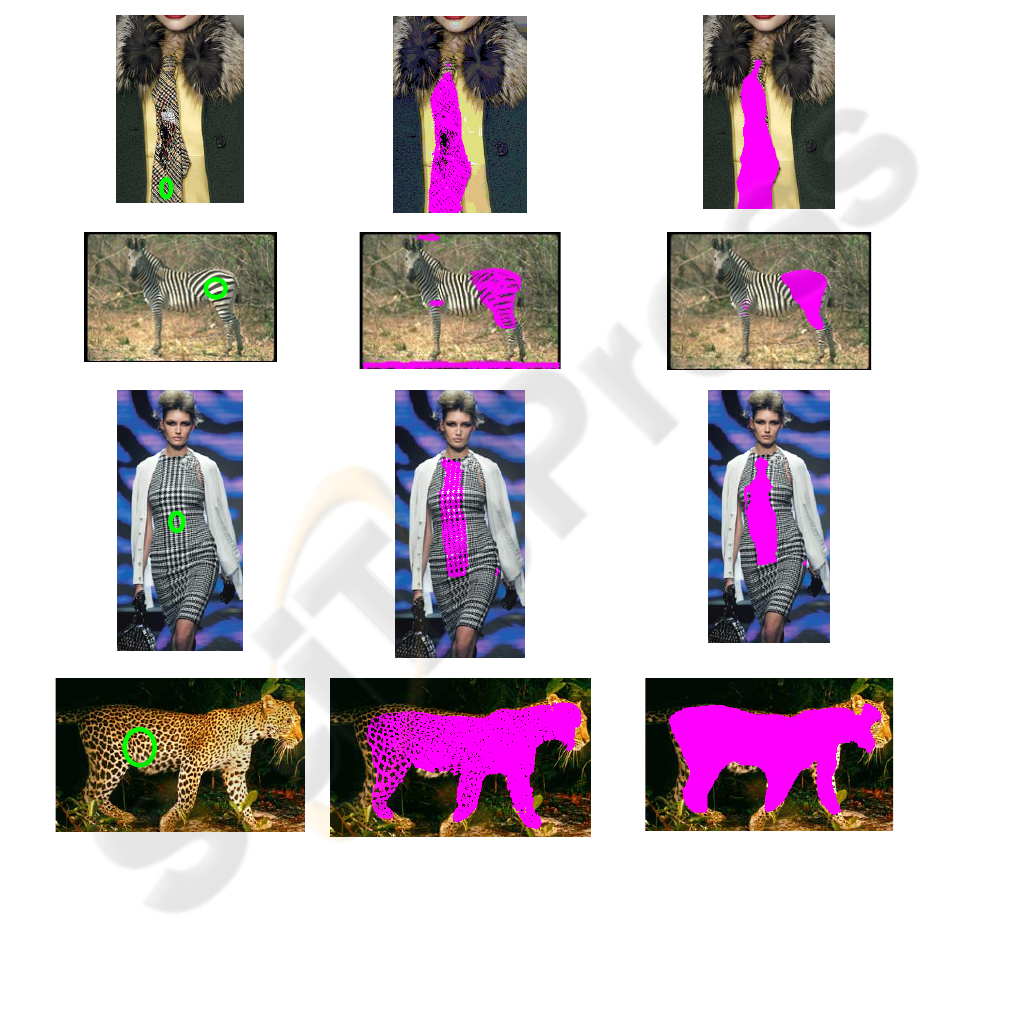
3 EXPERIMENTAL RESULTS
In order to test the algorithm, we have performed the
segmentation of ten particularly difficult images,
with textures compound of very different colors.
Some examples are shown in Figure. 4 To better
analyze its performance, we have compared the
algorithm with one previously published by the
authors (Fondón et al,2006). This second algorithm
takes as the reference color the centroid of the colors
in the selection box. It leads to a poor segmentation
result if colors within a texture are too different.
That is why, as can be observed, segmented regions
present holes in (e)-(h). This problem is solved in
Figures (i)-(l).
Original Previous work Proposed algorithm
(a)
(e)
(i)
(b)
(f)
(j)
(c)
(g)
(k)
(d)
(h)
(l)
Figure 4: Examples of segmentations. (a)-(d) Original images with the selected color and texture marked by the user in
green. (e)-(h) Segmented images by the previous work. (i)-(l) Segmented images by the new algorithm.
VISAPP 2007 - International Conference on Computer Vision Theory and Applications
262

4 CONCLUSIONS
An algorithm to segment multicolored textured
image has been proposed. In a previous work
(author's work 1) the reference color was the
centroid of the colors present within the texture. In
this case, the segmented regions could have holes
corresponding to big differences between the
reference color and that particular pixel color. In the
present work, as we take into account all the colors
in the region, these failures disappear achieving
higher quality results. In the multi-step region
growing technique, which has an automatic
adaptable step, we use a set of color distance images,
each one corresponding to a reference color and we
apply an N-dimensional region-growing, where N is
the number of color distance image. A contrast
parameter is introduced to decide the optimum step
for the region-growing.
The method is designed for general-purpose
images and its good performance with images
difficult to be segmented is demonstrated.
As we have already exposed, the algorithm has
been validated with 10 multicolored textured images
providing better results than the previous work. The
holes are avoided and the regions have better
quality.
ACKNOWLEDGEMENTS
This work is financed by project FIS05-2028.
REFERENCES
Fondón I., Serrano C., Acha B.,2006. Color-Texture
Image Segmentation based on Multi-Step Region
Growing. Optical Engineering, The International
Society for Optical Engineering (SPIE), Vol. 45.
057002-9,057002-9
Muñoz, X., 2002. Image segmentation integrating colour,
texture and boundary information. PhD Thesis,
Universitat de Girona , Spain.
Hojjatoleslami, S. A., Kittler, J., 1998. Region growing: a
new approach. In IEEE Trans. on Image Processing,
7(7), 1079-1084.
Adams, R., Bischof, L., 1994. Seeded region growing, In
IEEE Trans. on Pattern Analysis and Machine
Intelligence, 16(6), 641-647.
Fan, J., Yau, D. K. Y., Elmagarmid, A. K., Aref, W.G.,
2001. Automatic image segmentation by integrating
color-edge extraction and seeded region growing. In
IEEE Trans. on Image Processing, 10(10), 1454-1466.
Fan, J., Zeng, G., Body, M., Hacid, M.-S., 2005. Seeded
region growing: an extensive and comparative study.
Pattern Recognition Letters, 26, 1139-1156.
Cheng, S. -C., 2003. Region-growing approach to colour
segmentation using 3-D clustering and relaxation
labeling. In IEEE Proc. –Vis. Image Signal Process,
150(4), 270-276.
Maeda, J., Novianto, S., Saga, S., Suzuki, Y., Anh, V. V.,
1999. Rough and accurate segmentation of natural
images using fuzzy region-growing algorithm. Proc.
Int. Conf. on Image Processing, Kobe (Japan), 3, 227-
231.
Hao, X., Bruce, C., Pislaru, C., Greenleaf, J. F., 2000. A
novel region growing method for segmenting
ultrasound images. In IEEE Int. Ultrasonics
Symposium, 1717-1720
Pohle, R., Toennies, K. D., 2001. Segmentation of medical
images using adaptative region growin. In Proc. SPIE
Medical Imaging, 4322-4331.
Plataniotis, K.N., Venetsanopoulos, A.N., 2000. Color
image processing and applications, Springer, Berlin
(Germany), 35-37.
Perona, P., Malik, J., 1990. Scale-space and edge
detection using anisotropic diffusion. In IEEE Trans.
on Pattern Analysis and Machine Intelligence, 7, 629-
639.
Maulik, U., Bandyopadhyay, S., 2002. Performance
evaluation of some clustering algorithms and validity
indices. In IEEE Trans. on Pattern Analysis and
Machine Intelligence, 24(12), 1650-1654.
Luo, M.R., Cui, G, Rigg, B., 2001. The development of the
CIE 2000 Colour-Difference formula: CIEDE2000.
Colour Research and Application, 26(5), 340-350.
Poirson, B., Wandell, B., 1996. Pattern-color separable
pathways predict sensitivity to simple colored
patterns. Vision Res., 36(4), 515-526.
Mojsilovic, A., Kovacevic, J., Kall, D., Safranek, R.,
Ganapathy, S., 2000. Matching and retrieval based on
the vocabulary and grammar of color patterns. In
IEEE Trans. Image Processing, 9(1), 38-54.
Mäenpää, T., Pietikäinen, M., 2004.
Classification with
color and texture: jointly or separately?. In Pattern
Recognition, 37, 1629-1640.
Tuceryan, M., 1994. Moment based texture segmentation.
In Pattern recognition letters, 15(7), 659-668.
Zamperoni, P., 1995. Model-free texture segmentation
based on distances between first-order statistics.
Digital Signal Processing, 5, 197-225.
Lowitz, G., 1983. Can a local histogram really map
texture information?. In Pattern Recognition, 2, 141-
147.
Kim, V., Yaroslavskii, Y. P.,1986. Rank algorithms for
picture processing. Comput. Vision Graphics Image
Process., 35, 234-258.
Acha, B., Serrano, C., Acha, J. I., Roa, L. M., 2003. CAD
tool for burn diagnosis, Lecture Notes in Computer
Science (Springer), 2732, 294-305.
COLOR AND TEXTURE BASED SEGMENTATION ALGORITHM FOR MULTICOLOR TEXTURED IMAGES
263
