
FAULT DETECTION ALGORITHM USING DCS METHOD
COMBINED WITH FILTERS BANK DERIVED FROM THE
WAVELET TRANSFORM
Oussama Mustapha
1,2
, Mohamad Khalil
2,3
, Ghaleb Hoblos
4
, Houcine Chafouk
4
and Dimitri Lefebvre
1
1
University Le Havre, GREAH, Le Havre, France
2
Lebanese University, Faculty of Engineering, Section I- El Arz Street, El Kobbe, Lebanon
3
Islamic University of Lebanon, Faculty of engineering, Biomedical Department, Khaldé, Lebanon
4
ESIGELEC, IRSEEM, Saint Etienne de Rouvray, France
Keywords: Signal, Filters Bank, DCS, Fault, detection, wavelet transform.
Abstract: The aim of this paper is to detect the faults in industrial systems, such as electrical machines and drives,
through on-line monitoring. The faults that are concerned correspond to changes in frequency components
of the signal. Thus, early fault detection, which reduces the possibility of catastrophic damage, is possible
by detecting the changes of characteristic features of the signal. This approach combines the Filters Bank
technique, for extracting frequency and energy characteristic features, and the Dynamic Cumulative Sum
method (DCS), which is a recursive calculation of the logarithm of the likelihood ratio between two local
hypotheses. The main contribution is to derive the filters coefficients from the wavelet in order to use the
filters bank as a wavelet transform. The advantage of our approach is that the filters bank can be hardware
implemented and can be used for online detection.
1 INTRODUCTION
The fault detection and diagnosis are of particular
importance in industry. In fact, the early fault
detection in industrial machines can reduce the
personal damages and economical losses. Many
researchers have performed fault detection by using
mechanical conditions such as vibration analysis.
Recently the current or voltage signature analysis is
used for the detection of electromechanical faults,
such as a broken bar in electrical drives (Sottile and
Kohler, 1993; Schoen et al., 1995; Kliman et al.,
1996). Other researchers use the AI tools
(Awadallah and Morcos, 2003) and frequency
methods (Benbouzid, et al., 1999).The aim of this
paper is to propose a method for the on-line
detection of changes in the electric current feeding
an induction motor due to a mechanical fault. The
method is based on a filters bank, whose coefficients
are derived from the wavelet, to decompose the
signal in order to explore their frequency and energy
components of the signal. Then, the Dynamic
Cumulative Sum method is applied to the filtered
signals in order to detect any change in the signal.
The filters bank is derived from the wavelet
transform, by using the Prony method, so the
wavelet characteristics are approximately conserved
and this allows both filtering and reconstruction of
the signal. The main contributions are to derive the
filters and to evaluate the error between filters bank
and wavelet transform. This study continues our
investigation concerning fault detection by means of
wavelet transform and filters bank (
Mustapha et al.,
2006a, 2006b). Extraction and detection will be
applied on simulated and real signals. The real
signals are issued from long duration experiments,
with GREAH, on asynchronous machines of 4kW.
These signals are recorded when the machine is
properly
operating and then when a bar of the same
machine is broken.This paper is decomposed as
follows. First we present the wavelet transform
(WT) and the filters bank technique. In section 3 we
detail the derivation of filters from a WT. In section
4, the Cumulative Sum and the Dynamic Cumulative
Sum methods are presented. In section 5, some
results are discussed. Then, the choice of the suitable
filter are discussed in section 6.
226
Mustapha O., Khalil M., Hoblos G., Chafouk H. and Lefebvre D. (2007).
FAULT DETECTION ALGORITHM USING DCS METHOD COMBINED WITH FILTERS BANK DERIVED FROM THE WAVELET TRANSFORM.
In Proceedings of the Fourth International Conference on Informatics in Control, Automation and Robotics, pages 226-231
DOI: 10.5220/0001640802260231
Copyright
c
SciTePress
2 WT AND FILTERS BANK
The Fourier analysis is the most well known
mathematical tool used for transforming the signal
from time domain to frequency domain. But it has
an important drawback represented by the loss of
time information when transforming the signal to the
frequency domain. To preserve the temporal aspect
of the signals when transforming them to frequency
domain, one solution is to use is the WT (
Truchetet,
1998
) which analyzes non-stationary signals by
mapping them into time-scale and time-frequency
representation. The Wavelet Transform is similar to
the Short Time Fourier Transform but provides, in
addition, a multi-resolution analysis with dilated and
shifted windows. The multi-resolution analysis
consists of decomposing the signal x(t) using the
wavelet
)(t
ψ
and its scale function )(t
φ
(Frandrin,
1993; Krim, 1995):
(t)dtx(t)ψ=b)(a,T
ab
ψ
x
∫
+∞
∞−
,
ab
1t-b
ψ (t)= ψ()
a
a
(1)
where a and b are respectively the dilation and
translation parameters. The filter associated with the
scale function
)(t
φ
is a low pass filter and the filter
associated to the wavelet
)(t
ψ
is a band pass filter.
The following formulas can be used to calculate
detail and approximation coefficients (
Truchetet,
1998):
∫
+∞
∞−
= dtttxmna
nmx
)()(),(
φ
(2)
∫
+∞
∞−
= dtttxmnd
nmx
)()(),(
ψ
(3)
where m and n are integers.
In this way, the relevant events, to be detected, can
be shown as details on specific scale levels. In
Discrete Wavelet Transform (DWT), the multi-
resolution analysis uses a scaling function and a
wavelet to perform successive decomposition of the
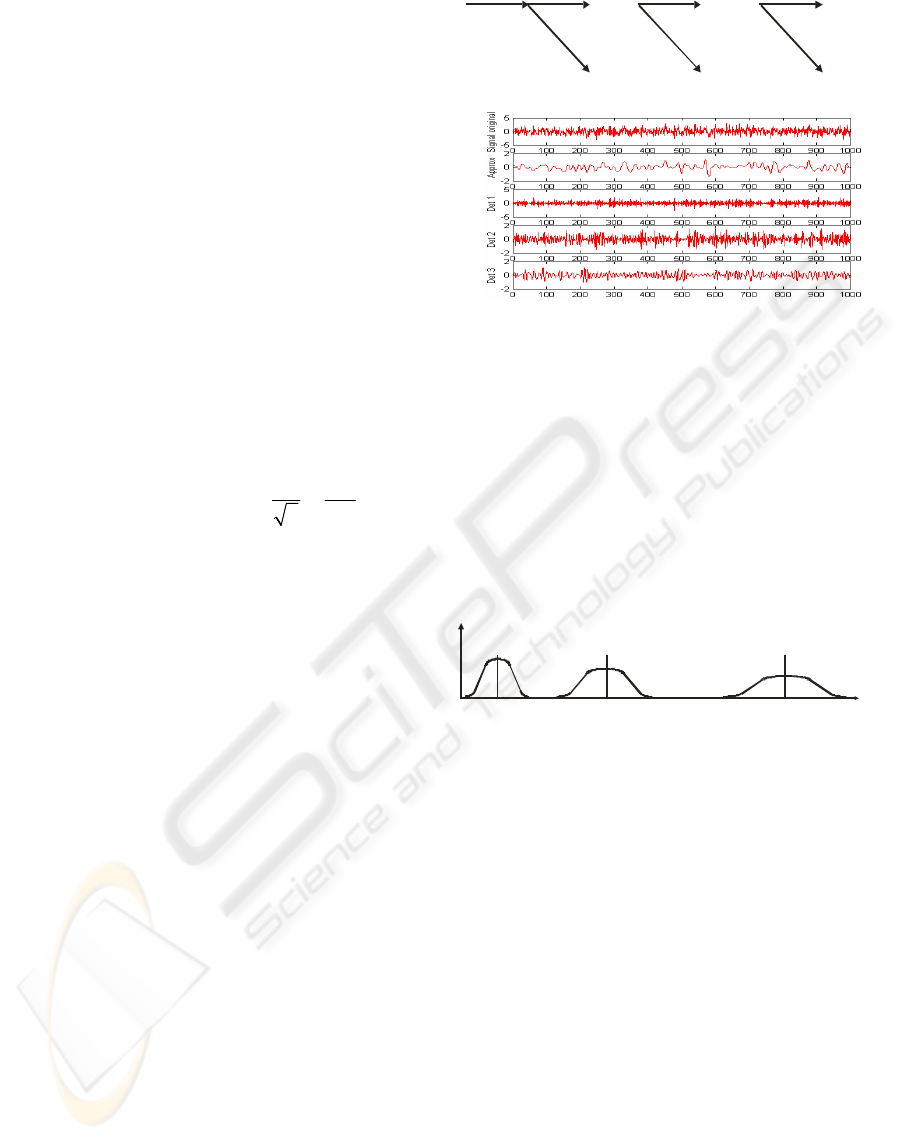
signal into approximations and details (figure 1: a
and b).
Figure 1: (a) multi-resolution analysis: Successive
decomposition into approximations and details (b) multi-
resolution analysis of the original signal into an
approximation and three detail levels.
At each time t, the signal is first decomposed by
using an N-channels band-pass filters bank whose
central frequency moves from lowest frequency f
1
up
to the highest frequency f
N
. Each component m
∈
{1,
…, N} is the result of filtering the original signal x
by a band-pass filter centered on f
m
. The frequency
response of the filters bank is shown in (figure 2).
H(jf) in d
B
f
f
1
f
m
f
N
Figure 2: Response curves of the filters bank.
For each component m, the sample y
(m)
(t), is on-line
computed according to the original signal x(t) and
using the parameters a
i
(m)
and b
j
(m)
of the
corresponding band-pass filter according to (4):
)4()()(.)(
1
)(
0
)()(
∑∑
==
−−−=
p
i
m
i
q
j
mm
ityajtxbjty
where x is the original signal, f
s
is the sampling
frequency of the original signal x, f
N
must satisfy the
condition f
N
≤ f
s
/2, N is the number of channels
used, p and q are the orders of the filter at level m.
The choice of the filters bank depends on the
original signal and its frequency band. The number
of filters N depends on the details that we have to
extract from the signal and on the events that must
be distinguished. In our case we will use N =3
filters.
The procedure of decomposing x(t) into signals
y
(m)
(t), m=1…N, allows us to explore all frequency
components of the signal. y
(1)
(t) gives the low
x
(t
)
sc ale
w
a
v
e
l
e
t
approx
[v ]
1
1
detail
[w ]
1
1
scale
w
a
v
e
l
e
t
app rox .....
[v ]
2
2
detail
[w ]
2
2
scale
w
a
v
e
l
e
t
approx . ....
[v]
j
j
detail
[w]
j
j
(a )
1
(d )
1
(a )
0
(a )
2
(d )
2
(a )
3
(d )
3
FAULT DETECTION ALGORITHM USING DCS METHOD COMBINED WITH FILTERS BANK DERIVED FROM
THE WAVELET TRANSFORM
227
frequency components and y
(N)
(t) gives the high
frequency ones. Therefore, the points of change of
each component give information about the
frequency and energy contents and will be used to
detect any changes in frequency and energy in the
original signal.
3 PRONY'S METHOD
In the present work, the main objective is to derive
the filters coefficients of a filters bank from a
wavelet in order to use the filters bank as a WT. The
filters bank is derived from the WT, by using the
Prony's method, so the wavelet characteristics are
approximately conserved and this allows both
filtering and reconstruction of the signal.
For a given wavelet, we can use the approximation
coefficients of the wavelet function ψ(t) to extract
the coefficients a
i
and b
i
in order to design an IIR
filter that behaves as the wavelet. The extraction of
the filter coefficients can be done by using the
Prony's method. The main advantage of the wavelet-
derived filter is that it can be used instead of the
wavelet and can be hardware implemented in order
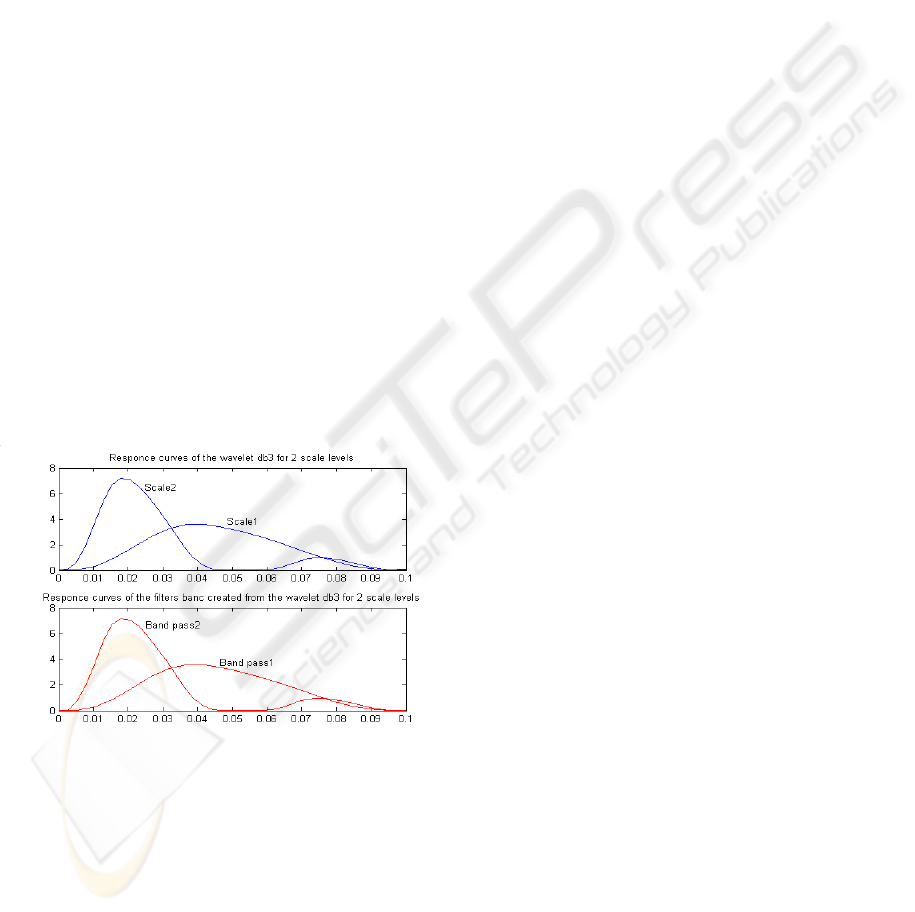
to be used for online signal filtration. Figure 3 shows
the response curves (h
wav
) of the wavelet function
'db3' and the response curves (h
filt)
of the derived
filter.
Figure 3: response curves of the wavelet function 'db3' and
of the derived filters bank (the filter's order is 30).
Prony's method is an algorithm that can be used to
find an IIR filter with a prescribed time domain
impulse response. According to the time domain
impulse response h
wav
of the wavelet function )(t
ψ
,
the numerator order p and the denominator order q
of the desired filter, Prony's method is used to
compute the filter's coefficients a
i
and b
j
, i=1…p and
j=1…q. If the length of h is less than the largest
order (p or q), h is padded with zeros. It is
fundamentally based on signal approximation with a
linear combination of adjustable exponentials.
The impulse matching problem for modeling an
entire causal signal x(t), t=0,1,…,∞, produces an
infinite number of equations. The problem is to find
the parameters a
i
and b
i
such that the equation (x) is
satisfied:
)5(
0
0
0
1
1
0)0()1()2(
0....).........0()1(
0.................0)0(
1
0
?
~~
2
~
1
?
2
1
⎥
⎥
⎥
⎥
⎥
⎥
⎥
⎥
⎥
⎥
⎦
⎤
⎢
⎢
⎢
⎢
⎢
⎢
⎢
⎢
⎢
⎢
⎣
⎡
=
⎥
⎦
⎤
⎢
⎣
⎡
=
⎥
⎥
⎦
⎤
⎢
⎢
⎣
⎡
⎥
⎥
⎦
⎤
⎢
⎢
⎣
⎡
=
⎥
⎥
⎥
⎥
⎥
⎥
⎦
⎤
⎢
⎢
⎢
⎢
⎢
⎢
⎣
⎡
⎥
⎥
⎥
⎥
⎦
⎤
⎢
⎢
⎢
⎢
⎣
⎡
#
#
#
#%##
"
q
p
b
b
b
b
aXx
X
a
a
a
xxx
xx
x
where X
1
is the top part of matrix X,
~
a is a p
dimentional vector of parameters {a
i
}, b is a q+1
dimentional vector of parameters {b
j
},
~
x is the first
column of bottom part of matrix X, and
~
2
X
is the p
last columns of matrix X bottom part.
The equation
~~~?
2
0xXa
+
=
contains an infinite
number of equations to be solved for
~
a
. This linear
equation is usually over determined and no exact
solution exists. This means that since the vector
~
x
can only be approximated by the columns of
matrix
~
2
X
, it's necessary to choose
~
a
to minimize
the equation error defined by the equation (6):
∑∑∑
∞
+==
∞
+=
⎪
⎭
⎪
⎬
⎫
⎪
⎩
⎪
⎨
⎧
−+===
1
2
11
2
)6()()()(
qt
p
i
i
qt
T
itxatxteee
ε
with
~~~
2
exXa=+
. The error is minimized by using
partial differentiation with respect to parameters
{a
i
}:
~
2
~~
2
~
2
~
xXaXX
TT
−=
(7)
In order that the orthogonality condition
0
2
~
min
=Xe
T
is satisfied, (7) provides a solution for the optimum
vector
~
a
, which can then be used to find the
solution to vector b by simple matrix multiplication
in (5).
4 CUMSUM AND DCS
The Cumulative Sum algorithm (CUMSUM)
algorithm is based on a recursive calculation of the
logarithm of the likelihood ratios. This method can
ICINCO 2007 - International Conference on Informatics in Control, Automation and Robotics
228
t
M
be considered as a sequence of repeated tests around
the point of change t
M
(figure 4) (Nikiforov, 1986;
Basseville and Nikiforov, 1993
). For the seek of
simplicity x(t) will be referred as x
t
in the following.
Let x
1
,x
2
,x
3
,…,x
t
be a sequence of observations. Let
us assume that the distribution of the process X
depends on parameter
0
θ
until time t
M
and depends
on parameter
1
θ
after the time t
M
. At each time t we
compute the sum of logarithms of the likelihood
ratios as follows:
)8(
),...,/(
),...,/(
1
11
11
1
)(
),(
1
0
1
∑∑
=
−
−
=
==
t
i
tt
tt
t
i
i
m
mt
xxxf
xxxf
LnsS
θ
θ
The importance of this sum comes from the fact that
its sign changes after the point of change. The
detectability (
Basseville and Nikiforov, 1993) is due to
the fact that the expectation
0][
0
<
i
sE
θ
and
0][
1
>
i
sE
θ
. We, then, calculate the following
detection function
),(
1
1
),(
1
)(
min
mi
ti
mt
t
m
SSg
≤≤
−= . This
function compares, at any time t, the difference
between the value of the sum of the logarithm of the
likelihood ratio and its minimal current value. The
instant at which the procedure is stopped is t
a
= min
{t : g
(m)
t
≥
h}, where h is the detection threshold (i.e
the change can be detected when the detection
function reaches a predetermined threshold h). The
point of change can be defined as follows t
M
= max
{t : g
(m)
t
= 0}.
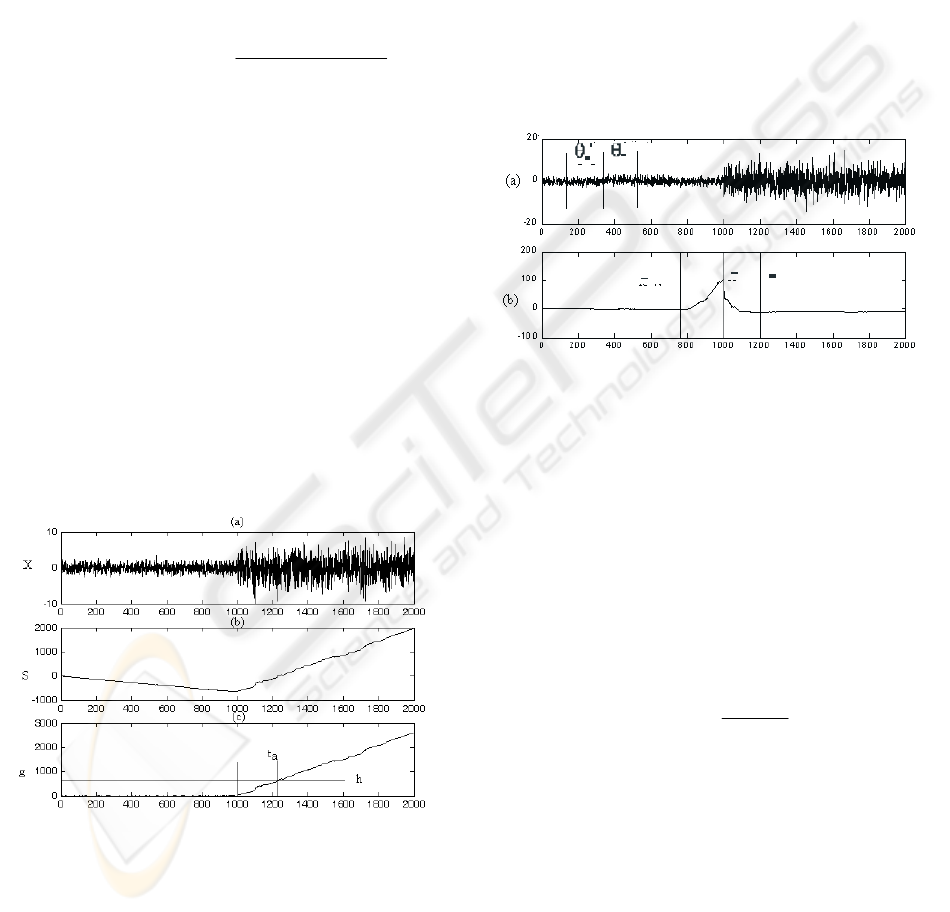
Figure 4: CUNSUM algorithm (a) Signal (b) CUNSUM
(c) Detection function.
At any time t and for the observation
vector
),...,(
1 tt
xxXX == , suppose that the
distribution of the process X depends on
parameter
θ
. A change can affect the frequency
distribution of the signal. The Dynamic Cumulative
Sum method (DCS) is a repetitive sequence around
the point of change t
M
. It is based on the local
cumulative sum of the likelihood ratios between two
local segments estimated at the current time t. These
two dynamic segments
)(t
a
S
(« after t ») and
)(t
b
S
(« before t ») are estimated by using two windows of
width W (figure 5) before and after the time instant t
as follows:
*
}1,...,{i ;:
)(
−−= tWtxS
i
t
b
follows a probability
density function
(
)
i
xf
0
θ
*
},...,1{i ;:
)(
WttxS
i
t
a
++=
follows a probability
density function
(
)
i
xf
1
θ
Figure 5: DCS algorithm (a) Signal; (b) Dynamic
cumulative sum Cumulative sum; (c) Detection function.
The parameters
)(
^
t
b
θ
of the segment
)(t
b
S
, are
estimated using W points before the time instant t
and the parameters
)(
^
t
a
θ
of the segment
)(t
a
S
, are
estimated using W points after the time instant t. At a
time t, the DCS is defined as the sum of the
logarithm of likelihood ratios from the beginning of
the signal up to the time t:
)9(
)(
)(
),(
1
^
1
)(
)(
)(
)()(
^
^
∑∑
==
==
t
i
i
t
i
i
i
i
i
t
b
t
a
m
s
xf
xf
LnSSDCS
b
a
θ
θ
(
Khalil, 1999) proves that the DCS function reaches
its maximum at the point of change t
M
. The detection
function used to estimate the point of change is
(
)()
( ) ( ) () () () ()
1
max , , (10)
mmtttt
t
ab ab
it
gDCSSSDCSSS
≤≤
⎡⎤
=−
⎣⎦
The instant at which the procedure is stopped is
t
a
= inf {t : g
(m)
t
≥
h}, where h is the detection
threshold. The point of change is estimated as
t
M
= max {t>1 : g
(m)
t
= 0}. The DCS is a method that
t+W
t-W
t
FAULT DETECTION ALGORITHM USING DCS METHOD COMBINED WITH FILTERS BANK DERIVED FROM
THE WAVELET TRANSFORM
229
can be used when the parameters of the signal are
unknown.
5 RESULTS
The algorithm is first applied to simulated signals
and then to real signals (figure 6). The simulated
signal is generated by concatenating two random
signals of different variances (σ
0
=1 et σ
1
=3), and
two sinusoidal signals of different frequencies
(f
0
=150Hz et f
1
=600Hz). Real and simulated signals
are decomposed into 3 scales before applying the
DCS method. These scales are computed by using
the ARMA coefficients calculated by Prony’s
method and corresponding to the ‘db3’ wavelet. The
coefficients of the derived filter of order 5 from the
wavelet 'db3' for scale level 3 are detailed in the next
table:
Table 1: Derived filters coefficients.
ai 1.000 -1.247 0.527 -0.165 0.604 -0.409
bi 0 0.0110 0.0130 0.0144 0.0203 0.0252
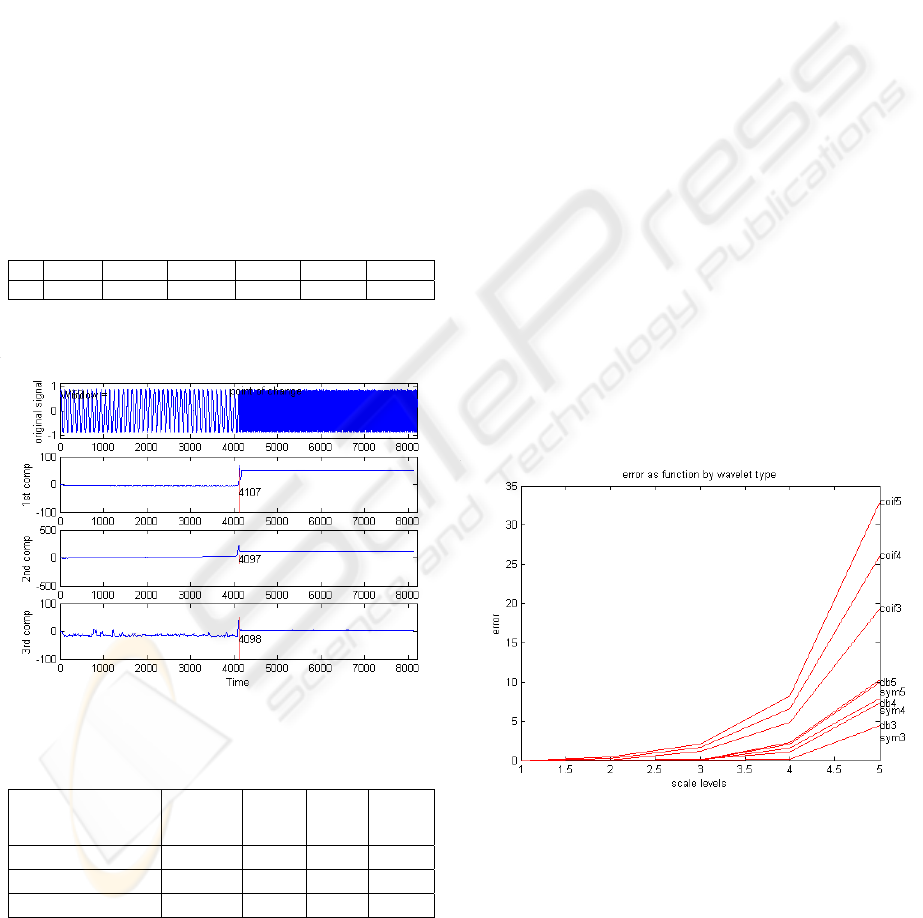
The results lead us to determine the point of change
of statistical parameters of these signals.
Figure 6: Detection of a real signal.
Table 2: Comparison of the points of change.
Expected
Time of
change
1
st
comp.
2
nd
comp.
3
rd
comp.
1
st
simulated signal
1000 1006 1005 1002
2
nd
simulated signal
2000 2012 2003 2001
Real signal
4000 4107 4097 4098
Note that the third component, which is filtered by a
highest central frequency band-pass filter, presents
the closest point of change to the real one as shown
in the table 2.
6 FILTER'S ORDER
In the wavelet theory, the choice of the wavelet is a
critical problem. To extract the specific events in a
signal, the choice of the wavelet is important to be
adapted to the event to be detected. Many
researchers have performed the detection by using
the wavelet in different domains of application: in
image edge detection (Mallat, 2000), for
compression (Benbouzid et al.,1999), for signal de-
noising in speech processing (Misiti et al.). In
biomedical applications, the quadratic spline wavelet
is used by Li (Li et al.,1995) and the complex
wavelet is used by Shenhadji (Shenhadji et al.,1995)
to process the ECG signal.
In our work, filters derived from many wavelets
such as the Daubechies, the coiflet and the symlet
wavelets are tested and according to the results
obtained in figure 7, the filter derived from the
wavelet 'db3' at level 3 has been used because it
presents the minimum error and then it is chosen.
Note that the error is defined as follows:
)11()(
1
2
∑
=
−=
k
i
filtwav
hherror
Where, h
wav
and h
filt
are the impulse responses of the
wavelet and the derived filter respectively.
Figure 7: Error due to the use of different types of
wavelets.
The orders of the filter (p and q) are very important
parameters and can affect the error due to the
application of Prony's method to extract the filter
coefficients from the wavelet. As shown in figure 8,
we can see that if the order of the filter becomes 30
and above, the error due to the derivation becomes
negligible for filter derived from db3.
ICINCO 2007 - International Conference on Informatics in Control, Automation and Robotics
230
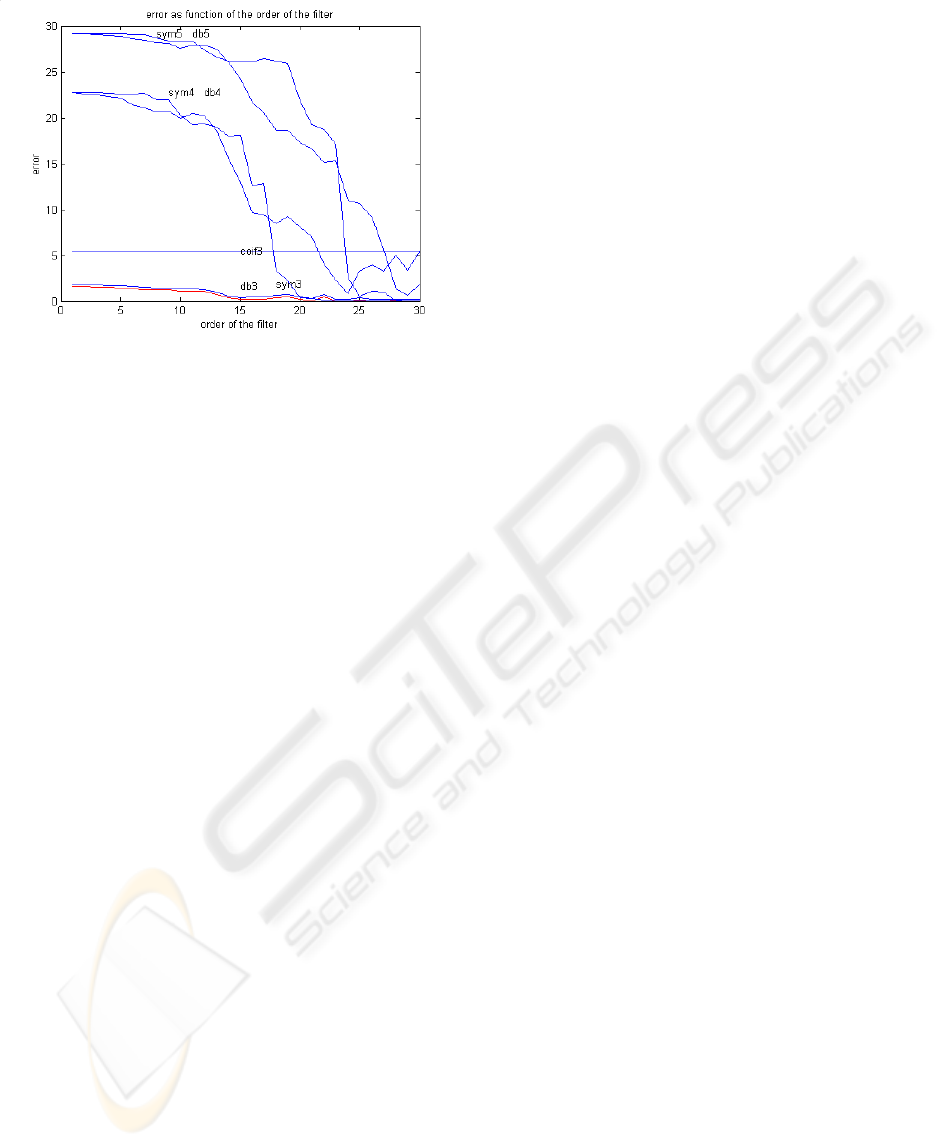
Figure 8: Error due to the order of the filter derived from
different types of wavelets (scale 2 and p=q=30).
7 CONCLUSIONS
This article has proposed a method to detect the
point of change of statistical parameters in signals
issued from industrial machines. This method uses a
band-pass filters bank, derived from a wavelet
transform, to decompose the signal and the DCS
algorithm to characterize and classify the
parameters
of a signal in order to detect any variation of the
statistical parameters due to any change in frequency
and energy. The main contribution of the work is to
find a filters bank that approximates a wavelet. The
filters bank derivation is done by using the Prony's
method. After the calculation of the resulting error,
between the derived filters bank and the
correspondent wavelet, the wavelet 'db3' has been
selected. In order to reduce the error due to the order
of the derived filter, the order is taken to be beyond
30. This on-line algorithm is developed and tested
and it gives good results for the detection of changes
in the signals. It is necessary to test the algorithm
with other types of wavelets, to explain the error
depending on the scale levels, and to implement the
whole algorithm in a DSP. The detectability of DCS
must be proved after decomposing the signal,
especially after using the ARMA decomposition.
Another perspective is to complete the filters design
by determining the optimum orders p and q.
REFERENCES
Sottile J, Kohler J. An on-line method to detect incipient
failure of turn insulation in random wound motors.
IEEE Trans Energy Conver 1993;8(4):762–8.
Schoen RR, Habetler TG, Kamran F, Bartheld RG. Motor
bearing damage detection using stator current
monitoring. IEEE Trans Ind Appl 1995;31(6):1274–9.
Kliman GB, Premerlani WJ, Koegl RA, Hoeweler D. A
new approach to on-line turn fault detection in AC
motors. In: Proceedings of IEEE-IAS Annual Meeting,
1996:687–93.
Awadallah M.A,Morcos M.M., Application of AI tools in
faults diagnosis of electrical machines and drives – an
verview, Trans. IEEE Energy Conversion, vol. 18, no.
2, pp. 245-251, june 2003.
Benbouzid M., Vieira M., Theys C., "Induction motor's
faults detection and localization using stator current
advanced signal processing techniques" IEEE
Transaction on Power Electronics, Vol. 14, N° 1, pp
14 – 22, January1999.
Truchetet T. Ondelettes pour le signal numérique,
collection traitement du signal, HERMES, Paris, 1998.
Flandrin P. Temps fréquence, HERMES, Paris, 1993.
Krim H., Pesquet J.C. Multiresolution analysis of a class
of non stationnary processes. IEEE transaction on
information theory, 1995, vol. 41, No 4,pp 1011-1020.
Mallat S., Une exploration des signaux en ondelettes, les
éditions de l'école polytechnique, Paris, juillet 2000.
Nikiforov I. Sequential detection of changes in stochastic
systems. Lecture notes in Control and information
Sciences, NY, USA, 1986, pp. 216-228.
Basseville M., Nikiforov I. Detection of Abrupt Changes:
Theory and Application. Prentice-Hall, Englewood
Cliffs, NJ, 1993.
Khalil M. Une approche pour la détection fondée sur une
somme cumulée dynamique associée à une
décomposition multiéchelle. Application à l'EMG
utérin. 17ème Colloque GRETSI sur le traitement du
signal et des images, Vannes, France,1999.
Li C., Zheng C., Tai C. Detection of ECG characteristic
points using wavelet transform. IEEE transaction,
BME, 1995, vol.42, No 1, pp 21- 29.
Shenhadji L., Bellanger J.J., Carraut G. Détection temps
échelle d’événements paroxystiques intercriptiques en
électroencéphalogramme, traitement du signal, 1995,
vol.12, No 4, pp 357-371.
Misiti M., Misiti Y., Oppenheim G., Poggi J.M.. Wavelet
Toolbox for use with MATLAB® Computation
Visualization Programming. The MathWorks User’s
guide version 4.
Mustapha O., Khalil M., Hoblos G., Chafouk H., Ziadeh
H., Lefebvre D., On-Line Fault Detection by Using
Filters Bank and Artificial Neural Networks IEEE –
ICCTA, Damascus, Syria, April 2006.
Mustapha O, Khalil M., Hoblos G, Chafouk H., Ziadeh H.,
Lefebvre D., On-Line Change Detection by Using
Filters Bank/Wavelet Transform and Dynamic
Cumulative Sum Method, 4th FAI International
Conference, Lefke, Cyprus, December 2006.
FAULT DETECTION ALGORITHM USING DCS METHOD COMBINED WITH FILTERS BANK DERIVED FROM
THE WAVELET TRANSFORM
231
