
A PRODUCT LINE OF SOFTWARE REUSE COST MODELS
Mustafa Korkmaz and Ali Mili
College of Computer Science, New Jersey Institute of Technology
Newark NJ 07102-1982
Keyword: Product line tool, a software reuse cost model, ROI functions, quantify
time-to-market gains, non-linear
optimization problem.
Abstract: In past work, we had proposed a software reuse cost model that combines releva
nt stakes and stakeholders
in an integrated ROI-based model. In this paper we extend our earlier work in two directions: conceptually,
by capturing aspects of the model that were heretofore unaccounted for; practically, by proposing a product
line that supports a wide range of cost modeling applications.
1 INTRODUCTION: AN
INTEGRATED COST MODEL
In (Mili et al, 2000), (Mili et al, 2001); Mili et al had
proposed a software reuse cost model that has the
following characteristics:
• It
recognizes four stakeholders in the software
reuse lifecycle, who are: component engineers,
domain engineers, application engineers, and
corporate manager.
• It recognizes decisions that each stakeholder
m
ust make in order to support a sustainable
reuse activity: the component engineer’s
decision to develop for reuse; the domain
engineer’s decision to initiate a domain analysis
activity; the application engineer’s decision to
avail herself of reusable assets; the corporate
manager’s decision to sustain a reuse based
development process.
• It m
odels each stakeholder’s decision as an
investment decision, which is quantified by
means of ROI functions.
• It
accounts for the way in which cost
information flows between the four investment
cycles. Figure 1 shows summarily how cost
factors are propagated from one investment
cycle to another.
In (Mili et al, 2000), (Mili et al, 2001); Mili et al
had di
scussed in what sense and to what extent the
proposed model encompasses (or does not
encompass) existing software reuse cost models.
Also, in (Chmiel et al, 2000), Chmiel et al discuss
how this cost models affords us the ability to
regulate the practice of reuse, not through
preaching/ lecturing/ arms-twisting, but rather
through a carefully tuned incentive and reward
structure, that consists in the following steps:
• Elu
cidate the equations that quantify the return
on investment of each of the four relevant
investment cycles.
• Identify controllable factors in
the cost models
of each cycle.
• Fi
ne tune the controllable factors so that all four
ROI functions take positive values (or values
that exceed some threshold).
• Link stakeholder rewards to
their respective
return on investments.
In this short paper, we briefly discuss extensions of
th
is model, by considering in turn conceptual
extensions and practical extensions:
• Co
nceptual Extensions: We augment the
existing model in two ways: first, while the
current model captures quality gains and
productivity gains of reuse, it fails to quantify
time-to-market gains. Second, while the
current model aims to fine tune controllable
factors so as to make all ROI positive, we
propose to maximize the corporate ROI under
the constraint that all four ROI’s are positive
(or greater than some threshold). Depending on
what factors we want to control, this produces a
linear or non-linear optimization problem.
• Pract
ical Extensions: We have developed a
product line of software reuse cost estimation
tools, using core ideas of the proposed cost
model and exploring how these can be adapted
to specific organizational requirements.
We discuss these extensions in the sequel.
264
Korkmaz M. and Mili A. (2007).
A PRODUCT LINE OF SOFTWARE REUSE COST MODELS.
In Proceedings of the Second International Conference on Software and Data Technologies - SE, pages 264-269
Copyright
c
SciTePress
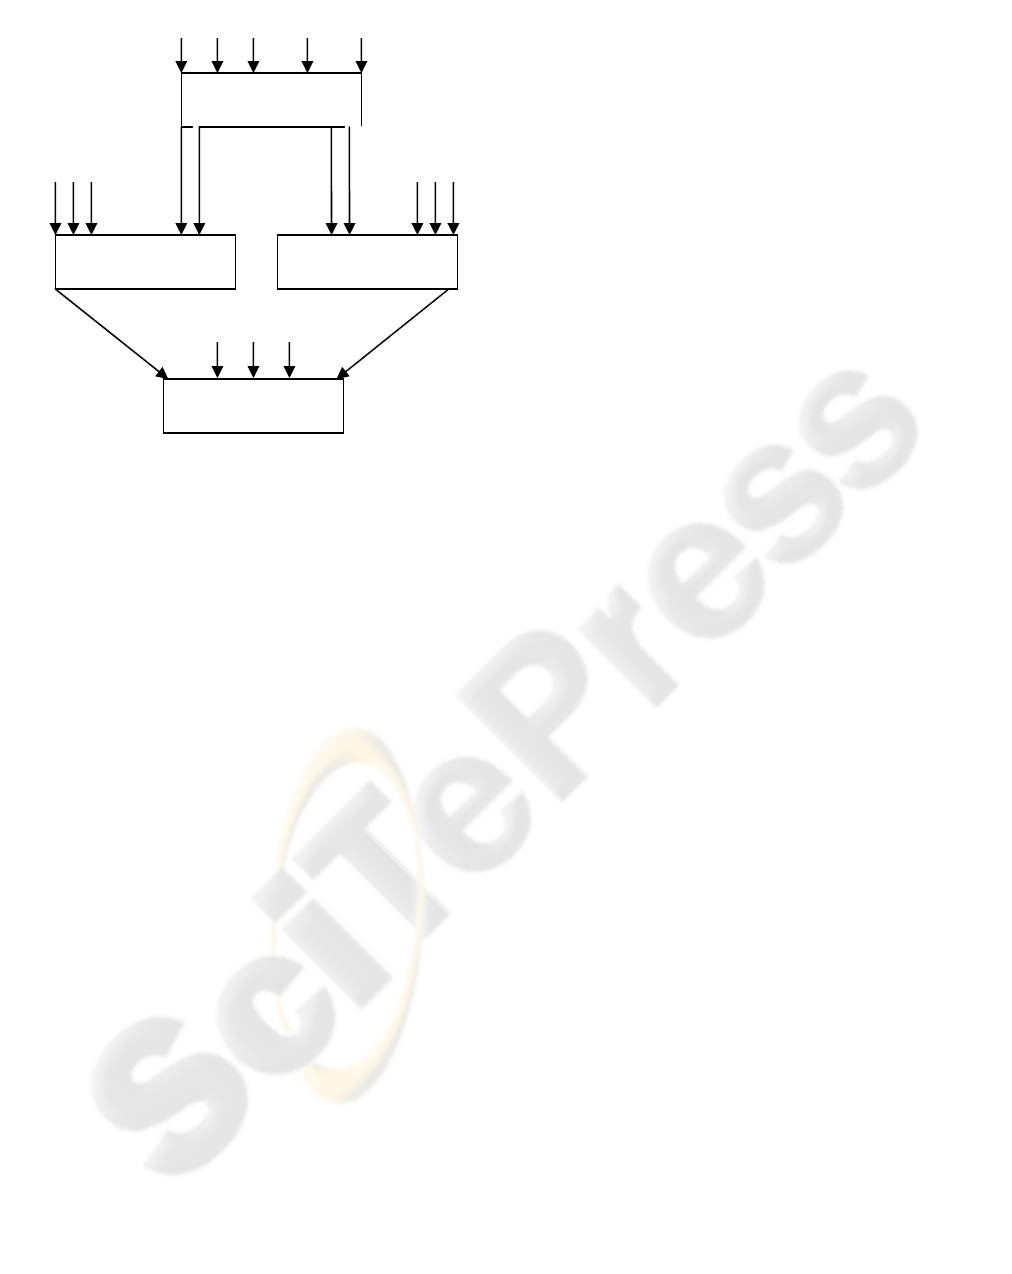
Figure 1: Cost Factor Propagation.
2 CONCEPTUAL EXTENSIONS
2.1 Optimizing Corporate ROI
We consider the cost structure shown in Figure 1.
Each ROI cycle is defined by five cost factors,
which are
• IC: the initial investment cycle,
• Y: the length of the investment cycle (e.g. 3
years, or 5 years, etc).
• d: the discount rate (e.g. 0.15).
• B(y), the benefits gained at year y, for 1≤y≤Y.
• C(y), the costs expended at year y, for 1≤y≤Y.
As a simplifying assumption, it is fair to assume that
parameters d and Y are defined organization wide as
part of the organization’s strategy, and are the same
for all stakeholders. We briefly define the
remaining factors for all stakeholders. For
component engineering, the investment cost is the
cost of development for reuse; the subsequent yearly
benefit is the benefit gained from component sales,
and the costs are the costs of maintenance of the
component. For domain engineering the investment
cost is the cost of domain analysis, the benefits and
costs of subsequent years is the sum of costs and
benefits of all the components that are part of the
domain. For Application engineering, the benefit at
year 0 is the productivity gain, and the benefit at
subsequent years is the quality gains (which we
quantify by savings in maintenance costs). At the
corporate level, investment costs are the costs of the
reuse infrastructure, the benefits at subsequent years
are the cumulative benefits of application
engineering, and the costs of subsequent years are
the cumulative costs of domain engineering. Domain
engineering benefits and application engineering
costs cancel each other at the corporate level, if we
assume that component trade happens internally (i.e.
domain engineering provides reusable assets only to
application. Engineering, and application
engineering acquires assets only from domain
engineering).
Component
Engineering
Application
Engineering
Domain
Engineering
Corporate
Management
d Y IC B(y) C(y)
d Y IC B(y) C(y) IC Y d
C(y) d Y IC B(y)
C(y) B(y)
Using these factors, we can quantify the return on
investment of the various cycles using any number
of formulas, including (Favaro, 1996): Net Present
Value (NPV), Return on Investment (ROI),
Profitability Index (PI), Average Rate of Return
(ARR), Average Return on Book Value (ARBV),
Internal Rate of Return (IRR), and Payback Value
(PB). We denote the return on investment function
(computed by whichever formula) by
,,,,
RADC
ROIROIROIROI
for (respectively) the component, domain,
application, or corporate investment cycle. We
formulate the require- ment of optimizing corporate
ROI in the following terms:
.
,
,
),(
ε
ε
ε
>
>
>
A
D
C
R
ROI
ROI
ROI
ROIMax
Depending on the formula selected for ROI, and on
the controllable factors that we are prepared to alter,
this produces a linear optimization problem or a
non-linear optimization problem. One possible
controllable factor that we have considered in this
study is the price of reusable assets. Normally, the
acquisition of reusable assets by the application
engineering team from the domain engineering
team, gives raise to a credit on the DE account and a
charge on the AE account. We have found that, to
be perfectly fair in distributing the benefits of reuse
between DE and AE, we ought to set the price of
reusable assets at about half their custom
development cost. In case where one of the ROI
values turns out to be negative, shifting this price in
the appropriate direction may ensure that all ROI’s
are positive. Other controllable factors are possible
as well.
2.2 Quantifying Time to Market
Composing an application from reusable assets
affords is productivity gains (in terms of saved
development effort), quality gains (in terms of
higher reliability/ availability and lower
A PRODUCT LINE OF SOFTWARE REUSE COST MODELS
265
maintenance costs) and time to market gains (in
terms of shorter production time). Hence for the
sake of completeness, the ROI of application
engineering ought to include time to market gains,
in addition to productivity gains and quality gains.
A survey of economics research has yielded little in
terms of quantitative models for the gains achieved
by going to market ahead of time. Broadly
speaking, there are two factors that must be
quantified: 1) the amount of sales achieved during
the period separating the early time to market (with
reuse) and the later time to market (without reuse);
2) the market share gained by getting to the
marketplace earlier than competing applications.
Whereas the first factor could perhaps be quantified,
the second factor is much harder to quantify, and its
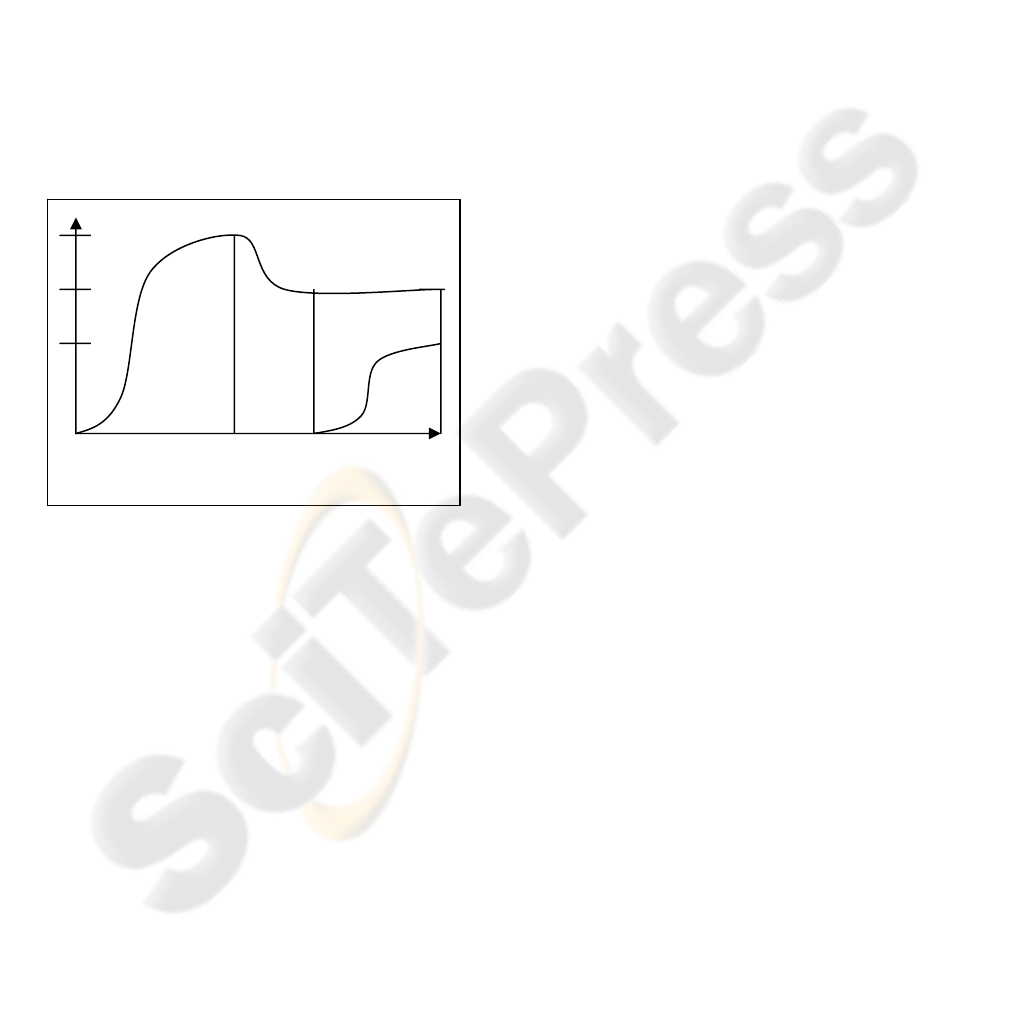
impact is much longer lasting. We have tentatively
modeled it by the curve shown in Figure 2.
Figure 2: Evolution of Market Share.
To analyze the impact of time to market on market
share, we consider two scenarios: a scenario where a
product is brought to market at time t0, and a
scenario where a product is brought to market at
time t2. Also, we imagine that a competitor arrives
on the market at a time t1 between t0 and t2. The
surface between the two curves represents the lost
sales that can be blamed on delayed time to market.
On the time (horizontal) axis, we can let t0 be 0, we
can estimate t2 using COCOMO-like schedule
equations and let Y be the investment cycle length;
the only unknown is t1, for which we can choose an
average value. On the vertical axis, none of the three
factors (m, n, k) is known or has a default value.
We can estimate m by expert judgment (how many
copies of this application do we estimate to sell per
unit of time?); we can assign heuristic values to n
and k (e.g. 2/3, 1/3). Validation of this model and
associated heuristics is under way.
3 PRACTICAL EXTENSIONS
We envision an automated tool that helps the
various stakeholders to estimate/ compute return on
investments, as well as to record, archive and track
costs and benefits of relevant activities. However,
due to the wide variability of possible user needs,
we resolve to develop this tool not as a single
product, but rather as a product line. Also, we have
resolved to use Weiss and Lai’s domain engineering
methodology, called FAST (Weiss et al, 1999).
3.1 Domain Scope
Broadly speaking, the purpose of our proposed
product line is to provide cost tracking and
estimating tools for a variety of clients, who may
have distinct specific needs. The purpose of an
application within our proposed product line is
multi-fold:
m
n
k
t0 t1 t2 Y
• Cost Tracking/ Archiving. Because return on
investment cycles are long term cycles, that
range over several years, it is impossible to
estimate costs without maintaining long term
cost information. The first function that we
envision for applications in our product line is
to maintain a database of cost factors,
pertaining to all four investment cycles, and
entered by appropriate parties among the four
stakeholders.
• Cost Estimation/ Prediction. The purpose of
this function is to estimate the return on
investment of the four stakeholders, on the
basis of archived cost information. This
function also supports what-if analyses,
whereby stakeholders can vary some
controllable factors (pertaining, for example, to
corporate strategy, incentive/ reward policies,
etc) to assess their impact on ROI estimates.
We also envision, although we have not
implemented it yet, a capability whereby we
derive controllable factors that optimize the
corporate ROI while keeping all ROI’s positive.
• Post Mortem Analysis. Whereas cost
estimation/ prediction assesses costs and
benefits using estimated cost factors, this
function can revisit calculations using actual
cost factors. For example, cost estimation uses
COCOMO (Boehm, 1981), (Boehm et al, 1995)
equations to estimate development costs (which
are then adjusted using reuse specific constants
to reflect development for reuse and
development with reuse (Poulin, 1997)), and
uses estimated reuse frequency figures to
ICSOFT 2007 - International Conference on Software and Data Technologies
266

estimate benefits. In the post-mortem analysis,
estimated are replaced by actuals, and the
economic merits of individual investment
cycles can be assessed accurately.
3.2 Commonalities and Variabilities
Commonalities among applications of our proposed
domain are well defined. The features discussed in
section 3.1 represent functional commonalities, and
the features discussed in section 1 (how the cost
model is structured as a set of nested investment
cycles, how costs are propagated from one model to
another, etc) represent structural commonalities.
Hence we focus our attention in this section on
dimensions of variability, which are listed below:
• The set of available ROI Functions. The client
organization may choose any subset of the ROI
functions that we have listed in section 1. The
choice of these functions may be dependent on
how the organization makes its investment
decisions. This decision had to be made at
application engineering time, rather than run-
time, because it affects the format of output
screens.
• Database Support. The client organization may
choose any of two candidate database systems,
namely SQL or Oracle. This decision has to be
made at application engineering time rather
than run-time, because it involves different
access routines and data formats, hence
different software packages.
• Reuse Organization. We have identified several
candidate reuse organizations, that may affect
the cost equations and the mechanisms of how
costs are charged or credited in an organization.
These include (Fichman, 2001): the library
model, the curator model, the product centered
model, the expert services model, and the reuse
factory model. The client organization may
select an organizational model among these,
and we adjust the equations accordingly.
• COCOMO Model. The client organization may
choose one of three versions of the COCOMO
model: Basic COCOMO (Boehm, 1981);
Intermediate COCOMO (Boehm, 1981) or
COCOMO II (Boehm
et al, 1995). This
decision has to be made at application
engineering time rather than run-time because it
affects data entry routines, as well as
calculations.
• Parameter Adjustment. The client organization
may decide whether cost estimation constants
are adjusted automatically, in light of archived
cost data, or only manually, from authorized
stakeholders. This decision has to be taken at
application engineering time rather than run-
time because it involves different control
processes within the application.
• Procurement Channels. The client organization
may choose a procurement channel whereby the
application engineering team gets components
only from the domain engineering team, and the
DE team provides components only to the AE
team; alternatively, it may allow external
procurement and external sales. This choice
involves different cost equations, and must be
implemented at application engineering time.
• Access Rights. The client organization may
choose different policies regarding the
management of the parameters of the cost
estimations (such as default values, investment
parameters, incentive structures, etc). One
policy could be that all these are under the
exclusive purview of corporate management; a
more flexible policy could delegate each set of
parameters to the stakeholder that knows best,
or has the greatest stake in each. This involves
complex variability in access rights.
• Optimization Parameters. If the user organiza-
tion chooses to implement the optimization
option, whereby the system can compute values
for the controllable factors that maximize
corporate ROI under constraints, then a number
of non trivial parameters must be fixed, which
pertain to the ROI formulas that have been
selected in the first variability (above) as well
as the controllable factors that have been
selected for the organization.
Some of these dimensions of variability are fairly
straightforward and can easily be supported at
application engineering time; others are fairly
complex
3.3 Reference Architecture
The choice of a reference architecture is perhaps the
most critical decision in the lifecycle of a product
line, as it determines the ease, and the costs of the
application engineering phase, as well as the quality
of produced applications. Decisions taken about
software architectures are usually driven by non
functional attributes, such as required reliability,
security, performance, safety, throughput, response
time, availability, etc.
Because this is reference architecture, another
requirement comes into play that must be added to
these considerations: The architecture must support
A PRODUCT LINE OF SOFTWARE REUSE COST MODELS
267

the application engineering activity by mapping
each dimension of variability into a pre-planned,
pre-verified, set of steps that must be taken to
implement the user’s selection along that dimension
of variability. In this work, we have adopted a
simple way to support variabilities, which is to map
each dimension of variability to a component of the
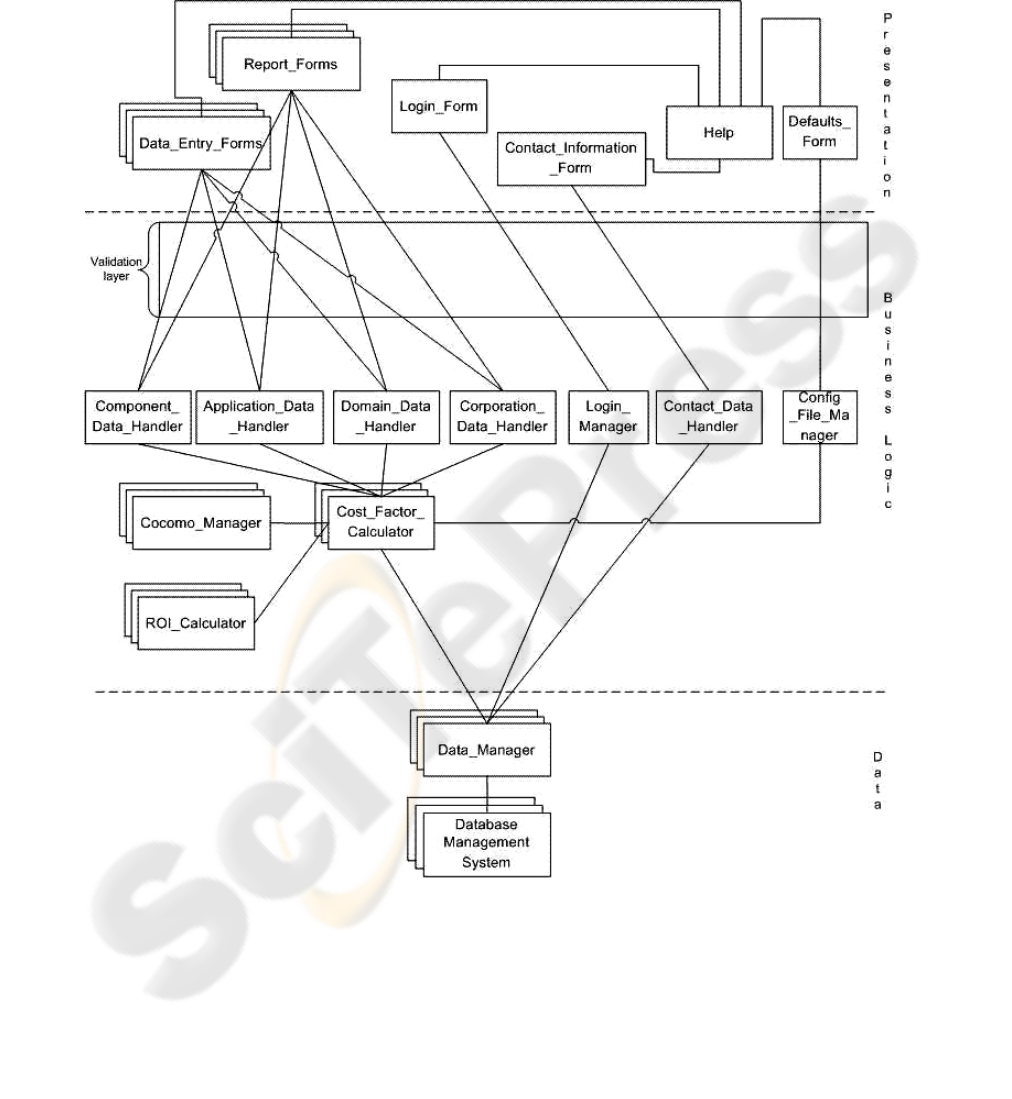
architecture. The proposed architecture is given in
Figure 3.
3.4 Variability Mappings
We have adopted a policy whereby each dimension
of variability that we offer is mapped to a specific
component of the reference architecture.
Specifically,
• ROI Functions. Once a client organization has
chosen a set of ROI functions, we modify the
ROI Calculator (Figure 2.3) and, perhaps
secondarily, the Report Forms component.
• Database Support. Once a client organization
has chosen a DBMS, we modify the Data
Manager to adapt to the selected system.
• Reuse Organization. As we envision it now, the
selection of the reuse organization affects the
Cost Factor Calculator; this component derives
the cost factors IC, d,
y
,
B(y)
, C(y), for the
appropriate cycle, and feeds them to the ROI
Calculator.
• COCOMO Model. The COCOMO Manager
component is modified according to the
selection of the client organization.
• Parameter Adjustment. The equations that are
used by the Cost Factor Calculator depend on a
host of constants that are derived from industry
experience
(Poulin, 1997). If the client
organization wishes, we can have these
constants adjusted in light of calculations made
by the tool; this is handled by the Configuration
File Manager.
• Procurement Channels. The choice of
procurement channels affects the calculation of
cost factors C(y) and B(y) for application
engineering and domain engineering. This
choice affects the Cost Factor Calculator.
• Access Rights. The selection of a policy of
parameter management affects the management
of access rights implemented by component
Login Manager.
• Optimization Parameters. This dimension of
variability is something of an exception, as we
could not encapsulate it into a single
architectural component, and changing the
architecture to map it into a single component
would be costly in terms of its impact on other
variabilities. As it stands now, this variability
affects the Cost Factor Calculator, the
Corporation Data Handler, and the
Configuration File Manager.
4 SUMMARY AND
CONCLUSIONS
In this paper, we have extended our past work on
modeling software reuse costs in two directions.
Conceptually, by integrating a quantification of time
to market gains into the ROI of application
engineering; and by adding a capability that allows
the model to fine tune controllable factors so as
maximize the corporate ROI while keeping all
stakeholder ROI’s positive (or greater than a
predefined threshold). We have also considered a
practical extension, which consists of developing a
product line of software reuse cost estimation tools,
which support a wide range of variability in user
requirements. Most of the functionality discussed in
this paper is currently operational, and can be
demonstrated, including the ability to produce
applications to specific requirements. To this effect,
we have developed an Application Generation
Environment, similar to the environment that Weiss
and Lai produce in (Weiss et al, 1999) for the
floating weather station. This environment takes
prespecified variability parameters and
automatically generates code according to the
parameter values.
REFERENCES
B. Boehm, 1981. Software Engineering Economics.
Prentice Hall, Englewood Cliffs, NJ.
B. Boehm, B. Clark, E. Horowitz, C. Westland, R.
Madachy, and R. Selby, September 1995. Cost models
for future software lifecycle processes: COCOMO 2.0.
Annals of Software Engineering, 1:57–94.
S. F. Chmiel and A. Mili, October 2000. Estimating
software reuse costs. In Fifteenth International Forum
on COCOMO and Software Cost Estimation, Los
Angeles, CA. University of Southern California.
J. Favaro, April 1996. A comparison of approaches to
reuse investment analysis. In Proceedings, Fourth
International Conference on Software Reuse, pages
136–145, Orlando, FL.
A. Mili, S. F. Chmiel, R. Gottumukkala, and L. Zhang,
June 2000. An integrated cost model for software
reuse. In Proceedings, International Conference on
ICSOFT 2007 - International Conference on Software and Data Technologies
268
J. Poulin, 1997. Measuring Software Reuse: Principles,
Practices and Economic Models. Addison Wesley.
Software Engineering, pages 157–166, Limerick,
Ireland. IEEE Computer Society Press.
D. M. Weiss and C. T. R. Lai, 1999. Software Product
Line Engineering. Addison Wesley.
A. Mili, S. F. Chmiel, R. Gottumukkala, and L. Zhang, 11,
2001. Managing software reuse economics: An
integrated roibased model. Annals of Software
Engineering.
Robert G. Fichman, Apr 27, 2001. Incentive Compatibility
and systematic software reuse, Journal of Systems and
Software, New York
Figure 3: Reference Architecture.
A PRODUCT LINE OF SOFTWARE REUSE COST MODELS
269
