
A COMPARISON OF STRUCTURED ANALYSIS AND OBJECT
ORIENTED ANALYSIS
An Experimental Study
Davide Falessi, Giovanni Cantone
University of Roma "Tor Vergata", DISP, Viale del Poliecnico N.1, Rome, Italy
Claudio Grande
ICT Consultant
Keywords: Software Engineering, Object Oriented Analysis, Structured Analysis, Empirical Software Engineering.
Abstract: Despite the fact that object orien
ted paradigm is actually widely adopted for software analysis, design, and
implementation, there are still a large number of companies that continue to utilize the structured approach
to develop software analysis and design. The fact is that the current worldwide agreement for object
orientation is not supported by enough empirical evidence on advantages and disadvantages of object
orientation vs. other paradigms in different phases of the software development process. In this work we
describe an empirical study focused on comparing the time required for analyzing a data management
system by using both object orientation and a structural technique. We choose the approach indicated by the
Rational Unified Process, and the Structured Analysis and Design Technique, as instances of object oriented
and structured analysis techniques, respectively. The empirical study that we present considers both an
uncontrolled and a controlled experiment with Master students. Its aim is to analyze the effects of those
techniques to software analysis both for software development from scratch, and enhancement maintenance,
respectively. Results show no significant difference in the time required for developing or maintaining a
software application by applying those two techniques, whatever is the order of their application. However
we found two major tendencies regarding object orientation: 1) it is more sensitive to subjects’ peculiarities,
and 2) it is able to provide some reusability advantages already at the analysis level. Since such result
concerns a one-hour-size enhancement maintenance, we expect significant benefits from using object
orientation, in case of real-size extensions.
1 INTRODUCTION
1.1 Background
In software development, analysis is the process of
studying and defining the problem to be resolved.
Once defined the requirements that the system is
specified to perform, analysis involves discovering
the underlying assumptions with which the system
has to fit, and the criteria by which it will be judged
a success or failure.
Any method that is able to deal in a
str
uctured way with software analysis, e.g.
Structured Analysis and Design Technique (SADT)
(DeMarco, 1978), is both a language and a software
process for systems analysis: while the language is
defined with some levels of formality, the software
process is usually defined quite informally.
The object-oriented (OO) paradigm provides
a powe
rful and effective environment for analyzing,
designing, and implementing flexible and robust
real-world systems, offering benefits such as
encapsulation (information hiding), polymorphism,
inheritance, and reusability (Jacobson, 1999)
(Booch, 1998). The OO and SADT methods provide
their own representational notations for constructing
a set of models during the development life cycle for
a given system. Both SADT and OO provide
techniques and constructs to model an information
processing system in terms of its data and the
processes that act on those data. OO models focus
on objects while SADT models focus on processes.
Moreover, “the fundamental difference is that while
213
Falessi D., Cantone G. and Grande C. (2007).
A COMPARISON OF STRUCTURED ANALYSIS AND OBJECT ORIENTED ANALYSIS - An Experimental Study.
In Proceedings of the Second International Conference on Software and Data Technologies - SE, pages 213-221
DOI: 10.5220/0001336602130221
Copyright
c
SciTePress

OO models tend to focus on structure, PO (i.e.
SADT) models tend to emphasize behavior or
processes.” (Agarwal, 1999). One of the main
benefits of the OO approach is that it provides a
continuum of representation from analysis to design
to implementation, thus engendering a seamless
transition from one model to another.
In this work we have chosen the Rational
Unified Process
®
(RUP
®
) as instance of the OO
software processes. The RUP (Kruchten, 2003)
(Jacobson, 1999) captures many of the best practices
in modern software development. RUP embeds
object-oriented techniques and uses UML as a
principal notation for the several models that are
built during the development. RUP is not only an
iterative process, but also based on the concept of
use case and object oriented design method; it has
gained recognition in the software industry and has
been adopted and integrated by many companies
world-wide. RUP, in its original and extensive
formulation, is a properly defined process, which
includes workflows for almost software disciplines
of any kind, including Requirement Definition, and
Software Analysis. In the remaining, we will be
concerned with the latter, on one side, and the SADT
analysis, on the other side. In order to simplify the
notation, let us denote them with OOA and SAT,
respectively.
1.2 Problem Statement and Research
Goal
Nowadays, almost all academic software courses
recognize the OO paradigm, and many software
organizations widely adopt it to enact all the several
phases of their development process. Currently, the
agreement for object orientation is worldwide
diffused.
Compared with such a diffusion of the object
orientation, there is not enough empirical evidence
on advantages and disadvantages for using OO, and
in different phases of the software development
process.
To the best of our knowledge, while there are
studies that compared OO and SAT notations for
comprehensibility, there is no study published which
analyzed comparatively the productivity of OOA
and SAT in modeling development from scratch and
enhancement maintenance of software systems,
respectively. Moreover, there is not enough data,
which the research community can access for
developing quantitative evaluation, providing
empirical rules, eventually laws, about pros and cons
of methods for software analysis, and related
contexts, and objective/subjective circumstances
where those advantages and disadvantages appear.
As a result, we decided to start collecting data
from projects of our junior students in OOAD and
RUP classes of the Magisterial Degree (this shares
some commonalities with post-graduate two-years
Master Degree) in the DISP at the University of
Rome Tor Vergata. However, this approach resulted
insufficient for getting reliable data, because of the
junior students’ project variability.
In order to make the collected data reliable,
and hence significantly comparable data relating
different projects, we eventually made the further
decision to put in place and train senior students of
Experimental Software Engineering on one more
analysis technique, and to arrange experiments for
keeping in control the software processes, and the
product’s user needs, analysis, and features enacted.
We choose SAT as the additional analysis
technique not because we believe this technique
really able to compete with OOA, but it is still
largely used by companies, has been a milestone in
the recent history of software analysis and design,
and last but not least a mature professional,
experienced with SADT, offered to cooperate with
us to train and observe the experiment subjects. As a
consequence, because SADT does not emphasize on,
or include a formal definition for, requirements
specification and change management, we had to
plan the exclusion from any further consideration of
the effort that RUP subjects would spent in
requirements by using Requisite-Pro
®
. Because we
kept user needs of a small-size application from the
training literature, utilized it as the experiment
object, and SADT is generally less formal than RUP,
our expectation was that RUP should require more
effort than SADT when developing small-medium
size software systems from scratch , or enacting
limited maintenance interventions.
Formally, according to the GQM template
(Basili, 1994), the goal that we set for the presented
study is to analyze the analysis phase of a software
system for the purpose of evaluation of two different
approaches with respect to required time from the
point of view of the researcher in the context of post-
graduate Master students of software engineering.
1.3 Related Work
The literature provides several studies comparing
SAT and OO methodologies; these studies can be
divided on empirical studies and descriptive studies.
1.3.1 Empirical Studies
Agarwal (Agarwal, 1999) described an empirical
study comparing user comprehension of models
provided by the application of OO and SAT
techniques. Results show that “for most of the
ICSOFT 2007 - International Conference on Software and Data Technologies
214

simple questions, no significant difference was
observed insofar as model comprehension is
concerned. For most of the complex questions,
however, the SAT model was found to be easier to
understand than the OO model.”
Vessey and Conger (Vessey, 1994) found that
novice systems analysts prefer the SAT for
requirements specification.
Wang (Wang, 1996) described an experiment to
compare an OO method with a data flow diagram
method (SA), regarding the effectiveness in the
analysis phase. Results show that OO seems to be
more difficult to learn but, as soon as it is known, it
provides more accurate answers than the SA.
1.3.2 Descriptive Studies
Wieringa (Wieringa, 1998) proposed a huge survey
on the state of the art of structured and object-
oriented methods with the aim to reveal
opportunities for combining the two kinds of
notations. Hence, he “identifies the underlying
composition of structured and object-oriented
software specifications, investigates in which
respects object-oriented specifications differ
essentially from structured ones”.
Fichman and Kemerer (Fichman and Kemerer,
1992) used a taxonomy of eleven modeling
dimensions for comparing three SAT with three OO
analysis techniques. Their aim was to propose
several areas of improvement; in fact, in that
software age, OO paradigm was still promising but
not yet standardized.
Sutcliffe (Sutcliffe, 1991) described five OO
methods using five OO features (i.e. abstraction,
classification, inheritance, and encapsulation) and
eight SAT methods using the same OO features plus
three SAT features (i.e. functions, data, events)
However, “the discussion is very sketchy and there
are no clear conclusions.” (Wieringa, 1998).
2 STUDY PLANNING
2.1 Definition
Based on the problem statement previously
described (see Section
1.2) we aim to address the
following two research questions:
1) Which of the two approaches (OOA or SAT) is
more productive (i.e. requires less time, hence
allows greater efficiency) in enacting the
analysis of a small/medium size information
management system?
2) In case we ask subjects to apply the pair of
OOA and SAT analysis models to a given
software system, which order of execution
(OOA_SAT, or SAT_OOA) requires less time?
This should also help to understand whether it
is easier to learn SAT for a RUP experienced
analyst, or vice versa OOA for an SAT
experienced analyst.
We tried to address previous questions in two
specific scenarios: development from scratch, and
enhancement maintenance.
From the research questions above, the following
research null hypotheses (resp. alternative
hypotheses) follow for the presented study. When
SAT and OOA are applied, no significant difference
(H
0--
) (resp. significant difference, H
1--
) can be
observed between the times that they require,
respectively, for analysis of small/medium-size
software systems to be developed from scratch (H
--D
)
(resp. maintained for enhancement, H
--M
) by using
one technique (H
-T-
), or a pair in random order
(H
-O-
). Hence, there are four null hypotheses for the
experiment: H
0TD
, H
0TM
, H
0OD
, and H
0OM
.
Concerning the independent variables, regarding
the null hypotheses H
0TM
and H
0TD
, in which subjects
apply one approach to the same object, the analysis
approach is the factor; the treatments are OOA and
SAT. Regarding the null hypotheses H
0OM
and H
0OD
,
in which subjects apply the pair of approaches in
some order to the same object, the order of access of
subjects to those analysis approaches for
employment is the factor; the treatments are
OOA_SAT and SAT_OOA.
The dependent variable is the time elapsed in
enacting an experiment task (analysis), expressed in
minutes.
In order to evaluate the impact of those analysis
approaches, we adopted two experimental
environments: a strictly controlled one to develop
the analysis of a system from scratch, and a less
controlled environment for the analysis of an
enhancement maintenance, respectively.
2.2 Context
Travel assistance is the application domain of the
present study. In particular, the project that we
adopted is a software system aimed to assist friends
to organize travels issues like destination, date, and
transportation. People in the group might have
different needs and status, e.g. some of them could
be adults with children. The system allows (i) the
person in charge to organize the trip to define the
travel plan and the deadline for registering, (ii) other
group members to propose trip variants or place
requests and constraints, and join the basic trip or
one of the variants proposed, (iii) negotiation
features. When the deadline expires the person in
A COMPARISON OF STRUCTURED ANALYSIS AND OBJECT ORIENTED ANALYSIS - An Experimental Study
215

charge to organize the trip is enabled to place
reservations for all the group members that joined.
Fifty attendees of the Experimental Software
Engineering post-graduate course in their second
and last year of Magisterial Degree, participated in
our work as experiment subjects, performing in the
role of software analyst. While most of those
subjects had some experiences at software
companies, only few can be considered as software
professionals. However, all the subjects had already
attended the university course on software analysis
and design and RUP software process. In such
course they individually developed a small project
from scratch by using UML, executing RUP, and
applying the Model-View-Controller architectural
pattern. According to the classification scheme
proposed by Höst et al. (Höst, 2004) experience and
incentive of subjects can be classified respectively as
“Graduate student with less than 3 months recent
industrial experience” (E2) and “Artificial
project”(I2).
2.3 Material and Tasks
As already mentioned, the present study consists in
two experiments: E1) Analysis for a new software
application system, E2) Analysis for functional
extension of that application system. Each subjects
applied both OOA and SAT in both the experiments;
however we arranged for mitigating the impact of
learning effect, as explained by the following
Section
2.4.
Each subject received the same material: rules
and constraints of the study (e.g. deadline), system
requirements, the required detail level of the analysis
to provide, a form where to record the time spent in
the analysis phase. Each subject worked
autonomously, in the preferred place, and in a
controlled environment (i.e. class room) during
experiments E1 and E2, respectively.
Subjects used paper support to enact the analysis
phase employing the SAT technique because they
had no chance to use for free any modeling tool in
SADT notation. Subjects used RequisitePro
®
, for
Requirement Specification, and Rose
®
to enact the
analysis phase using the RUP approach. In fact, the
RUP
®
includes the discipline of Requirement
specification; however, as already mentioned, SADT
does not formalize on the usage of such a discipline.
Consequently, the inclusion of times spent for
requirement specification, in the comparison of
those approaches, would not be fair and it would
eventually result into a strong advantage of SADT
vs. RUP
P
®
and the utility diminishing of the
comparison. Hence, we stress how in this study we
do not take into account the time that subjects spent
to use RequisitePro
®
when enacting the OOA
approach. Accordingly, we take into account the
time that they employed in using Rose
®
to provide
UML analysis diagrams, including: a general class
diagram, the view of participating classes per use
case, and some sequence diagrams per use case. In
other words, in this study we compare the time
required to produce SADT models (including the
amount of time needed for understanding but not
write the user needs) with the time required to
produce UML analysis using the RUP
®
(as soon as
that the same subject had already developed the
requirement specification).
2.4 Experiment Design
The first experiment regards the analysis of a data
management system to develop from scratch. Once
explained the type of work requested, and given the
user needs to subjects, then we invited them to work
in their favorite place and at time that they preferred.
We just placed a deadline as light as a couple of
weeks for product completion and delivery.
The second experiment regards the analysis of
enhancement maintenance on the previous analyzed
data management system. Such a second experiment
was enacted in a controlled environment; in fact,
subjects worked individually in classroom with the
continual presence of observers.
The experiment object was one for each
experiment and the same to all subjects.
The participant subjects were alphabetically
sorted for family and given names for the first and
second experiment respectively. Subsequently an
index was randomly selected as the head, i.e. the
first item, of the circular list of those names. In both
experiments, subjects with an even order applied the
SAT technique while subject with an odd order
applied OOA; after the application of the first
approach the subjects switched to apply the other
one (i.e. SAT for subjects in odd position, OOA for
subjects in pair order). We specified to apply both
the experiment treatments (i.e. analysis approaches)
just to analyze the effects, if any, of the application
order on productivity. Hence, we stress that we
discarded data, which relate to second applications
of an approach by the same subjects, from the data
set that we utilized to evaluate the impact, if any, of
treatments on productivity (i.e. H
0TD
, H
0TM
).
Consequently, both the experiments had a
randomized design (Wohlin et al., 2000); reasons in
support of such a type of design in respect to a
paired design are:
1) The research questions allow the randomized
design.
2) The randomized design mitigates the effect of
learning which in our case was expected to be
predominant because the two approaches (i.e.
ICSOFT 2007 - International Conference on Software and Data Technologies
216

treatments) share many concepts. A subject,
after applied an approach for analyzing a
system, should become aware of the system
boundaries and structure; then he will be able to
use such knowledge while applying the second
approach. This does not apply to randomized
design while it would hugely threaten the result
validity of paired design.
3) One of the main disadvantages of a randomized
design is the larger size of the requested
sample. However, in our case, the number of
participating subjects was large enough (i.e.
fifty) to allow a valid statistical analysis in case
of paired design.
4) An advantage of paired design concerns
balancing the impact of subjects’ peculiarities.
Because we had homogenous participating
subjects, who shared several issues like age,
geographic, and education, then such advantage
was not relevant in our case.
2.5 Preparation
Over several years we gained experience in
conducting experiments. Such an experience helped
in: (1) designing and implementing the experiment
objects, (2) setting the experiment laboratory, (3)
motivating, (4) and training students. Regarding the
training phase we:
1) Chose four hours, which we split in two
sessions. During the first session we described
the principles of SAT. During the last session
we presented an example of SAT application,
which actively involved subjects in applying
that technique.
2) Avoided to use terms which in the past we
realized misunderstood.
3) Clearly denied the students’ expectations
regarding the experiment.
4) Omitted the description of our expectations.
5) Carefully checked that all the experimental
subjects attended both training sessions.
2.6 Execution
The experiments’ materials and assignments were
delivered via the website of the university course.
Subsequently each subject applied both approaches
in a specific order for developing the analysis of a
software system from scratch (i.e. E1), and then of
the enhancement maintenance (i.e. E2) by using the
outcome of E1.
At experiment conduction time, the
experimenters joined the observers to give public
answer to general participants’ questions.
Subjects autonomously applied the treatments
assigned and they fulfilled the individual form. Such
materials were delivered from subjects to us by
using CD-ROM support.
2.7 Analysis Procedure
We analyzed the four null hypotheses of the
present study by applying the steps that the literature
suggests and the ESE research community well
agrees (Wohlin et al., 2000). During the first step,
we analyzed the data set for reduction, as better
described in the following (see Section
3.1). Then
we described data using the box and plot formalism
(see Section
3.2). Eventually, we applied statistical
tests by enacting the following standard steps:
1) To check for normality the distribution of each
reduced data set by analyzing the lowest P-
Value that the application of the following
statistical tests delivers: Chi-Square goodness-
of-fit, Shapiro-Wilks W, Z score for skewness,
Z score for kurtosis. A data set will be
considered as not normally distributed in case
its lowest P-Value is less than 0.1.
2) To apply the Mann-Whitney non-parametric
test, in case at least one data set resulted to be
not normally distributed, or a parametric tests
(i.e. T-test, F-test) otherwise.
3) To evaluate data sets for differences: we
considered two data distributions as
significantly different in case the test at point 2
above delivered a P-Value less than 0.05 or as
not significantly different otherwise (i.e. P-
Value greater or equal to 0.05).
3 DATA ANALYSIS
3.1 Data Set Reduction
In order to find data, if any, which would negatively
impact the quality of a data set, and hence the
experiment results, we enacted a validity check and
a statistical check.
During the validity check, the experimenters
validated data by analyzing the suitability of the
fulfilled forms and the developed models. Those
forms were checked based on logical constraints
(e.g. all the data were coded in a valid format).
Those forms were checked for conformance to the
standards described in the assignments; in other
words, we checked the fulfilled forms in order to
discard the ones showing extremely bad or good
quality. As a result from such an activity, no invalid
data was found.
A COMPARISON OF STRUCTURED ANALYSIS AND OBJECT ORIENTED ANALYSIS - An Experimental Study
217
During the statistical check, the
experimenters look at box plots for statistical
outliers. They were able to find six outliers, which
were discarded from further any statistical analysis.
The choice of neglecting outliers is compatible with
the usage of randomized design for the experiments:
in fact – for what concerns this point – each subject
applied one treatment; hence his or her peculiarities
could influence just that treatment out of the two.
Such a statistical check may mitigate the influence
of such unbalanced influences.
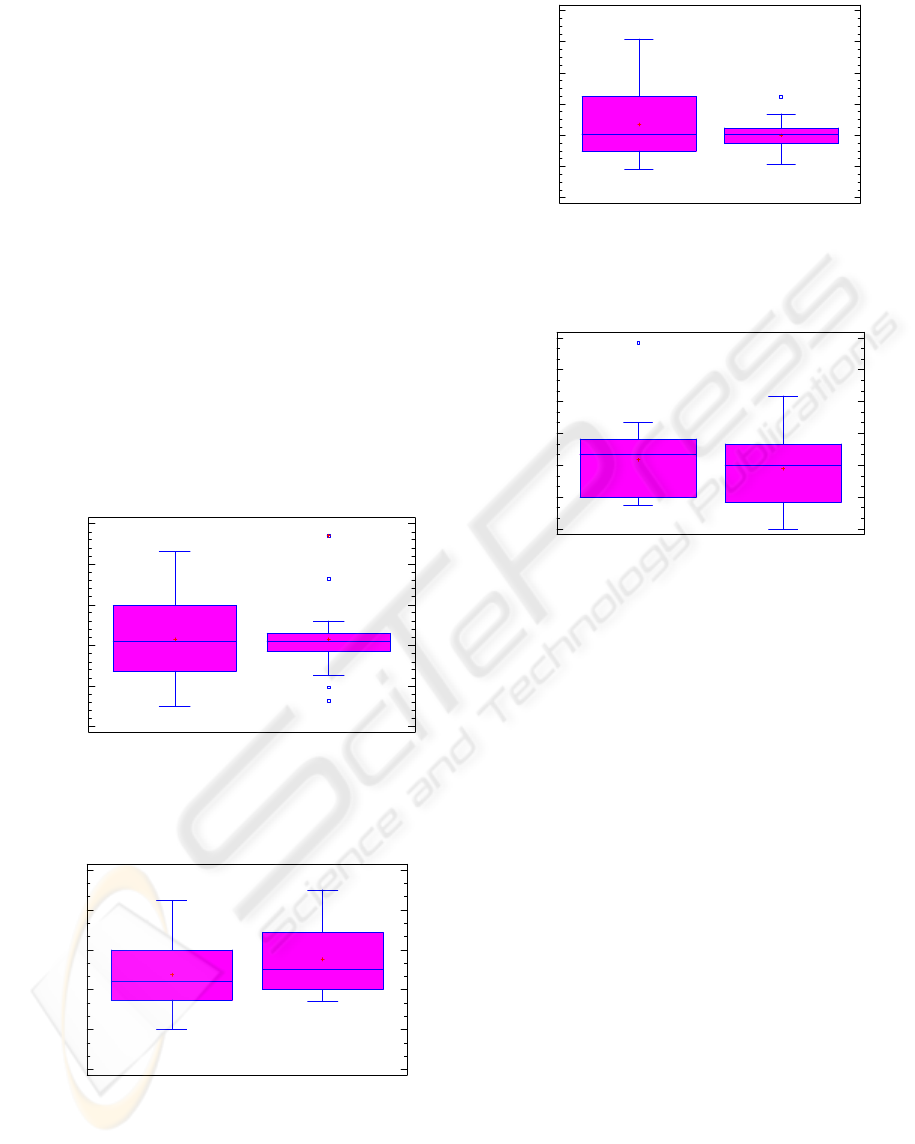
3.2 Descriptive Statistics
Box and Plots diagrams in Figure 1 and Figure 2
describe the amount of time that subjects spent to
model the development from scratch, and the
enhancement maintenance, respectively, by using
one of the analysis approaches as experiment
treatment.
Figure 3 and Figure 4 describe the amount
of time that subjects spent for enacting the same
tasks by using both treatments in the specified order.
Minutes
0
100
200
300
400
500
OOA SAT
Figure 1: Time spent analyzing an information
management system for development from scratch by
using OOA or SAT.
Minutes
0
30
60
90
120
150
OOA SAT
Figure 2: Time spent analyzing an information system for
enhancement maintenance by using OOA or SAT.
Minutes
0
200
400
600
800
1000
1200
OOA_SAT SAT_OOA
Figure 3: Time spent analyzing an information
management system for development from scratch by
using OOA and SAT in some order.
Minutes
70
100
130
160
190
220
250
OOA_SAT SAT_OOA
Figure 4: Time spent analyzing an information system for
enhancement maintenance by using OOA and SAT in
some order.
3.3 Hypothesis Testing
3.3.1 H
0TD
: OOA VS. SAT for a New System
In order to test hypothesis H
0TD
, we compare the
samples concerning the required time to model
analysis for development from scratch using OOA or
SAT approaches. For the normality tests, which we
applied to both the given data sets, the lowest P-
Value was 0.252985, and it was provided by the
Chi-Square test on data concerning the application
of SAT technique. Because such a value is higher
than 0.1, we cannot reject the hypothesis that such a
distribution comes from a normal distribution with
the 99% confidence level. Accordingly, we applied
both the T-test and the F-test to those samples of
data. The former provided a P-Value of 0.924103;
because this is greater than 0.05, we can conclude
that there is not a statistically significant difference
between the means at the 95.0% confidence level.
Hence, we cannot reject the null hypothesis that
there is no difference in the required time for
analyzing a new system using SAT or OOA.
However the F-test provided a P-Value of 2,88597E-
8; because this is much lower than 0.05, we can
assert that there is a statistically significant
ICSOFT 2007 - International Conference on Software and Data Technologies
218

difference between the standard deviation at the
95.0% confidence level.
3.3.2 H
0TM
: OOA VS. SAT for Enhancement
Maintenance
In order to test hypothesis H
0TM
, we compare the
samples concerning the required time to model the
enhancement maintenance of a system using OOA
or SAT. For the normality tests, which we applied to
both the given data sets, the lowest P-Value was
0.0857048, and it was provided by the Shapiro-
Wilks test on data concerning the application of the
SAT technique. Because such a value is less than 0.1
we can reject the idea that the data set distribution
comes from a normal distribution with the 99%
confidence level. Accordingly we applied the Mann-
Whitney test, which provided a P-value of 0.200631.
Because such a P-value is greater than 0.05, we can
assert that there is not a statistically significant
difference between the medians at the 95.0%
confidence level. Hence, we cannot reject the null
hypothesis that the required time for modeling
enhancement maintenance using SAT and OOA is
equal.
3.3.3 H
0OD
: OOA_SAT VS. SAT_OOA for a
New System
In order to test hypothesis H
0OD
, we compare the two
samples concerning the required time to model a
analysis for development from scratch using both
SAT and OOA in some order, OOA_SAT or
SAT_OOA. For the normality tests, which we
applied to both the given data sets, the lowest P-
Value was 0.0223927, and it was provided by the
Shapiro-Wilks test on data concerning the paired
application of OOA and SAT in such order. Because
that P-Value is less than 0.1, we can reject the idea
that data come from a normal distribution with the
99% confidence level. Accordingly, for those
samples of data we applied the Mann-Whitney test,
which provided a P-value of 0.200631. Because this
is greater than 0.05, we can assert that there is not a
statistically significant difference between the
medians at the 95.0% confidence level. Hence, we
cannot reject the null hypothesis that it is equal the
time required for modeling a system from scratch
using any pair of approaches, SAT_OOA and
OOA_SAT.
3.3.4 H
0OM
: OOA_SAT VS. SAT_OOA for
Enhancement Maintenance
In order to test hypothesis H
0OM
, we compare the
two samples concerning the required time to model
the enhancement maintenance of a system using
both SAT and OOA in some order, OOA_SAT or
SAT_OOA. For the normality tests, which we
applied to both the given data sets, the lowest P-
Value was 0.0300696 and it was provided by the
Shapiro-Wilks test on data concerning the order of
application OOA_SAT. Because such P-Value is
less than 0.1, we can reject the idea that such a
distribution comes from a normal distribution with
the 99% confidence level. Accordingly, for those
samples of data we applied the Mann-Whitney test
which provides a P-value of 0,677857. Because such
a P-value is greater than 0.05, we can assert that
there is not a statistically significant difference
between the medians at the 95.0% confidence level.
Hence, we cannot reject the null hypothesis that it is
equal the required time for modeling the extension
of a system using any pair of approaches,
SAT_OOA and OOA_SAT.
4 DISCUSSION
4.1 Evaluation of Results and
Implications
4.1.1 H
0TD
: OOA VS. SAT for a New System
By analyzing Figure 1 we can observe a little
difference in the results from applying OOA or SAT
for modeling a system from scratch. In fact, we
observed that means and medians of the two data
sets are one each other very close, respectively.
However, we observe a significant difference in the
way the data set is distributed. In fact, the data set,
related to the application of OOA, is more spread
than the one related to the application of SAT.
Statistical analysis confirms such observation. These
results can be interpreted as follows: concerning the
time required for modeling a new system, OOA is
more sensitive than SAT to subjects peculiarities
but, in the average, those approaches show quite
equal performances.
4.1.2 H
0TM
: OOA VS. SAT in an
Enhancement Maintenance
By analyzing Figure 2 we observe a little difference
in the results of applying OOA or SAT for modeling
the extension of a system. However, regarding the
means and the medians, the required work time is
higher for SAT than OOA. Statistical analysis
confirms that such a difference exists but it is not
enough significant. Hence, we conclude that, in case
of maintenance, the OOA seems to provide more
reusability regarding the system models rather than
A COMPARISON OF STRUCTURED ANALYSIS AND OBJECT ORIENTED ANALYSIS - An Experimental Study
219

the SAT. The small amount of difference between
the two techniques would be motivated by the fact
that the maintenance used in the present study
required just around one hour. In general, it is agreed
that the complexity of applying enhancement
maintenance grows at least in a liner manner to the
amount of maintenance. Hence, we expect that real
maintenance tasks, which are usually larger than the
one used in the experiment (i.e. just one hour),
would significantly benefits by using RUP rather
than SAT, regarding the time needed to model the
extended system.
4.1.3 H
0OD
: OOA_SAT VS. SAT_OOA for a
New System
By analyzing Figure 3 we observe a little difference
in the results of applying RUP and SAT in a specific
order, for modelling a new system. In fact, the
medians are quite the same while the means are a
little bit different. Statistical analysis confirms the
absence of significant difference. Hence we interpret
the data by noticing no difference in the order of the
application of the two techniques, regarding the
required time to model a new system.
4.1.4 H
0OM
: OOA_SAT VS. SAT_OOA for
Enhancement Maintenanc
e
By analyzing
Figure 4 we can see not too many
differences in the results of applying RUP and SAT
in a specific order, for modeling an extended system.
Infect, we observe that mean and median of on set of
data are very close to the ones of the other set.
Statistical analysis confirms the absence of any
difference. Hence we interpret the data by noticing
no difference in the order of the application of the
two techniques, regarding the required time to model
an extended system.
4.2 Validity Evaluation
In this section, we discussed the way in which we
face our result validity threats (Wohlin et al., 2000);
such description helps readers in quantifying the
generalizability of the described results.
4.2.1 Conclusion Validity
Low statistical power: we adopted a standard
threshold for rejecting hypotheses (i.e., P-
Value=0.05).
Violated assumption of statistical tests: we applied
a standard statistical analysis (see Section
2.7).
Fishing: all the performed analyses were planned
before the execution of the experiment, hence before
start to handle the result. Moreover, reasons for the
performed analysis rationally follow the research
objectives (see Section
2.1).
Random irrelevances: the experiment design was
randomized and subjects applied only one treatment
(analysis technique); hence subjects’ peculiarity may
influence the results. However, we did not perceive
any disturbs during the experiment execution.
Random heterogeneity: subjects were almost
homogeneous in different aspects because they share
a university course.
4.2.2 Internal Validity
History: we did not have this type of threats since
subjects applied only one treatment.
Maturation: The second experiment was designed
for letting the subjects concentrated during all its
duration.
4.2.3 Construct Validity
Mono-operation bias: In order to face other treats
we adopted only one object. We used only one type
of measures but in order to cross-check the results
we discussed randomly interview subjects.
Hypotheses guessing and experimenter
expectancies: we do not have any expectancy nor
guess.
Low motivation and evaluation apprehension: We
tried to encourage subjects to run the experiment
with the highest concentration while avoiding
evaluation apprehension by clearly describe them
that they would not be evaluated for their answers
(since such answers are subjective and hence not
objectively judgeable) but in case they would not be
enough concentrated on running the experiment
(funny behaviours) then they would be expelled. The
experience in similar experiments make past
students (i.e. past subjects) spontaneously and
effectively assure the new subjects that they will not
be evaluated based on the answers.
4.2.4 External Validity
Social factors: Sometimes preferences of the
companies for a particular methodology or for any at
all are driven by many forces, not only by the
relative efficiency of one particular technique, but it
ICSOFT 2007 - International Conference on Software and Data Technologies
220

is usually driven by social factors characterizing the
specific context (Baskerville, 1996).
Interaction of selection and treatment: all the
subjects already attended the university course on
software analysis and design.
Interaction of setting and treatment: The adopted
treatments (i.e. RUP and SADT) are generally
considered standard OO and structured paradigm
instances, respectively. The objects were designed to
face other threats (i.e. experiment feasibility).
5 CONCLUSION AND FUTURE
WORK
The object oriented paradigm is actually the only
widely adopted in all the several phases of every
software development process. In our view, the
current huge worldwide agreement is not supported
by enough empirical evidence on advantages and
disadvantages among other paradigms in different
phases of the software development process. In this
work we describe an empirical study focused on the
required time for analyzing a system using object
oriented and structural technique. The RUP and
SADT were chosen as instances of object oriented
and structured analysis techniques respectively. The
empirical study adopts a controlled and an
uncontrolled environment for analyzing the effects
of such analysis techniques on a new system and an
enhancement maintenance intervention, respectively.
Results show no significant difference in the
required time for the application of the two
techniques, and also in the order of their application,
in both the developing and the maintenance tasks.
However we founded two major results regarding
the object oriented method: 1) it is more sensible to
subjects’ peculiarities, 2) it provides a little bit of
reusability already at the analysis level. Since such
results concerns a one-hour-size enhancement
maintenance, we expect a significant benefits, in
case of real-size extension, by using object oriented
rather than structured paradigm, already at the
analysis level. Future works include the empirical
analysis of such expectation.
REFERENCES
Agarwal, R., De, P., and Sinha, A. P. 1999.
Comprehending Object and Process Models: An
Empirical Study. IEEE Trans. Softw. Eng. 25, 4, 541-
556.
Basili, V., Caldiera, G., and Rombach, D., 1994. Goal
question metric paradigm, in Encyclopedia of
Software Engineering, vol. 1, J. J. Marciniak, John
Wiley & Sons.
Baskerville, R., Fitzgerald, B., Fitzgerald, G., Russo, N.
1996, Beyond system development methodologies:
time to leave the lamppost, in Orlikowski, W.J.,
Walsham, G., Jones, M.R., De Gross, J.I. (Eds),IT and
Changes in Organisational Work, Chapman & Hall,
London.
Booch, G., 1994. Object-Oriented Analysis and Design
with Applications, second ed., Redwood City, Calif.:
Benjamin/Cummings.
DeMarco, T., 1978. Structured Analysis and Systems
Specifications, Prentice Hall.
Höst, M., Wohlin, C., Thelin, T., 2005. Experimental
context classification: incentives and experience of
subjects, 27th International Conference on Software
Engineering, St. Louis, Missouri, USA.
Fichman, R. G. and Kemerer, C. F., 1992. Object-Oriented
and Conventional Analysis and Design
Methodologies. Computer 25, 10 (Oct. 1992), 22-39.
Kruchten, P., 2003. The Rational Unified Process: An
Introduction, Addison Wesley Professional.
Jacobson, I., Booch, G., Rumbaugh, J., 1999. The unified
Software Development Process, Addison-Wesley-
Longman.
Sutcliffe, A. G., 1991. Object-oriented systems
development: survey of structured methods. Inf. Softw.
Technol. 33, 6 (Aug. 1991), 433-442.
Vessey, I. and Conger, S. A., 1994. Requirements
specification: learning object, process, and data
methodologies. Commun. ACM 37, 5 (May. 1994),
102-113.
Wang, S., 1996. Two MIS Analysis Methods: An
Experimental Comparison, J. Education for Business,
pp. 136±141, Jan./Feb.
Wieringa, R., 1998. A survey of structured and object-
oriented software specification methods and
techniques. ACM Comput. Surv. 30, 4 (Dec. 1998),
459-527.
Wohlin, C., Runeson, P., Höst, M., Ohlsson, M., Regnell,
B., Wesslén, A., 2000. Experimentation in Software
Engineering: An Introduction, The Kluwer
International Series in Software Engineering.
A COMPARISON OF STRUCTURED ANALYSIS AND OBJECT ORIENTED ANALYSIS - An Experimental Study
221
