
DEVELOPMENT OF A SELF-CHECK SYSTEM FOR MENTAL
HEALTH USING A PULSE WAVE MOUSE
Mayumi Oyama-Higa
1
, Teijyu Miao
2
, Kazuo Sato
2
, Kazuyoshi Tanaka
3
and Huaichang Cheng
4
1
Department of Integrated Psychological Science, Kwansei Gakuin University, 1-1-155, Ichibancho
Uegahara Nishinomiya-City, 662-8501, Japan
2
Chaos Technical Research Laboratory and CCI Incorporation, 3-1-2401 Ryodocho
Nishinomiya-City, 662-0841, Japan
3
Research & Development Center, Hitachi Systems & Services, Ltd. 10-70, 2-Chome
Nanbanaka, Naniwa-ku, Osaka, 556-0011, Japan
4
Bio-feedback and Measurement Group, College of Physics, Jilin University, Changchun, China
Keywords: Pulse wave, Chaos analysis, Lyapunov exponent, Divergence, Mental health, Pulse wave mouse.
Abstract: We applied nonlinear chaos analysis to fingertip pulse wave data and found that the Lyapunov exponent, a
measure of the “divergence” of the trajectory of the attractor, was a useful index of mental health in
humans, particularly for the early detection of dementia and depressive psychosis, and for monitoring
mental changes in healthy persons. We developed an easy-to-use economical device, a PC mouse with an
integrated sensor for measuring the pulse waves, and its required software, to make the measurements.
After about 1 min of measurement, the Lyapunov exponent is calculated and displayed as a graph on the
PC. An advantage of this system is that the measurements can be made very easily and mental health can be
assessed when the PC is not being used for other work. Moreover, the measured data can be saved
according to the time and date, so diurnal changes and changes over longer time periods can be monitored
as a time series. The changes in the Lyapunov exponent are displayed on the PC as constellation graphs.
1 INTRODUCTION
In Japan, the annual number of suicides has reached
30,000 in each of the past 3 years, with many being
caused by serious depressive psychosis. Japan has
world’s highest life expectancy, and dementia has
increased along with the aging population. This has
become a social problem, and appropriate handling
by the family of the patient and society is essential
for both depressive psychosis and dementia. Quite
often, however, these ailments advance without the
patient being aware of the condition, and thus early
detection and treatment are necessary.
Routine daily checking of the person’s behaviour
and condition is necessary for detecting depressive
psychosis and dementia. Subjective observations
alone are not sufficient, and objective data must be
gathered using scientific methods. Previously used
methods include electroencephalography and
diagnostic brain imaging, both of which require a
high level of technical ability and knowledge. These
are not convenient measurement methods when the
time and cost are considered, and thus simple and
economical methods are needed. We earlier
demonstrated that the “divergence” of the attractor
trajectory obtained by nonlinear analysis of fingertip
pulse waves was a useful index for assessing mental
health. It was particularly effective in the detection
of dementia and the diagnosis of depressive
psychosis (Oyama-Higa et al., 2006). With this
technique, the pulse wave data, which have chaotic
behaviour, are measured for a few minutes. The data
are subjected to nonlinear analysis and the largest
Lyapunov exponent, which is a measure of the
divergence of the attractor trajectory, is calculated.
In addition, patients are asked to answer some
simple questions and record simple statements about
their condition at the time of taking the
239
Oyama-Higa M., Miao T., Sato K., Tanaka K. and Cheng H. (2007).
DEVELOPMENT OF A SELF-CHECK SYSTEM FOR MENTAL HEALTH USING A PULSE WAVE MOUSE.
In Proceedings of the Second International Conference on Software and Data Technologies, pages 239-248
DOI: 10.5220/0001322702390248
Copyright
c
SciTePress
measurements to encourage self-reporting of their
physical health status. The personal ID code, date
and time of measurement, fingertip pulse wave data,
and the patient responses and a brief statement about
their condition at the time of measurement are stored
as time series data to create a database. The user
searches the database for data pertaining to multiple
measurement time points and displays the change in
divergence with time or date on a constellation
graph that we have devised. The changes in mental
health and the self-reported status at the time of
measurement are fed back to the subject, whose
pulse waves were measured, making self-assessment
possible. In Section 2, we explain the method of
calculating the “divergence value” by applying the
nonlinear analysis of fingertip pulse wave data and
the self-check details. In Section 3, we discuss the
relevance of using fingertip pulse wave data and the
relationship between the “divergence value” and the
psychology of dementia. The mental health self-
check system is outlined in Section 4 and the
effectiveness and shortcomings of the system, along
with future plans, are discussed in Section 5.
2 CALCULATION OF THE
“DIVERGENCE” VALUE
OF FINGERTIP PULSE WAVES
AND DETAILS OF
SELF-CHECKING
2.1 Method of Measuring Fingertip
Pulse Waves
Fingertip pulse waves, which are linked to the
bioinformation network, were measured to
determine the divergence. Fingertip pulse waves
have been found to have chaotic characteristics
(Tsuda et al., 1992), (Sumida et al., 2000), (Miao,
2006). Changes in the amount of haemoglobin
flowing through the capillaries can be measured by
irradiating them with an infrared beam, as shown in
Figure 1. The waveform is naturally synchronised
with the beating of the heart, but the information is
different from the cardiac wave. The changes in
haemoglobin level caused by the constriction of
capillaries in the fingertip constitute time series data
of a complex system that include information from
the sympathetic and parasympathetic nerves. Pulse
wave data are collected at a frequency of 200 Hz
and a resolution of 12 bits. The measurement
duration is variable, depending on the experimental
conditions. Time series data consisting of 12,000
points could be obtained in 1 min of measurement.
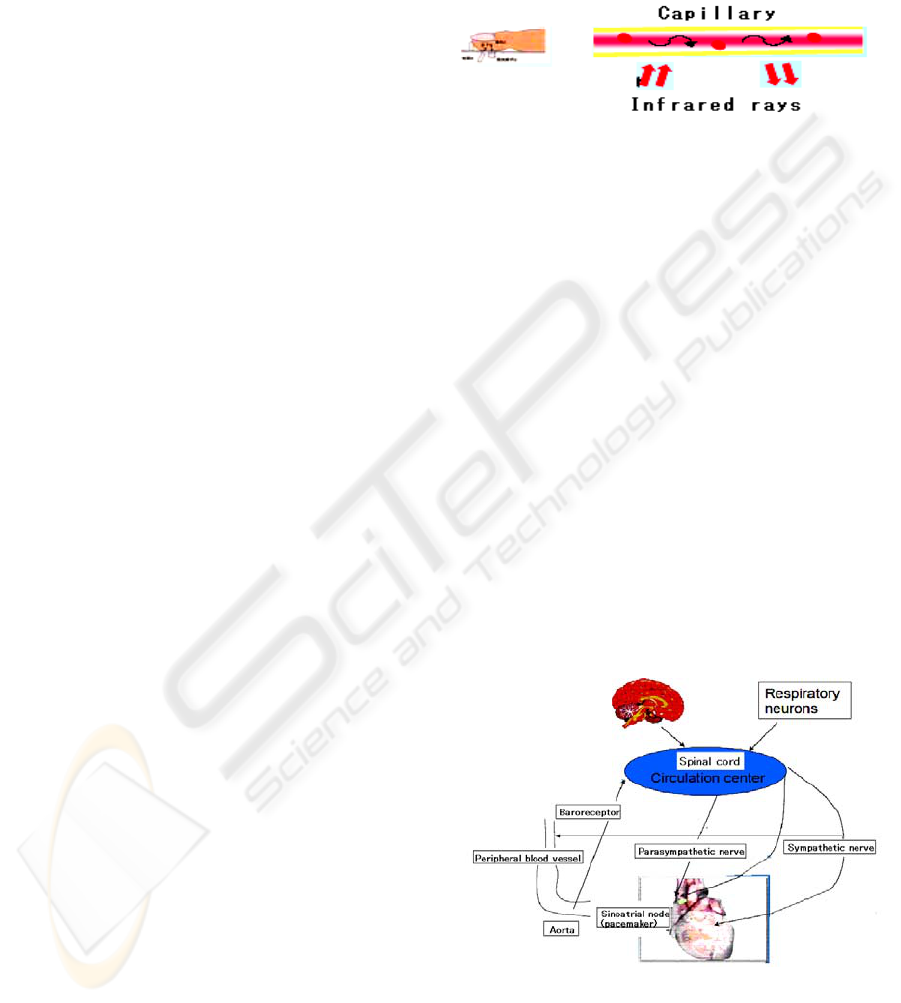
Figure 1: Measurement of pulse waves through infrared
irradiation of capillaries. Frequency 200 Hz, resolution 12
bits.
The change in haemoglobin level in the capillaries is
believed to be related to the baroreceptors, which
are linked to the sympathetic and parasympathetic
nerves via the brain stem and the spinal cord, as
shown in Figure 2. This is a convenient method
because it does not require special care with regard
to the room temperature, place of measurement, and
measurement conditions. Moreover, because the
measurement time is very short, the data collection
is not a burden to the subject.
2.2 Chaos Analysis of the Pulse Wave
and Calculation of Divergence
(Lyapunov Exponent)
of the Attractor Trajectory
Figure 3 is a flow diagram showing the procedure,
from the measurement of pulse waves to calculation
of the Lyapunov exponent.
Figure 2: A conceptual diagram showing the flow of
information from the brain stem to peripheral blood
vessels through the action of sympathetic and
parasympathetic nerves.
ICSOFT 2007 - International Conference on Software and Data Technologies
240
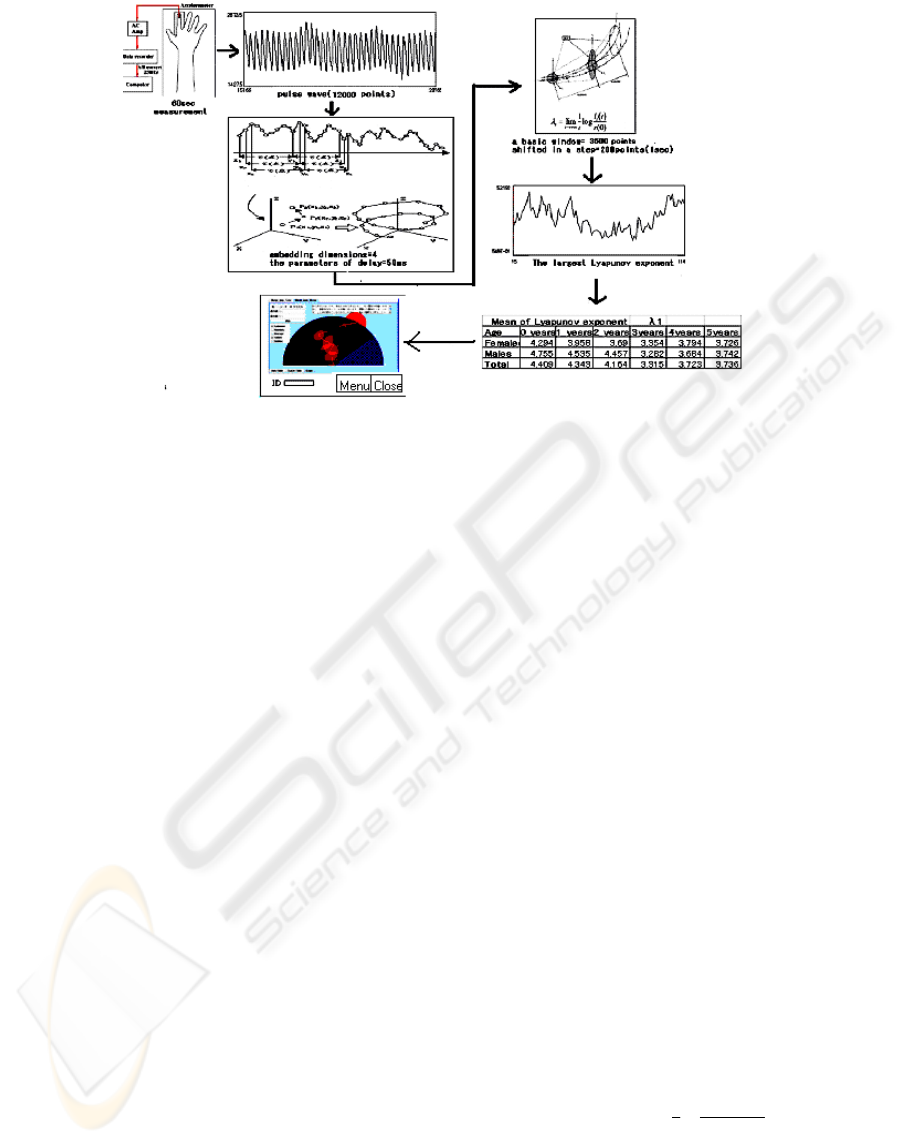
Figure 3: Flow diagram showing the procedure from the measurement of pulse waves to calculation of the Lyapunov
exponent.
To construct the attractor, we set a delay time
and the number of embedding dimensions according
to Tarkens (Takens, 1985), (Takens, 1981). We used
four embedding dimensions and a delay time of 50
msec (Sano and Sawada, 1985). Figure 3 illustrates
the method of embedding in three-dimensional
phase space. Although effective information can be
obtained from the shape of the four-dimensional
attractor, we calculated the Lyapunov exponent,
which is an index of trajectory instability and a
characteristic of chaos.
Our method of calculating the Lyapunov
exponent is explained in Figure 4, using three-
dimensional phase space as an example. We
assumed that a small sphere (hypersphere) of radius
ε is the initial value for a three-dimensional chaotic
dynamic system. After being mapped once, the
sphere was stretched in the e1 direction and
compressed in the e3 direction, and assumed the
shape of an ellipsoid, as shown in Figure 4. We
designated the logarithm of the expansion rate per
unit time along the directions e1, e2, and e3 as λ1,
λ2, and λ3, respectively. Here, λ1, λ2, and λ3 are the
Lyapunov exponents and their set is the Lyapunov
spectrum. We repeated the procedure of
representing this hypersphere as many times as the
calculation was iterated. After that, their sum was
taken and the average was determined to calculate
the Lyapunov spectrum. Because four embedded
dimensions were set as the optimum number of
dimensions for the pulse wave, we obtained the four
Lyapunov exponents, λ1, λ2, λ3, and λ4, as the
Lyapunov spectrum. Amongst these, the largest
Lyapunov exponent, λ1, was used in the calculation
to prepare the constellation graphs.
The calculation equations for the Lyapunov
exponent are shown below. For the time series data
x(i), with I = 1,…, and N obtained from the fingertip
pulse waves, the phase space was reconstructed
using the method of time delays. Assuming that we
create a d-dimensional phase space using a constant
time delay τ, the vectors in the space are generated
as d-tuples from the time series and are given by
)}({)))1((),...,(()( ixdixixi
k
=−
−
=
τ
X
(1)
where
))1(()(
τ
−−= kixix
k
, with k = 1,...,d. To
reconstruct the phase space correctly, the parameters
of delay (τ) and embedding dimensions (d) should
be chosen optimally (Sano and Sawada, 1985). In
time series data recorded from human finger
photoplethysmograms, we chose the parameters τ =
50 msec and d = 4, as in references (Tsuda et al.,
1992) and (Sumida et al., 2000).
In the reconstructed phase space, one of the
important measures of complexity is the largest
Lyapunov exponent
1
λ
. If
)(tX
is the evolution of
some initial orbit
)0(X
in the phase space, with
time, then
||
|)(|
ln
1
limlim
0
1
ε
δ
λ
ε
ε
t
t
t
X
→∞→
=
(2)
where
)()()( ttt
εε
δ
XXX
−
=
and
)0()0(
ε
ε
XX −=
DEVELOPMENT OF A SELF-CHECK SYSTEM FOR MENTAL HEALTH USING A PULSE WAVE MOUSE
241
for almost all initial difference vectors
)0()0(
ε
ε
XX −=
. We estimate
1
λ
using the
algorithm of Sano and Sawada (Sano and Sawada,
1985), where
1
λ
describes the divergence and
instability of the orbits in phase space.
Figure 4: Method of calculating the Lyapunov exponent.
The initial 8,000 points of pulse wave data were
taken as one window to calculate the largest
Lyapunov exponent, λ1. In the next step, the
window was shifted by 200 points and the exponent
was calculated from the next window of 8,000
points. This procedure was repeated until the pulse
wave data were exhausted. Three minutes of
measurement yielded 36,000 data points. Therefore,
we can obtain a (36,000 – 8,000)/200 = 140-point
time series of Lyapunov exponents, and with 1 min
of measurement, we can achieve a (12,000 –
8,000)/200 = 20-point time series of Lyapunov
exponents. The size of the hypersphere used was
0.08. The variation of the largest Lyapunov
exponent is a measure of the variation of the
trajectory of the four-dimensional attractor. The
largest Lyapunov exponent is the divergence of the
attractor trajectory and is an important value related
to psychological indices (Oyama-Higa and Miao,
2005), (Oyama-Higa and Miao, 2006).
2.3 Outline of Self-Checking at the
Time of Measurement
The subjects were asked to answer some simple
questions to ensure normal measurement of pulse
waves. This information was used to interpret the
observed divergence in measured values. The
questions were status-checking items, including
physical condition and a simple assessment of the
mood at the time of measurement. The answer was
chosen from one of three available choices. Apart
from these questions, the subjects were asked to
describe their mood and condition at the time of the
measurement in more definite terms. This enabled
the person to identify factors that affect the
divergence values. Because these records were made
in a free-form style, key words alone could be used.
However, when a subject is allowed to write freely,
for example, about things that he or she had
communicated to a friend, music he or she enjoyed,
positive results in a sporting activity, and good or
bad news that had been received, it is easier to study
the relationship of those events with the divergence
value.
The situations that elicit emotions such as
delight, anger, sorrow, and pleasure, differ from
person to person. For example, a condition that
creates a suitable level of divergence, such as
listening to music or having a conversation with
someone, need to be recorded as data unique to that
subject. In addition, extreme tension, fatigue, and
low spirits also cause changes in divergence.
Therefore, comparing the status recorded at the time
of measurement with the corresponding divergence
values helps a person to assess his or her own
mental status. Table 1 shows the details of the
questions with three levels of answers, and the
freestyle description method. These responses and
the simple comments on the subject’s condition are
stored so that they can be seen by clicking the
corresponding divergence value on the graph.
Table 1: An example of entering the subject’s state at the
time of measurement: Status checking items.
Freestyle reporting: The subject is also to enter a
note on his or her condition at the time of
measurement. These notes can be in the form of a
descriptive comment on the subject’s condition,
keywords, and more.
Comment example 1:
[Had a pleasant chat with a friend about hobbies.]
Comment example 2:
[Feeling low after failing a test]
We plan to vary the simple questions described
above according to the category (child, adult, or
aged person) of the subject.
ICSOFT 2007 - International Conference on Software and Data Technologies
242

3 RELATIONSHIP BETWEEN
THE DIVERGENCE VALUE
AND COGNITIVE
PSYCHOLOGY AND THE
RELEVANCE OF USING
FINGERTIP PULSE WAVES
Biological systems are considered to be complex,
fluctuating with chaotic characteristics. Although
chaotic systems appear to be extremely complicated
and to behave in a random and unstable manner,
they in fact change according to deterministic rules.
Biological signals emanating from humans, or vital
signs, come in many types, such as the body
temperature, blood pressure, and pulse rate.
Fingertip pulse waves are biological signals that
produce time series data with chaotic characteristics.
Moreover, unlike cardiac waves, fingertip pulse
waves contain various types of information, such as
that from the nervous system. In the field of
psychology, several methods have been suggested as
indices for assessing mental health. However, these
methods are generally subjective, and therefore lack
objectivity. Questionnaires have often been used as
relatively simple psychological tests, and the
measurement and analysis of brain waves can
objectively assess the neurological state at the time
of measurement. However, the measurements are
not simple, and the analysis methods are not yet
capable of analysing detailed psychological changes.
Another possible method for measuring biological
information is to analyse the R-R intervals of
heartbeats and pulse waves. However, no analysis
has attempted to take into account the chaotic
characteristics of biological information.
The Lyapunov exponent is a property of chaotic
systems that expresses the attractor and represents
the “divergence” of the attractor trajectory. We
focussed on the Lyapunov exponent, which had not
been quantitatively evaluated as an index of
psychological changes in humans, and investigated
its relationship with dementia and communication
skill (an ADL index) in aged persons (Oyama-Higa
et al., 2006), its relationship with error rate at work
(Imanishi and Oyama-Higa, 2006), its relationship
with diurnal changes and indices of cumulative
fatigue in employees (Miao, 2006), (Oyama-Higa
and Miao, 2005), (Oyama-Higa and Miao, 2006),
and the time series fluctuations in divergence in 0-
to 5-year-old children and the effect of parental
affection towards the children (Oyama-Higa et al,
2006).
It became clear that suitable functioning and
harmony of the sympathetic nerves, which are
related to the adaptability to the external
environment and the society, and flexibility,
spontaneity, and cooperativeness of the mind, are
important for humans to live in a mentally healthy
state. These values were related to the largest
Lyapunov exponent obtained by nonlinear analysis
(Oyama-Higa and Miao, 2005), (Oyama-Higa and
Miao, 2006). The largest Lyapunov exponent that
represents the time series variation in the attractor
trajectory is defined as “divergence.” When this
value remains continuously low (i.e., when a long
spell with low divergence persists), the person
would have a low ability to adapt to the external
world in their daily life and would be incapable of
maintaining a mentally healthy state. However, an
extremely tense or stressful state persists when the
divergence remains continuously high. A mentally
healthy state also cannot be maintained in this
situation. Normally in humans, a healthy state is the
condition in which constant variation occurs in the
divergence. Emotions are a part of being human, and
these are believed to cause the variation in
divergence.
Physical immunity is crucial for the maintenance
of human health, and lowered immunity causes
various diseases. Therefore, to prevent the lowering
of physical immunity and to increase resistance and
prevent diseases, we pay attention to what we eat,
rest, take medicines, and train to improve our
stamina. However, mental toughness, as reflected in
the ability to communicate in a positive manner,
willingness to do the given jobs, and the ability of
mental toughness to withstand drastic changes in the
external world, are also very important. We can call
these “mental immunity,” but no methods have been
developed to scientifically investigate such
immunity. We analysed fingertip pulse waves
through nonlinear analysis and examined their
relationship with various psychological indices, and
found that the largest Lyapunov exponent obtained
through chaos analysis, which corresponds to the
“divergence” of the attractor, was closely related to
mental immunity. It was also demonstrated that this
value was closely linked with functioning of the
sympathetic nerves of the autonomic nervous
system.
For humans, a mentally healthy condition means
having the ability to cope flexibly with external
changes in “divergence.” This can be considered
mental flexibility, or mental immunity, in contrast to
physical immunity. Mental immunity represents
DEVELOPMENT OF A SELF-CHECK SYSTEM FOR MENTAL HEALTH USING A PULSE WAVE MOUSE
243
adaptability to the external changes in that a person
has to face in his or her everyday life, including
one’s communication ability, ability of self-
expression, and suitability of psychological
flexibility. Whilst expressing themselves, humans
skillfully fend off various kinds of changes,
contacts, and assaults from the external
environment, and deal with or cope with them in
some cases. This is the essence of mental immunity.
Change occurs constantly in day-to-day life.
“Divergence,” which represents a change in the state
of mental immunity, is a critical index. At the same
time, divergence varies depending on various
conditions of the person. For example, a long time
period without “divergence” suggests that the person
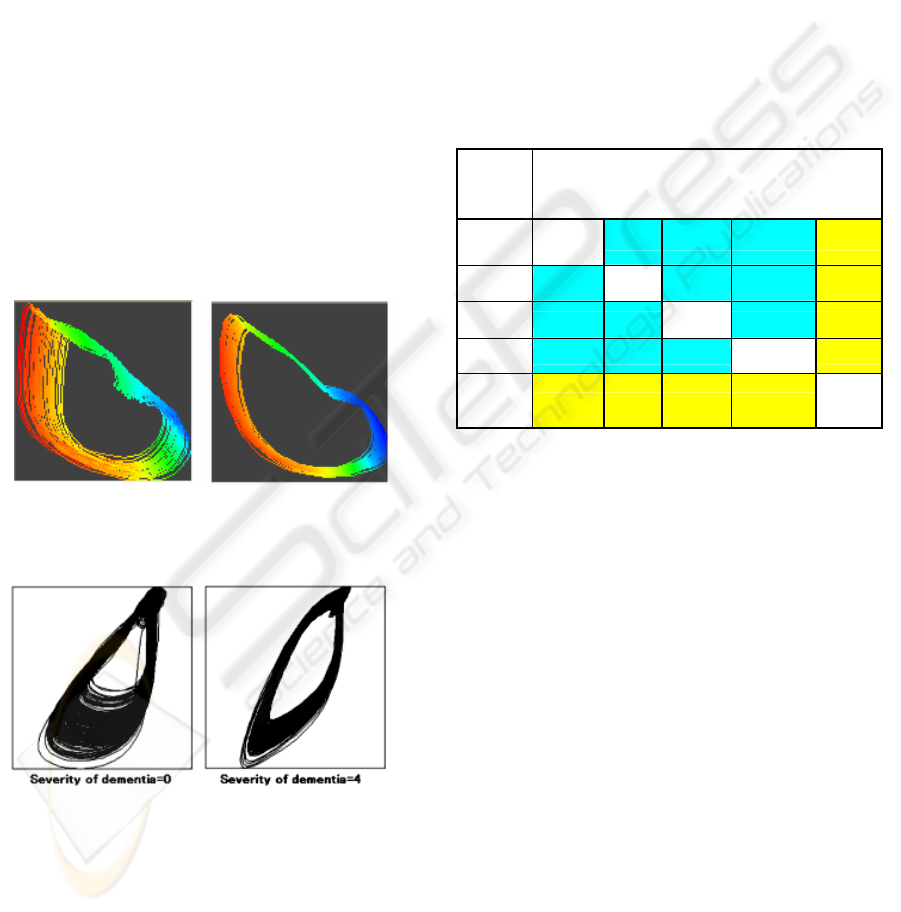
is not in a normal state. Figure 5 shows the attractors
of a mentally healthy person and a patient with
depressive psychosis. The depressed person has low
divergence. Figure 6 shows the attractors of two
dementia patients; both figures contain data from
elderly subjects. The divergence becomes smaller as
dementia advances. (CCI software was used.)
Healthy person Depressed patient
Figure 5: Attractors of a healthy person and a depressed
patient prepared from 30-sec measurements.
Figure 6: Attractors in old people with dementia of
severity 0 and 4.
In a normal state, the divergence level constantly
fluctuates. During times of extreme tension and
stress, continuously high divergence will exist.
Afterward, however, a mentally healthy person
naturally finds a way to relax, which brings the
divergence back to its normal state. However, a low
level of divergence would continue when a person is
in a depressed state or when age-related dementia is
present. This suggests that the person is incapable of
bringing back the divergence to its natural level on
his or her own, indicating a lowered adaptability to
the external environment.
Table 2 shows the comparison of the midday
Lyapunov exponent and the fatigue indices during
the work day of employees at a particular company.
The table indicates an inverse correlation of –0.7 or
greater between the midday Lyapunov exponent and
state of depression or anxiety of the employees.
Table 2: Coefficients of correlation between the Lyapunov
exponent (at midday) and components of mental fatigue in
company employees.
Willpower
decrement
Anxiety
State of
Depression
Accumulated
Tiredness
Lyapunov
exponent
midday
Willpower
decrement
1
0.7235 0.7539 0.7496 –0.6385
Anxiety 0.7235 1 0.8455 0.9358 –0.7279
State of
depression
0.7539 0.8455 1 0.842 –0.7014
Accumlate
d tiredness
0.7496 0.9358 0.842 1 –0.6305
Lyapunov
exponent
midday
–0.6385 –0.7279 –0.7014 –0.6305 1
The experiments conducted thus far have shown
that a suitable variation in the Lyapunov exponent is
related to an adaptability to the external
environment, which is necessary for a person to live
a healthy life. This value fluctuates constantly.
Therefore, by monitoring the fluctuations to detect
states with very little or too much variation, a person
could, on his or her own, assess one’s mental health.
Below, we outline this mental health self-check
system.
4 OUTLINE OF THE MENTAL
HEALTH SELF-CHECK
SYSTEM
4.1 Development of the Measuring
Equipment
A device that is easy to use and gives minimum
burden on the subject is needed to measure the pulse
waves. It is not possible to check the mental health
of a person through just one round of measurements.
For these reasons, the device must be convenient to
ICSOFT 2007 - International Conference on Software and Data Technologies
244
use. We took note of the fact many people often do
their work with PCs, and therefore developed a
device that can make these measurements using a
mouse. As shown in Figure 7, the pulse wave sensor
is installed on one side of the pulse wave (PW)
mouse; measurements can be made by simply
touching the sensor with a finger. The mouse is
connected to the PC through a USB port and can
also be used as an ordinary mouse (patent pending).
Figure 7: Mouse for measuring pulse waves.
Software installed on the PC starts and ends the
measurements, and sets their duration.
4.2 System Configuration
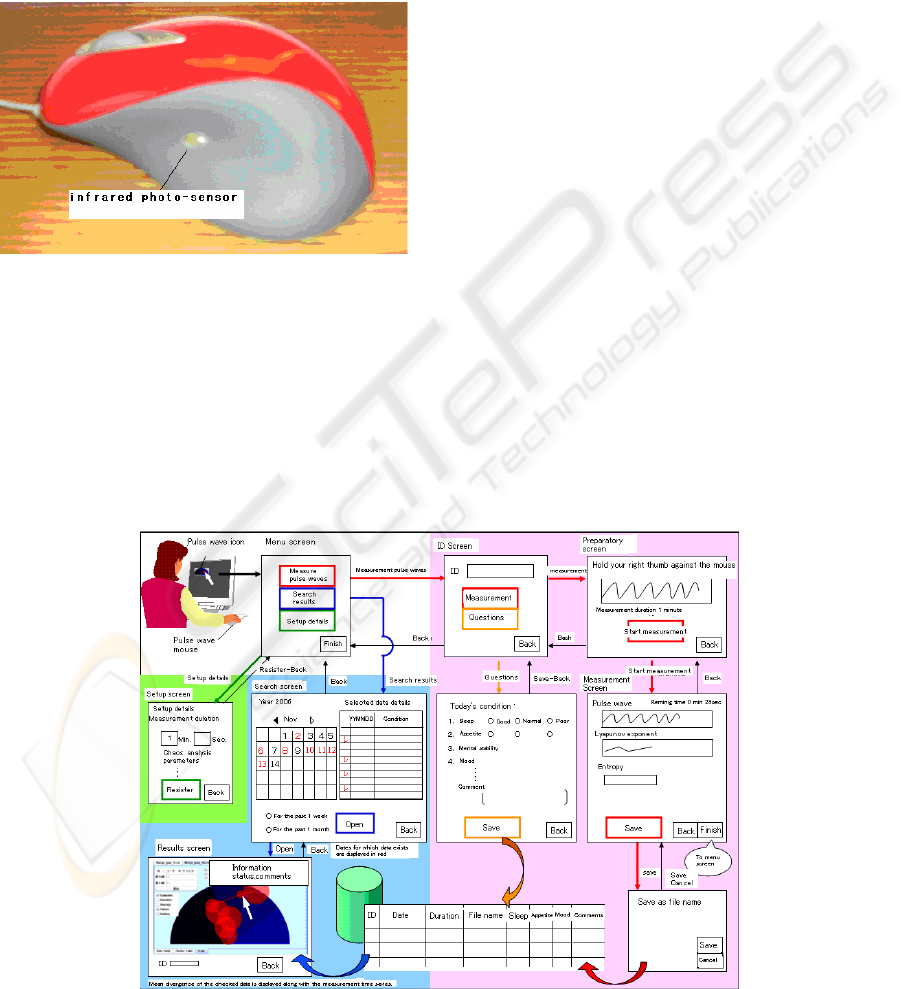
Figure 8 is a configuration diagram of the mental
health self-check system. A PW mouse icon is
created on the PC desktop, and the menu screen is
displayed by clicking on the icon.
The screens are structured so that clicking the
PW mouse icon on the screen displays the initial
screen of the program. The user can then navigate to
the measurement, search, or setup screens, where the
respective functions can be performed. In the
measurement section, the subject inputs his or her
ID, does the data collection, and answer questions.
In the pulse-wave-measuring step, the Lyapunov
exponent is computed, and after it is confirmed that
the pulse waves are being captured normally, the
data are saved. After the pulse wave measurements
are completed, the user answers the questions and
the answers are saved. When the pulse wave
measurements and the inputs of the answers to the
questions are completed, the system moves back to
the initial screen. If the person clicks the search
button, a list of saved data is displayed. The
constellation graph can be displayed by clicking the
desired date. From one to a maximum of ten dates
can be selected. The display is prepared according to
the sequence of the selected measurement dates. The
person can self-check his or her mental status by
examining the variation in the Lyapunov exponent
and the text displayed at the top right in the
constellation graph. The menu screen display is
structured so that various parameters can be changed
based on the initial screen setup. When default
values are used for the safe operation of the system,
the displays are based on the fixed settings.
Figure 8: Flow diagram of the mental health self-check system (fully PC based).
DEVELOPMENT OF A SELF-CHECK SYSTEM FOR MENTAL HEALTH USING A PULSE WAVE MOUSE
245

4.3 Display of Results and
Constellation Graphs
Figure 9 presents constellation graphs. The change
in divergence is displayed according to the selected
dates of measurement. When a large divergence
occurs, the line moves to the right, and when it is
small, the line shifts to the left.
The results of seven measurements are displayed
simultaneously. The circles around each point
represent the standard deviation. When the cursor is
placed over the centre of a circle, the display in the
box at the top right changes to show the information
that corresponds to that measurement.
As noted in Section 2.2, 1 min of pulse wave
measurements yields a 20-point time series of
Lyapunov exponents. The mean and standard
deviation are calculated. Each mean value of the
Lyapunov exponent is converted into an angle, with
180° assigned the maximum value of 5.0 and 0°
given the minimum value of 0.0, and displayed as a
vector on the constellation graph. For displaying the
data of n number of measurement dates, the radius r
of the full semicircle is divided into n equal sections,
and n equidistant concentric semicircles are drawn.
The sequence of the time series is set from the centre
towards the outside. The n Lyapunov exponents of
this time series are converted into angles and
represented as a series of connected vectors. The
point at which a vector intersects the corresponding
semicircle is taken as the origin for the next vector
to obtain the type of graphs shown in Figure 9.
5 FUTURE PLANS AND THE
EFFECTIVENESS AND
DRAWBACKS OF THE
SYSTEM
We have described a system in which the entire
procedure is performed on a PC. In the future, we
Figure 9: Examples of time series constellation graphs.
ICSOFT 2007 - International Conference on Software and Data Technologies
246
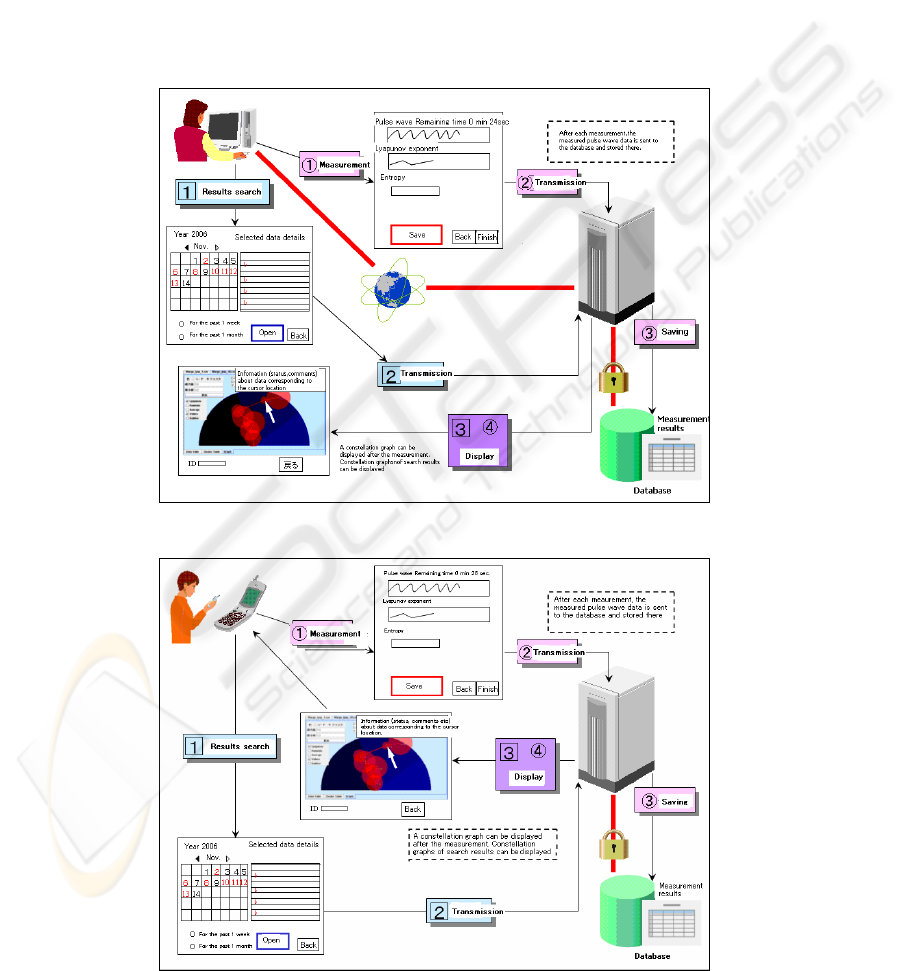
plan to develop this into an Internet-based system,
with software kept on a server and launched by
clicking an icon. Pulse-wave data, answers to the
questions, and the descriptive comments would be
stored under the person’s ID in a database created
on the server. Thus, data from a larger number of
users can be collected to facilitate a more effective
analysis.
To encourage more people to use the system, we
are also considering incorporating the PW mouse
into cell phones to allow the display to be viewed on
cell phone screens. When using cell phones, the data
processing would be achieved by downloading the
software and searching the database via the Internet
in the I-mode. The use of Internet-based methods
would produce a vast amount of data, and privacy-
protection issues would have to be thoroughly
addressed.
The following are conceptual diagrams of the
fully PC-based system, an Internet-based system,
and a cell phone-based system.
A. Fully PC-based system (See Figure 8).
B. Internet-based system.
C. Cell phone-based system.
Figure 10: The Internet-based system.
Figure 11: The cell phone-based system.
DEVELOPMENT OF A SELF-CHECK SYSTEM FOR MENTAL HEALTH USING A PULSE WAVE MOUSE
247

6 CONCLUSION
The system described above allows a person to self-
check his or her mental health level and also enables
self-management. Appreciating the mental states
that give rise to high or low divergence in day-to-
day life would help to maintain mental health. We
firmly believe that when a person can no longer
exercise self-control, the early detection of
depressive psychosis or dementia through
consultation with a counselor or psychiatrist, and the
prevention of deteriorating mental health, would be
possible. Moreover, if data related to the
psychological indices of persons could be sent and
received through a network, this could lead to
previously unknown communication innovations.
Nevertheless, we must to pay great attention to data
management because of recent problems in
protecting personal information. In terms of the
system’s effectiveness from a research point of
view, we are certain that accumulating vast amounts
of information would be useful in various future
studies on pulse waves.
REFERENCES
Oyama-Higa M., Miao T., and Mizuno-Matsumoto Y.,
(2006) Analysis of dementia in aged subjects through
chaos analysis of fingertip pulse waves, 2006 IEEE
Conference on Systems, Man, and Cybernetics 2006,
Taipei, Taiwan, 2863–2867.
Tsuda I., Tahara T., and Iwanaga I., (1992) Chaotic
pulsation in capillary vessels and its dependence on
mental and physical conditions. Int. J. Bifurcation and
Chaos 2: 313–324.
Sumida T., Arimitu Y., Tahara T., and Iwanaga H., (2000)
Mental conditions reflected by the chaos of pulsation
in capillary vessels. Int. J. Bifurcation and Chaos 10:
2245–2255.
Sano M. and Sawada Y., (1985) Measurement of the
Lyapunov spectrum from a chaotic time series. Phys.
Rev. Lett. 55: 1082.
Miao T., Shimoyama O., and Oyama-Higa M., (2006)
Modelling plethysmogram dynamics based on
baroreflex under higher cerebral influences, 2006
IEEE Conference on Systems, Man, and Cybernetics
2006, Taipei, Taiwan, 2868–2873.
Oyama-Higa M. and Miao T., Representation of a physio-
psychological index through constellation graphs,
ICNC’05–FSKD’05., http://dx.doi.org/10.1007/
11539087_109.
Oyama-Higa M. and Miao T., (2006) Discovery and
application of new index for cognitive psychology,
2006 IEEE Conference on Systems, Man, and
Cybernetics 2006, Taipei, Taiwan, 2040–2044.
Imanishi A. and Oyama-Higa M., (2006) The relation
between observers’ psychophysiological conditions
and human errors during monitoring task, 2006 IEEE
Conference on Systems, Man, and Cybernetics 2006,
Taipei, Taiwan, 2035–2039.
Oyama-Higa M., Tsujino J., and Tanabiki M., (2006)
Does a mother’s attachment to her child affect
biological information provided by the child? Chaos
analysis of fingertip pulse waves of children, 2006
IEEE Conference on Systems, Man, and Cybernetics
2006, Taipei, Taiwan, 2030–2034.
Takens F, in: Braaksma B L J, Broer H W, and Takens F,
eds (1985) Dynamical Systems and Bifurcations,
Lecture Notes in Math. Vol. 1125, Springer,
Heidelberg.
Takens F (1981) Detecting Strange Attractors in
Turbulence, Lecture Notes in Math. Vol. 898,
Springer, New York.
ICSOFT 2007 - International Conference on Software and Data Technologies
248
