
CAPTURING USER BEHAVIOR IN E-LEARNING ENVIRONMENTS
Enric Mor, Juli`a Minguill´on
Department of Computer Science, Multimedia and Telecommunication, Universitat Oberta de Catalunya, Barcelona, Spain
Francesc Santanach
Learning Technologies, Universitat Oberta de Catalunya, Barcelona, Spain
Keywords:
User tracking, user behavior, web usage mining, e-learning environments.
Abstract:
In this paper we describe a proposal for embedding hidden marks in the web pages of a complex web site
with the aim of simplifying the process of collecting and analyzing users’ behavior. Usually, server log files
are used for tracking user actions, but these files present typical drawbacks due to their huge size and the
lack of discrimination between user actions and automated responses. We propose two different strategies
for embedding usage marks into web server log files, action-oriented and content-oriented. Action marks are
button-oriented and keep track of user behavior oriented to perform tasks thorough system buttons and menus.
Content marks keep track of page loads and navigation thorough links pointing to contents that act as traps.
Both strategies are complementary and can be used at once. A simple experiment designed to capture user
behavior once the initial web site page has been loaded is described as a real example of such proposal usage,
showing the advantages of reducing the number of relevant log entries and focusing on specific user actions.
1 INTRODUCTION
One of the most interesting possibilities in any e-
learning environment is tracking user navigational be-
havior for analysis purposes, as it may help to dis-
cover unusual facts about the system itself, users’ be-
havior and also can provide useful information for
adaptation and personalization purposes. For exam-
ple, having a user navigational model (Kay and Lum,
2004) may be used to perform an automated usabil-
ity evaluation (Hilbert and Redmiles, 2000), detect-
ing whether the system web interface was properly
designed or not, and where users find obstacles and
difficulties to reach out their objectives (Marsico and
Levialdi, 2004). This navigation model can be also
used to improve the student learning experience; nav-
igation behavior and learning indicators and can serve
to tailor learning itineraries to specific student needs.
In the case of a virtual learning environment, sev-
eral data and information levels can be determined
and thus, several analysis levels can be established,
and different research questions can be answered with
the aid of web mining tools. Instructional design-
ers, teachers but also system designers need powerful
tools for understanding all the information collected
in a virtual learning environment in order to improve
the learning process and, thus, user experience and
satisfaction, by means of an adaptive (Paramythis and
Loidl-Reisinger, 2004) environment: monitoring and
interpreting the activities of its users (Thomas et al.,
2003), inferring user requirements and preferences,
and acting upon the available knowledge on its users.
Therefore, the extraction of the real learning and
training patterns can be of great utility, among other
purposes, to determine the quality of the e-learning
environment design and to evaluate the concordance
degree among the usability requirements and the navi-
gation behavior of the users, but especially for person-
alization purposes, tailoring the learning plans to the
student background and needs (Mor and Minguill´on,
2004). The information extracted from behavior and
learning patterns must not be used in any way but
for learning and teaching purposes. The main issue
of user behavior analysis in large e-learning environ-
ments is the great amount of data available from dif-
ferent sources and the lack of specific data for analysis
purposes. Usually, as users interact with the learning
management system by means of a web browser, it is
464
Mor E., Minguillón J. and Santanach F. (2007).
CAPTURING USER BEHAVIOR IN E-LEARNING ENVIRONMENTS.
In Proceedings of the Third International Conference on Web Information Systems and Technologies - Society, e-Business and e-Government /
e-Learning, pages 464-469
DOI: 10.5220/0001288404640469
Copyright
c
SciTePress
possible to track all interactions by examining the log
files stored in the servers which support the learning
management system. This is a well known technique
known as web mining (Chi et al., 2000), but it suffers
from several drawbacks when complex (in both size
and internal structure) sites are evaluated. Instead of
analyzing raw log files directly from the servers, we
propose to establish a minimum set of marks in strate-
gic areas which is considered to be relevant for analy-
sis purposes, with the double aim of capturing users’
real activity and intentions while reducing the volume
of data needed to analyze them.
This paper is organized as follows: Section 2 de-
scribes the basic services and the interactions that
are interesting to capture from a pedagogical point of
view. In Section 3 we describe the proposed mark em-
bedding strategy for capturing these interactions com-
paring two different kinds of mark techniques. Sec-
tion 4 describes the proposed framework for data col-
lecting and analysis, and some preliminary results fol-
lowing a three level decomposition. Finally, the most
important conclusions of this paper and current and
future research lines are summarized in Section 5.
2 E-LEARNING ENVIRONMENTS
In the last years, learning management systems
(LMS) and learning content management systems
(LCMS) have become a common tool for teachers and
institutions willing to set up virtual learning environ-
ments. In fact, both LMS and LCMS pursue the same
goal, but focusing on the learning process or the learn-
ing contents, respectively, and they can be combined
altogether, as in the UOC proprietary e-learning envi-
ronment, the virtual campus. We are interested in cap-
turing users activity when interacting with the LMS,
that is, when accessing to the available services.
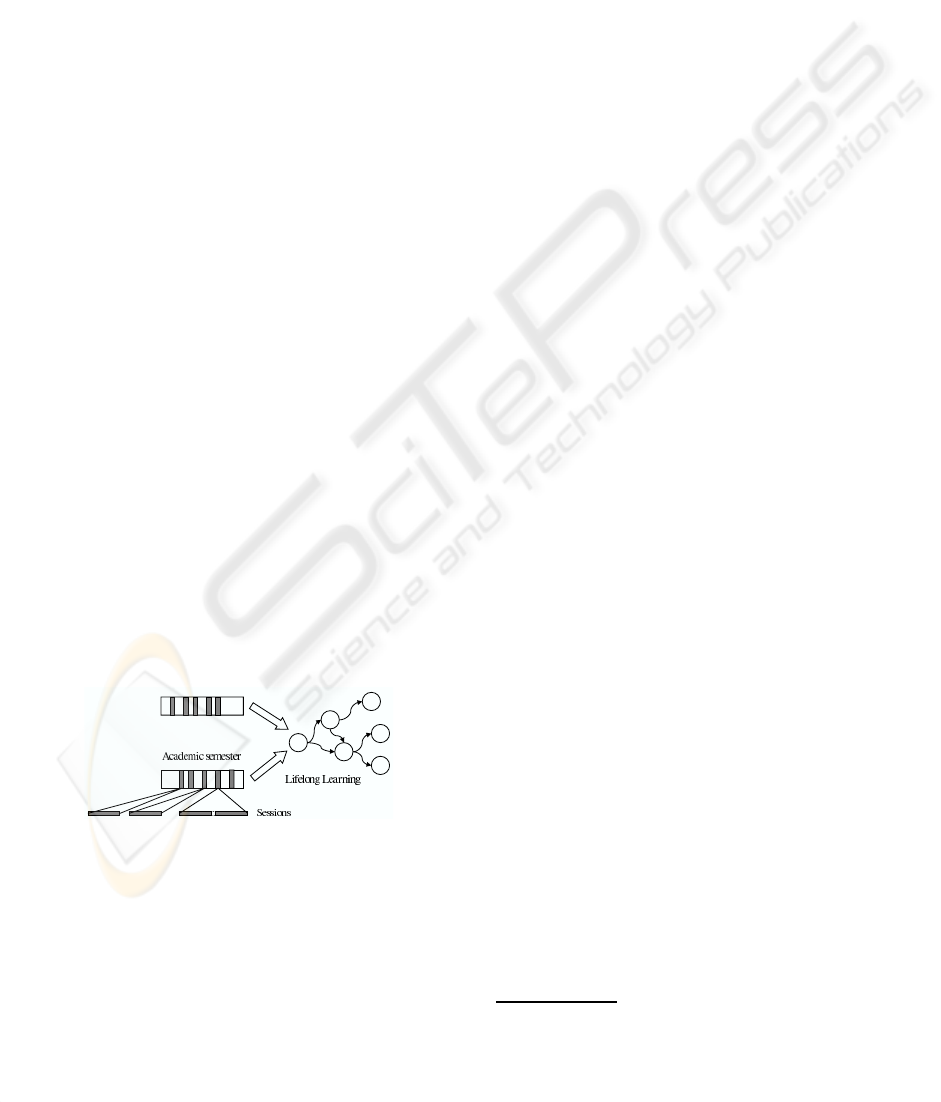
Figure 1: Hierarchical structure of navigation levels.
In the context of an e-learning environment, user
activity and behavior can be analyzed from a three-
level (Mor et al., 2006) point of view, as shown in
Figure 1. These three levels, namely short term, mid
term and long term, are based on the study of student
behavior during different time periods and, therefore,
different data is collected at each level. The short
term level, also known as session level, captures the
way users navigate with particular goals in mind. It
considers each student log into the LMS and the ac-
tions performed and the information accessed during
the log session. At this level, as important what users
do is how they do it, which pages they visit and how
they reach them. The mid term level is the academic
semester level and takes into account the single user
sessions in a continuous flow during the course du-
ration. At this level the main goal is to determine the
navigational patterns followed by users but at a higher
scale than in the previous level, according to some ex-
isting teaching plan, in the case of an e-learning en-
vironment. The third and long term level is called
lifelong learning level and the main goal is to analyze
how students evolve from the beginning of a degree
until they successfully finish it.
Studying the user activity using this three level
approach allows teachers, instructional designers and
usability experts to obtain an accurate description and
provides a complete view of system usage and user
behavior, because at each level the user’s goals can be
learned and correlated with the data analysis results
(Spiliopoulou, 2000). In this work we are focused
on the collection, management and processing of web
server logs and how can be used within the three-level
framework in order to discover knowledge about user
activity and behavior, specially for the first two levels.
2.1 The UOC Virtual Campus
The Universitat Oberta de Catalunya (UOC
1
, in En-
glish known as Open University of Catalonia) is a
completely online university which offers 19 official
degrees, several graduate programs and post-graduate
studies, and a doctoral degree, with almost 40000 stu-
dents and more than 1800 people including instruc-
tional designers, teachers, tutors, academic and tech-
nical staff, and so. The UOC virtual campus is an in-
tegrated web based e-learning environment which al-
lows usersto asynchronouslycommunicate with other
users using a mail system, and includes an agenda, a
news service, virtual classrooms, a digital library and
other e-learning related tools (Sangr`a, 2002). Each
subject has a virtual classroom with all the elements
and tools for the learning/teaching process.
2.2 System Architecture
The UOC virtual campus is built upon a complex
database server system which uses a hierarchical
structure of servers which deal with different kinds
1
http://www.uoc.edu
CAPTURING USER BEHAVIOR IN E-LEARNING ENVIRONMENTS
465

of user requests. There are up to 24 front-end servers
(depending on the server load at each moment), and
an automated load-balance system moves each user
login to the front-end with lower load at that mo-
ment, switching on and off the total number of front-
ends depending on system load. At peak hours, it is
not uncommon to achieve 3000 concurrent connec-
tions, while 1500 is the average number of concur-
rent users in office hours. Briefly, the virtual cam-
pus uses client-server web technology and common
interface to integrate a series of services and function-
alities. These functionalities include: access to on-
line educational materials, library resources and gen-
eral academic and cultural information; student man-
agement enquiries service; and interaction with pro-
fessors and other students through pre-defined com-
munication channels (e.g., forums, activity spaces).
Services include: an email account; a collection of
virtual classrooms, where each one has several com-
munication spaces where students and teachers can
interact and share learning resources; a digital li-
brary which integrates all the digital and non-digital
contents into the virtual campus. When users navi-
gate through these services, they leave a track which
can be posteriorly analyzed for user modelling pur-
poses. Most of this information is collected by the
web servers in form of server log files, according to
the Apache Common Log Format (CLF). Following
the classical architecture of web information systems,
there are three different layers for handling all the re-
quests from the users of the web site. A first layer,
the presentation layer, is handled by the web servers,
which generate access logs with all the interactions
(i.e. clicks) performed by users. Most of these in-
teractions are not only navigational but also involve
the use of some services and components, handled by
the business logics layer, which does also generate its
own program logs in different formats, according to
each application. The data model layer is handled by
a back-end database which stores all the data gener-
ated by the applications in the previous layer, which
can also be traced for analysis purposes (i.e. who did
the last change on a specific record). Figure 2 shows
this three-level architecture.
Web server
(presentation)
Business logics
(services and components)
Data model
(database)
Access logs Program logs
Data
Figure 2: E-learning environment data architecture.
2.3 Server Log Files
For each action a user performs in the virtual cam-
pus, one or more lines representing such action are
logged in several servers. Furthermore, depending on
the type of action, several servers might log the same
action but using different information. In this work
we have used mainly the log files from the Apache
servers which act as front-ends, once them have been
joined in a single file which is generated each day.
This file is firstly preprocessed in order to remove all
those log lines which are surely not hits produced by
the user, such as the load of icons, style sheets, ban-
ners, and so. This preprocessing reduces the amount
of lines in a 90%. Nevertheless, during a typical
week, the total number of lines that needs to be pro-
cessed is still about 36 million lines, approximately 12
GB, which is indeed a very large figure. Therefore, a
second preprocessing oriented towards narrowing the
experiment is required, following the recommenda-
tions described in (Cooley et al., 1999).
Users can be uniquely identified because there is
a unique session number generated each time a user
logs into the virtual campus using his or her user-
name and password. IP addresses are discarded be-
cause there is the possibility of many user accessing
through the same proxy server which might mask the
real IP address. Therefore, it is possible not only to
identify individual users but also each individual ses-
sion, which is useful to establish the different naviga-
tional levels described in the following section. Lines
without session number are removed. Server log files
are generated on-the-fly by the 24 web servers, and
these files are copied onto other server which joins
them and applies the filters aforementioned above, in
a 24 hour basis routine, starting at 01:00am. A simple
analysis of connection patterns reveals that the low-
est server load is between 04:00am and 05:00am, so
consecutive log files are joined and split again at such
time. These daily (or weekly) chunks of preprocessed
log files are the starting point for analysis purposes.
3 MARKING STRATEGY
Our goal is to capture the real intentions of each user
navigating through the e-learning environment, but
focusing on those activities related to the learning pro-
cess (accessing the mailbox and virtual classrooms,
using learning resources, and so). From the starting
page, a set of marks is introduced in the most likely
paths followed by the learners, in order to validate
such paths and trying to discover any interesting fact
that might be relevant.
WEBIST 2007 - International Conference on Web Information Systems and Technologies
466

3.1 Action Based Marking Strategy
Each click a learner performs in a critic (i.e. impor-
tant to the learning process) element of a web page,
a call to an application in the business logics layer
is performed, and this generates one or more lines in
the web server log files. The simplest way to cap-
ture such click is adding a special parameter indicat-
ing the action performed by the learner, according
to the context where such element appears. There-
fore, adding the string "&ACTION=name" (where
name identifies the action being performed by the
user) to each relevant link causes such string to be
logged and, therefore, easily traceable. For analysis
purposes, it is important to choose action names that
are not prefixes one of the other, simplifying the use
of “grep” or similar tools for inspecting the generated
log file. The main drawback of this strategy is that
it might interfere in the correct functioning of the ap-
plication programs handling each call. For example,
if the handling servlet or CGI has a security mecha-
nism for checking the receivedparameters, this mech-
anism should be modified in order to incorporate the
new parameter. This may be very expensive for com-
plex web sites where hundreds or even thousands of
services available through servelts or CGI are already
running.
3.2 Content Based Marking Strategy
The second strategy tries to hide “transparent” re-
sources in the web pages, which generate a specific
entry in the log file when such pages are loaded (par-
tially or completely, depending on the place where
they are embedded). This is typically achieved by
adding an invisible (transparent) tiny image in the
web page, unnoticeable by the user but that will gen-
erate a new entry in the server log file when loaded,
using a simple HTML sentence like the following:
<img style="display:none"
id="uocTrack_1_0" src="trackingTag.gif"/>
This is used to capture when a learner reaches a
web page considered relevant for the learning pro-
cess. This approach is also useful to generate a log
entry when a link in a web page is accessed. This is
done by forcing the invisible image to be loaded when
the link is clicked, as shown in the following HTML
sentences:
<script> function tag2log(action) {
uocTrack_1_0.src=uocTrack_1.0.src + "?ACTION=" + action;
} </script>
<a href="http://www.uoc.edu/wiki"
onClick="tag2log(’WikiAccess’);">Wiki</a>
This strategy is more time consuming than the pre-
vious one, but it has a main advantage: it does not de-
pend on any particular call, it does not interfere with
any existing servlet or CGI, and it can be automated
in order to be incorporated in all the web pages con-
taining a particular resource or service that has been
selected to be logged.
3.3 Example
Both marking strategies can be used at the same time,
recording different kinds of user behavior. In com-
plex web sites where the same goal can be reached
from different paths, it is necessary to know not only
user actions but also other places visited as well, in
order to build a better user model for analysis pur-
poses. The following fragment of a preprocessed log
file shows marks from both types, action based and
content based. Notice that this file is simpler than the
equivalent Apache CLF one, as the IP address, times-
tamp and other fields have been replaced by user and
session identifiers and so.
166877 20060920183451 GET /cgi-bin/uocapp?s=166877 -
166877 20060920183508 GET
/trackingTag.gif?PAGE=/UOC/a/cgi-bin/hola
http://cv.uoc.edu/UOC/a/cgi-bin/hola?s=166877
166877 20060920183518 GET
/UOC/a/cgi-bin/ma_mainMailFS?s=166877&ACCIO=L_MNOUS
http://cv.uoc.edu/UOC/a/cgi-bin/hola?s=166877
...
166877 20060920183541 GET
/UOC/a/extcgi_0.html?s=166877&ACCIO=B_INICI&...
http://cv.uoc.edu/cgi-bin/uocapp?s=166877
166877 20060920183543 GET
/trackingTag.gif?PAGE=/UOC/a/cgi-bin/hola
http://cv.uoc.edu/UOC/a/cgi-bin/hola?s=166877
166877 20060920183555 GET
/webapps/classroom/032_common/plan.jsp?s=166877
&ACCIO=plan.jsp&...
http://cv.uoc.edu/webapps/classroom/032_common/
frameset.jsp?s=166877&...
In this case, a student with identifier 166877 logs
in into the virtual campus, it loads the initial web
page is loaded (trackingTag.gif?PAGE), and
he or she accesses the mailbox (ACCIO=L_MNOUS).
Then, he or she goes back to the initial web page
(ACCIO=B_INICI), which is loaded again, and fi-
nally goes to one of the virtual classrooms he or she
is enrolled to (ACCIO=plan.jsp).
3.4 Establishing a Methodology
One of the most important results of the embedding
mark proposal is that provides the web administra-
tors a simple but realistic map of the available ser-
vices in the e-learning environment and how they are
used by learners (or site users in general). Without
this map, any effort to understand user behavior be-
comes too expensive due to the necessity of identify-
ing the specific entries in log server files related to the
activity being monitored. Even trying to reproduce
previous experiments (Mor et al., 2006) for validat-
ing them with new available data becomes very diffi-
cult if the virtual environment has changed even only
CAPTURING USER BEHAVIOR IN E-LEARNING ENVIRONMENTS
467
slightly, which is not uncommon in complex web en-
vironments. Therefore, any embedding mark process
should be done according to the following require-
ments: (a) Architecture independent: all the changes
in the web site should be done in the presentation
layer only, and not in the business logics layer; (b)
Scalability: the proposed embedding mark strategy
should be the same independently of the size of the
web site being monitored; (c) Consistency: all the rel-
evant information needed for usage analysis is present
in the log files; (d) Hierarchical: in order to broad or
narrow each experiment carried out, trees and sub-
trees of marks should be activated and deactivated
easily. For example, “analyze only actions related to
the virtual classroom”; (e) Technology independent:
any change in the technological aspects of the busi-
ness logics layer should not interfere with the embed-
ded marking system; and (f) Automatization: a com-
plex web site with thousands of web pages should be
able to be modified by means of an automated script.
Studying user behavior in a web site needs to es-
tablish which elements and actions will be monitored
and further analyzed. In a web site with a wide range
of services and goals available to users, it will be nec-
essary to identify the main user tasks and the possible
user actions related to such tasks as well. Using the
cognitive walkthrough method (Wharton et al., 1994)
it is possible to obtain a first version of the sequence
of steps that users perform in order to achieve a spe-
cific task. Then, starting from this sequence and the
knowledge of the services to be analyzed, a initial set
of marks can be established for generating a first map
of the web site. This map is analyzed to discover any
gap due to an incomplete task description. This pro-
cess is repeated until a reasonable map is obtained.
4 EXPERIMENTAL RESULTS
We provide a simple experiment showing user behav-
ior once they just log in into the virtual campus. Our
goal is to determine the paths followed by the students
once they log in into the virtual campus, which is in-
teresting because the same goal can be reached from
different places, thus evaluating web design and the
relative importance of the available elements.
4.1 Data Set
The Fall 2006 academic semester started September
the 20th, 2006. This is a special day because most
users log in motivated by the fact that it is the first day,
and they want to obtain information about the sub-
jects they have enrolled into, the available resources,
and so. The preprocessed log file for such day is 7,8
million lines long (around 1,5 GB), containing infor-
mation about105000 sessions, with almost 42000stu-
dent sessions from 20000 different students. We have
selected 30000 sessions of a subset of 14600 students
for this experiment, concretely those studying any of-
ficial degree in Catalan. On the other hand, a simple
inspection reveals that some sessions show a bizarre
behavior, probably caused by a malfunctioning of the
login process. For example, there are very short ses-
sions with no interaction, which are removed, using a
threshold of 3 seconds, the minimum amount of time
for loading the initial page using a fast connection.
From the initial web page, students have access to:
(a) The mailbox, from three different buttons or links:
a message notification with the amount of new mails,
an icon representing a flag which means that there are
new messages waiting, and a main mailbox access;
(b) The list of subjects where the learner is enrolled
into; (c) The virtual classroom for each one of the sub-
jects the learner is enrolled into; (d) The notice boards
and forums for each one of the subjects the learner is
enrolled into; and (e) Other services available (digital
library, community, profile, and so).
LIST 51.2 %
CLASSROOM
2.7 %
BOARDS
44.2 %
OTHER
14.9 %
39.3 %
EXIT
2.7 %
12.6 %
START
15.2 %
13.7 %
MAIL
1.7 %
40 %
12.9 %
40.3 %
1.6 %
12 %
11.8 %
20.9 %
6.1 %
4.1 %
2.9 %
31.4 %
11.1 %
36.3 %
8 %
7.9 %
8.7 %
1.8 %
23.6 %
9 %
47.3 %
1.7 %
25.7 %
7.7 %
2.8 %
34.7 %
25.6 %
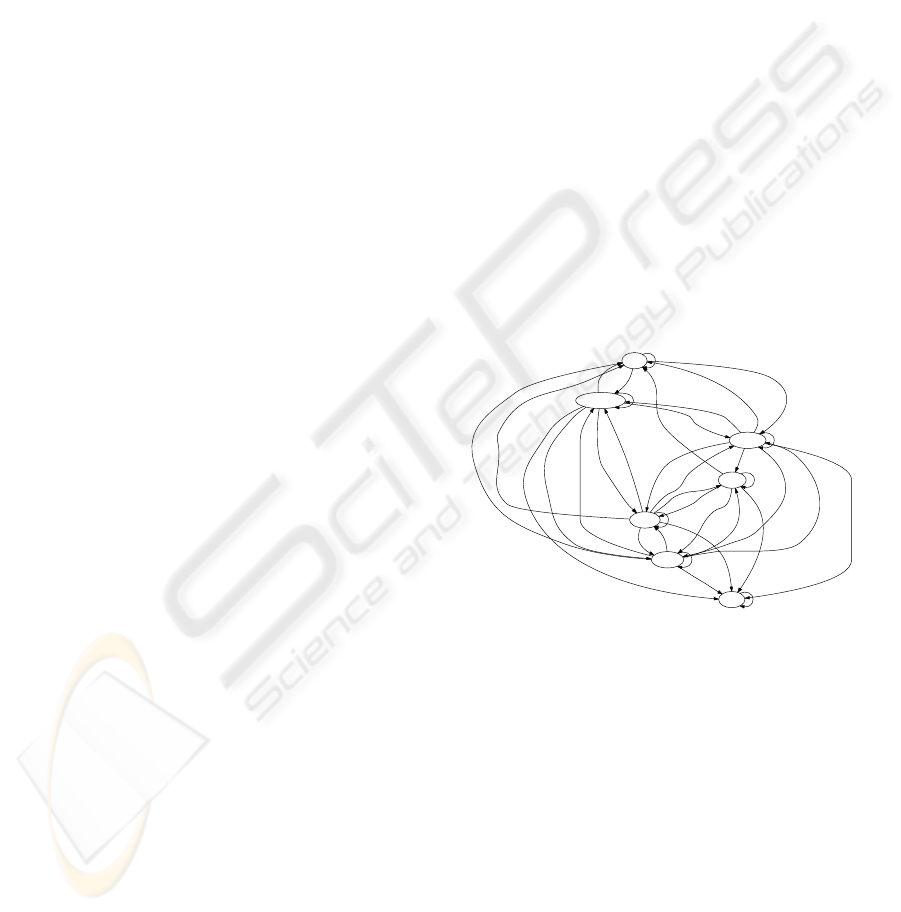
Figure 3: Most frequent navigational paths.
Results show that 49,5% of the students directly
go to the notice boards and forums as their first ac-
tion. This is normal in the first day of an academic
semester, as students read the welcome messages and
some of them write short messages introducing them-
selves as well. In second position, a 26,4% of the stu-
dents go to one of the virtual classrooms. A 12,0% of
the students go to the mailbox by means of the mes-
sage notification link, while only a 1,7% and 0,6% ac-
cess the mailbox through the main button and the flag
icon respectively. A 8,1% of the students go to the
list of subjects, and the remaining 1,7% (which is a
remarkably low figure) perform other actions. Figure
3 shows the most frequent paths followed by learn-
ers between the different spaces in the virtual campus.
WEBIST 2007 - International Conference on Web Information Systems and Technologies
468

Only relevant links between nodes have been drawn.
A link is relevant when the percentage of students that
follow such link is at least a 5% for both nodes. No-
tice that this graph includes all the possible paths, that
is, not only the first action taken from the initial page.
5 CONCLUSION
In this paper a proposal for embedding hidden marks
in web pages with the aim of user action identifica-
tion has been proposed. Two complementary mark-
ing strategies have been described: the first one, ac-
tion based, consists in adding special parameters in
the calls to applications in the business logics layer of
a web site, in order to capture the specific clicks in
the relevant elements for analysis purposes. The sec-
ond one, content based, consists in hiding invisible
pieces of content that, combined with simple scripts,
generate log entries for both user actions and navi-
gation paths. Preliminary results show that this ap-
proach is useful to face both well known problems
when analyzing large and complex web sites. First,
users’s intentions are better captured as only the rele-
vant actions (for analysis purposes) are logged. Sec-
ond, generated data are only a small fraction of the
original data stored in the web server log files, thus re-
ducing both time and space requirements for off-line
processing. A simple experiment showing user be-
havior the first day of the academic semester has been
described. This experiment reveals interesting infor-
mation, for example, students start sessions reading
all the welcome messages from the teacher and other
students, and replying such messages. This fact could
be used to design a specific initial page for the first
session during first day, when all the other available
services are not requested. Similar ideas for improv-
ing the e-learning environment can be extracted from
the results of each activity analysis, depending on the
educational context.
Current and future research in this topic should in-
clude the use of large scale web usage mining tech-
niques for clustering purposes. Analyzing the evolu-
tion of users’ behavior along a period of time is also
an interesting issue. Finally, as web services are be-
coming more “semantic”, it will be important to es-
tablish the appropriate relationships between the new
services available in the virtual campus and real user
intentions when searching or browsing such services.
ACKNOWLEDGEMENTS
This work has been partially supported by a Span-
ish government grant under the project PERSONAL
(TIN2006-15107-C02-01).
REFERENCES
Chi, E. H., Pirolli, P., and Pitkow, J. (2000). The scent of
a site: a system for analyzing and predicting informa-
tion scent, usage, and usability of a web site. In Pro-
ceedings of the SIGCHI conference on Human factors
in computing systems, pages 161–168, New York, NY,
USA. ACM Press.
Cooley, R., Mobasher, B., and Srivastava, J. (1999). Data
preparation for mining world wide web browsing pat-
terns. Knowledge and Information Systems, 1(1):5–
32.
Hilbert, D. M. and Redmiles, D. F. (2000). Extracting us-
ability information from user interface events. ACM
Computing Surveys, 32(4):384–421.
Kay, J. and Lum, A. (2004). Creating user models from
web logs. In Proceedings of the Intelligent User Inter-
faces Workshop: Behavior-Based User Interface Cus-
tomization.
Marsico, M. D. and Levialdi, S. (2004). Evaluating web
sites: exploiting user’s expectations. International
Journal of Human-Computer Studies, 60(3):381–416.
Mor, E. and Minguill´on, J. (2004). E-learning personaliza-
tion based on itineraries and long-term navigational
behavior. In Proceedings of the Thirteenth Interna-
tional World Wide Web Conference, volume 2, pages
264–265, New York, NY, USA. ACM Press.
Mor, E., Minguill´on, J., and Carb´o, J. M. (2006). Data Min-
ing in E-learning, chapter Analysis of User Naviga-
tional Behavior for E-Learning Personalization, pages
227–246. WIT Press.
Paramythis, A. and Loidl-Reisinger, S. (2004). Adaptive
learning environments and e-learning standards. Elec-
tronic Journal of e-Learning, 2(2).
Sangr`a, A. (2002). A new learning model for the informa-
tion and knowledge society: The case of the UOC. In-
ternational Review of Research in Open and Distance
Learning, 2(2).
Spiliopoulou, M. (2000). Web usage mining for web site
evaluation. Communications of the ACM, 43(8):127–
134.
Thomas, R., Kennedy, G., Draper, S., Mancy, R., Crease,
M., Evans, H., and Gray, P. (2003). Generic usage
monitoring of programming students. In Proceedings
of the ASCILITE 2003 Conference, pages 715–719,
Adelaide, Australia.
Wharton, C., Rieman, J., Lewis, C., and Polson, P. (1994).
Usability inspection methods, chapter The cognitive
walkthrough method: a practitioner’s guide, pages
105–140. John Wiley & Sons, Inc.
CAPTURING USER BEHAVIOR IN E-LEARNING ENVIRONMENTS
469
