
SERVICE ORIENTED ATMOSPHERIC RADIANCES (SOAR)
A Web Service Research Tool for the Gridding and Synthesis of Multi-Sensor
Satellite Radiance Data for Weather and Climate Studies
Milton Halem, Curt Tilmes, Yelena Yesha, Sharon Shen
University of Maryland Baltimore County, Baltimore, MD 21250, USA
Mitchell Goldberg, L. H. Zhou
NOAA NESDIS, Camp Springs, MD 20746
Keywords:
Gridding atmospheric radiances; web services, service oriented computing; SOAP messaging; SOAs; satellite
data processing; AIRS/MODIS data services.
Abstract:
Three decades of Earth remote sensing from NASA, NOAA and DOD satellites carrying successive gener-
ations of atmospheric instruments have resulted in petabytes of radiance data with successive increases in
spatial and spectral resolutions stored at different data archives in various data formats. We describe here a
web based Service Oriented Atmospheric Radiance (SOAR) prototype system built on the SOA architecture
that will enable the science community to process these valuable climate data records according to their own
gridding criteria. SOAR employs the standard XML based protocol suite of SOAP, WSDL and UDDI service
descriptions for aggregating atmospheric instrument radiance data into user specified spatial grids. SOAR
consists of three subsystems, a Client Server, a Directory Server, and a Process Server, connected to a high
performance compute cluster and storage grid by a Service Bus. The process server employs optical commu-
nications to access data and invoke algorithms on the compute/storage cluster for on-demand spatial, temporal,
and spectral subsetting Scientists can choose a variety of statistical averaging techniques for combining the
footprints of satellite observed radiances from multiple instruments to form spatial-temporal grids for their
respective studies. Animation services are also provided for viewing the results of the user specified service
requests. Results are presented for subsetting and animating a multi-year high-resolution multi-instrument
pre-gridded radiance field employing this initial version of SOAR.
1 INTRODUCTION
The objective of this paper is to demonstrate how
web based information systems technologies can pro-
vide tools that can broaden the access and ability
to use space data to a wider science and engineer-
ing community. The information systems technolo-
gies are an outgrowth of Service-oriented architec-
tures (SOA). SOA has become an important new busi-
ness paradigm for developing e-commerce applica-
tions (Barry, 2003). Web-based services employing
this architecture as a design approach can be found
today in many business organizations (Xerox, 2005),
(Sun Software), (Berger, 2006). SOA builds on the
basic language standards for communicating com-
puter messages to integrate the many business pro-
cesses of their respective administrative and/or fi-
nancial enterprise (Sullivan et al., 2005). In recent
years, this paradigm has started to emerge among sev-
eral science disciplines and is often referred to as e-
science (Hey and Trefethen, 2005) or service-oriented
science (Foster, 2005). For these applications, the
SOA approach has been extended to include an under-
lying cyberinfrastructure (i.e. computing grids, data
storage and networks) for discovery of algorithms and
their execution. Examples of such science oriented
computing are GEON (Geosciences), NEES (Net-
work Earthquake Engineering), LIGO (Gravitational-
Wave). In this paper, we address the gridding of atmo-
spheric radiances, a computational challenging satel-
lite data integration problem of high scientific rele-
vance to understanding global climate change. US
polar orbiting Earth looking satellites from NASA,
NOAA and the DOD have collected and archived
petabytes of data from operational and research satel-
lites for over three decades. These data are stored
371
Halem M., Tilmes C., Yesha Y., Shen S., Goldberg M. and H. Zhou L. (2007).
SERVICE ORIENTED ATMOSPHERIC RADIANCES (SOAR) - A Web Service Research Tool for the Gridding and Synthesis of Multi-Sensor Satellite
Radiance Data for Weather and Climate Studies.
In Proceedings of the Third International Conference on Web Information Systems and Technologies - Internet Technology, pages 371-377
DOI: 10.5220/0001274803710377
Copyright
c
SciTePress
at distributed archives with diverse formats and com-
prise one of the longest continuous satellite climate
data records available today. This paper sets out to de-
scribe in section 2 the challenges in producing a grid-
ded array of radiances derived from satellite borne in-
struments. Section3 then discusses the relevance of
this problem for the science community as well as
others. Section 4 describes the architecture of a ser-
vice oriented atmospheric radiance prototype system
for gridding remote sensing data that we call SOAR.
Section 5 presents examples of results obtained from
invoking subsetting services for multiple sensors.
2 THE SOAR GRIDDING
PROBLEM
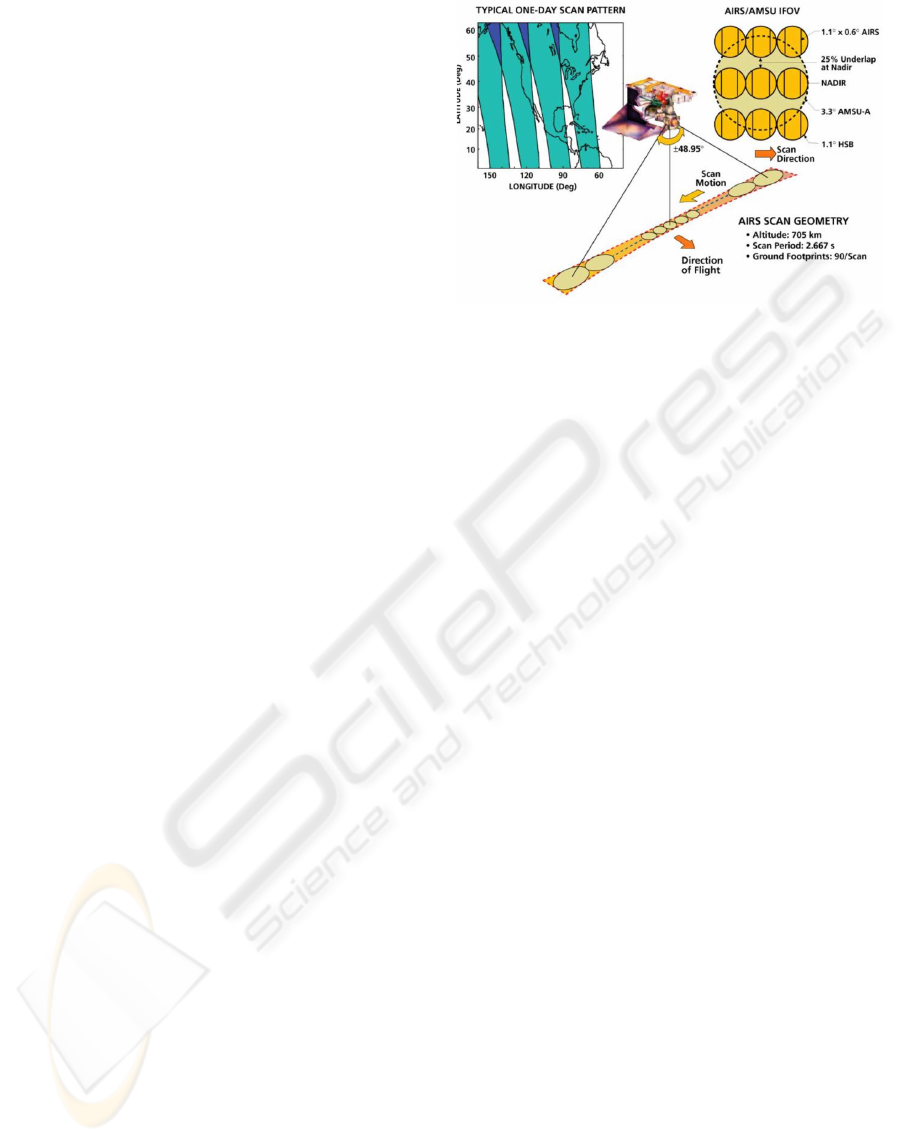
Polar orbiting satellites carrying Earth viewing radia-
tive sensing instruments of the electro-magnetic spec-
trum travel in circular trajectories passing over the
South and the North poles as the Earth revolves be-
neath the orbit. A satellite at a height of ∼ 700 km
on average takes ∼ 100 minutes to complete one po-
lar orbit thus providing ∼ 14 orbits per day. The sub
satellite nadir path covers ∼ 7 km per second. Thus,
depending on the instruments dwell time sensitivity
needed to build up a high signal to noise ratio, the
area of the fields of view (fovs) for determining the
radiance from a spot or fov on the Earths surface can
range from 1 sq. km to 100 sq. km depending on the
spectral interval width being measured and the state
of advances in CCD technology at the time of the
design implementation of these instruments. In ad-
dition, these instruments scan across the nadir track
a distance of 1200 km providing additional spots or
fovs coverage at the same time needed to collect a
nadir pixel as shown in Figure 1 for the AIRS and
AMSU instruments. The scanning thus gives nearly
twice daily coverage of the atmospheric radiances for
every spot on the Earth except for some gaps at the
Equator. Such gaps are overlapped with data gen-
erally after three days of radiance collection. The
instruments of interest for this study are those that
collect the emitted radiation in the visible, infra-red
and microwave regions that can be employed for at-
mospheric temperature profiling. Table 1 lists some
instruments that capture atmospheric radiances along
with various detector characteristics such as spectral
channels, spatial resolutions, scanning angle ranges,
satellite and dates of data coverage.
Table 1 shows the variety of instruments and their
different scan and fov geometries. The gridding prob-
lem consists of forming an array of radiances rep-
resenting a specified spatial and temporal resolution
Figure 1: Cross track scan fov patterns and overlap fovs for
two atmospheric radiance instruments, AIRS and AMSU
currently flying on the NASA research satellite AQUA.
by combining radiance channels of instruments of
different spatial and spectral resolution and differ-
ent viewing angles. For example, to combine the
MODIS temperature profiling channels with the ap-
propriate AIRS temperature channels one has to con-
sider merging 1 sq. km fovs with 14 sq. km spots,
as well as the narrower AIRS spectral channels with
the broader MODIS channels both with different scan
angles. For these considerations, there are well tested
scientific convolutions algorithms to combine AIRS
channels into a broader MODIS-like spectral band as
well as limb correcting algorithms for rapidly convert-
ing the different scanning angles into nadir-like view-
ing spots. A variety of options exist for specifying
how the different spatial resolutions can be combined
depending on the intended applications.
In addition to dealing with the geometric issues
posed by integrating multiple sensors, the different
formats and distributed nature of the archives make
access a highly desired attribute for a community tool.
Since it is common today for scientists and other po-
tential users to expect rapid access to conduct their
studies and most of the historical data are stored on
tape media, having global gridded radiance arrays
available on disk media with very high resolution (i.e.
at 0.25 deg X 0.25 deg.) will make it possible to de-
liver on-demand supersets of this array in near real
time. Further, if users want even higher resolution re-
gional arrays say over the US or Europe, then creating
arrays at say 1 or 2 sq. km from MODIS can be gen-
erated from the off line data for a given region but
then stored on line to meet future client requests for
subsets or supersets of these grids.
WEBIST 2007 - International Conference on Web Information Systems and Technologies
372
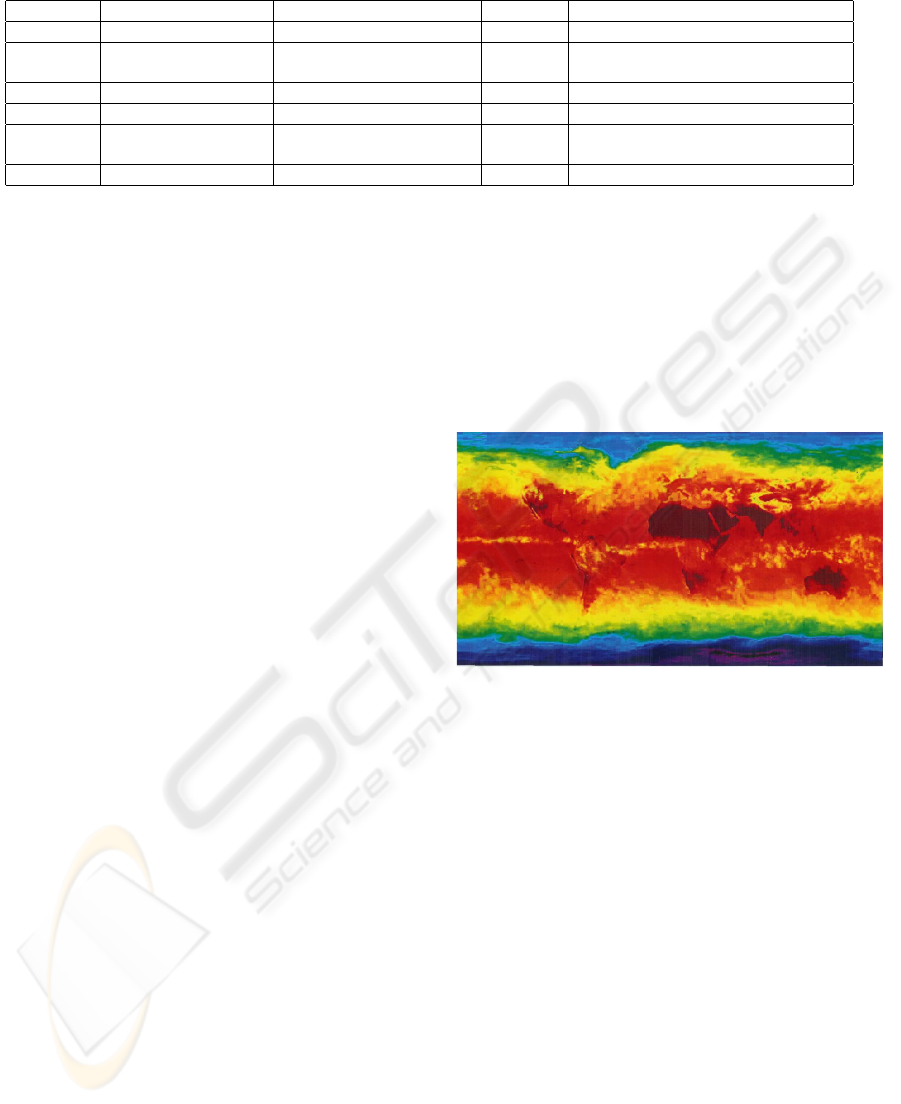
Table 1: NOAA and NASA atmospheric radiance sensors for temperature sounding.
Sensor Number of Channels Band Width Swath Spatial Resolution
MODIS 36 620 nm - 14.385 um 2330 km 250m - 1000m
AIRS 2378(IR), 4(VIS) IR 3.74 um - 15.40 um 1650 km 13.5 km horizontal at
VIS/NIR 0.4 um - 1.0 um nadir, 1km vertical
AMSU-A 15 3 MHz - 6000 MHz 2343 km 48km
AMSU-B 5 500 MHz - 2000 MHz 2343 km 16km
HIRS/3 20 0.69 um - 15 um 1127 km 20.3 km (1.4 degrees IFOV) at nadir
HIRS/2 18.9 km (1.3 degrees IFOV) at nadir
AVHRR 5 0.58 um - 12.5 um 2399 km 1.1km
3 RELEVANCE OF
MULTI-SENSOR GRIDDED
RADIANCES
The principal output of SOAR is to deliver client
specified multi-sensor gridded radiance fields (i.e.
Level 3 data sets) from one or more atmospheric
sounding instruments chosen from one or more polar
orbiting satellite platforms. Gridded radiance fields
greatly reduce the volume of data, often called thin-
ning, by some form of statistical operation of bin-
ning data into a grid box. This is the most frequently
used format for Earth science modelers and analysts
who wish to display maps, ingest data for forecasting
models, validate weather and climate models and for
the study of climate change trends.. Currently, grid-
ded radiance fields are available as a standard prod-
uct from some EOS instruments. However, such grid-
ded products for multiple instruments are generally
not available as standard products. The unique contri-
bution that SOAR offers users is the ability to choose
the specific physical and statistical algorithm options
and resolutions.We describe the concepts of the grid-
ding service which are fairly intuitive by an example
below. The challenge is in providing this as a service
implementation. Let us consider an example of how
these three elements are implemented for a specific
user request. We show in Figure 2 the image that was
produced at JPL (Chahine, 2003) by the AIRS instru-
ment scientist, Dr. M. Chahine. This example shows
what unanticipated products are possible with grid-
ded radiance data even from just one spectral channel.
The global gridded data set which is color coded and
displayed is a monthly mean average radiance field
for April 2003 taken directly by the single spectral
window channel number 20 of AIRS which corre-
sponds to a wave number at 0.381um. The daily radi-
ance observations falling in each grid box of resolu-
tion 1 degree by 1 degree over the globe are averaged
for the month. The clouds have not been removed
and account for some of the blurring shown in yel-
low of stationary features at higher latitudes.. Clearly,
the number of such products that can be produced
from all the combinations of spectral channels will
enable the broader community of modelers and cli-
mate analysts to readily investigate seasonal, annual
and short term aspects of climate variability that have
so far been impractical with their available resources.
The instruments this system initially addresses are the
AIRS, AMSU instruments on AQUA.
Figure 2: Gridded monthly mean AIRS radiance data, April
2003, from a single window channel at 2616 wave number.
4 SOAR COMPUTING
ARCHITECTURE
Figure 3 depicts the typical Service Oriented Archi-
tecture, comprised of three primary subsystems: the
Client Server, the Directory Server, and the Process
Server. The Physical Resource Layer represents the
hardware that supplies computing resources to the
subsystems. The Client Server represents the users
of the service, which could be a human interacting
through a web browser based GUI, or a computer in-
teracting with the SOAP server directly. Traditional
SOA includes a Directory Server that is used to adver-
tise the services where clients can discover them. Fi-
nally, the Process Server receives the service requests
and arranges for the actual science algorithms to be
executed. The standard XML based protocols SOAP,
WSDL and UDDI are used to communicate between
servers for receiving and issuing requests from all
SERVICE ORIENTED ATMOSPHERIC RADIANCES (SOAR) - A Web Service Research Tool for the Gridding and
Synthesis of Multi-Sensor Satellite Radiance Data for Weather and Climate Studies
373
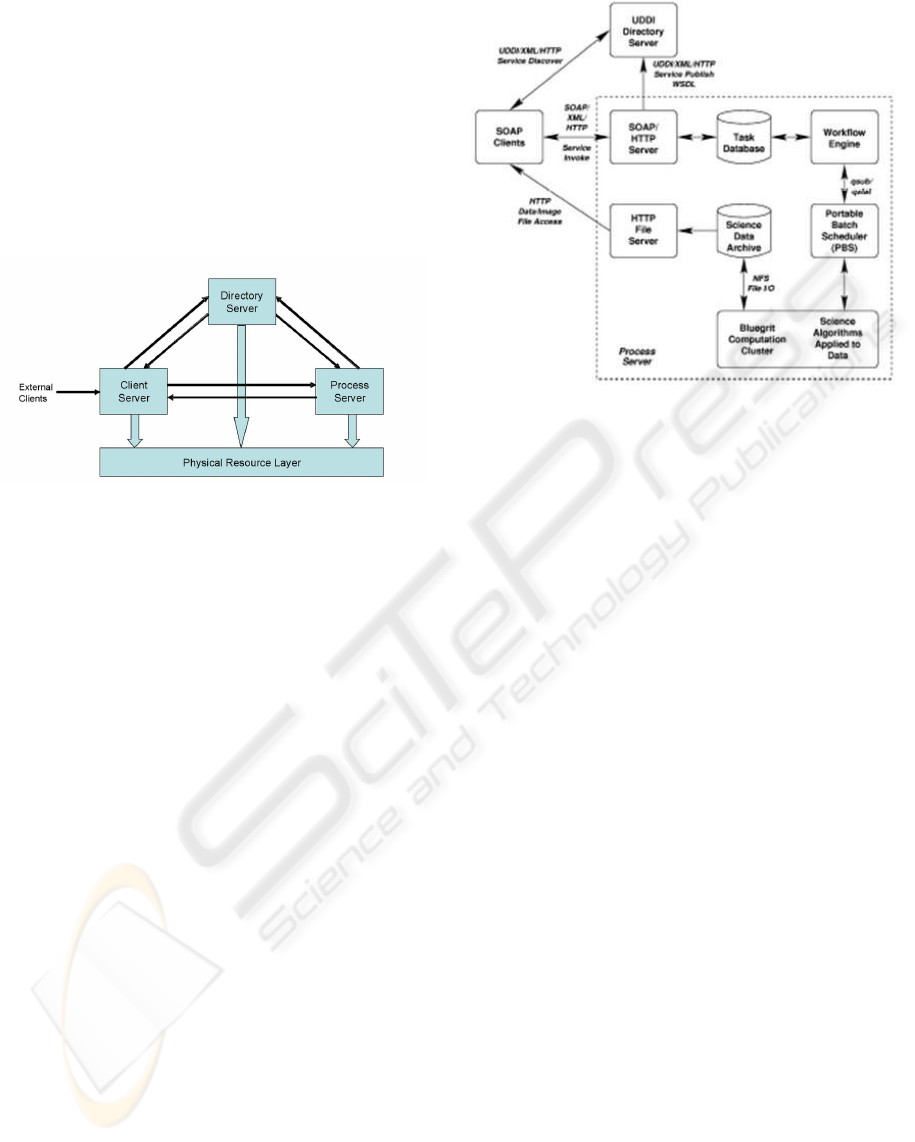
three servers. Based on those requests, a final prod-
uct is delivered to the user. All of these requests are
related to atmospheric-science data sets. Using the
web service, science or non-science users do not have
to download huge amounts of data and process it lo-
cally. Figure 4 shows a detailed component-based de-
scription of the architecture. It also shows the inter-
action from a SOAP-enabled browser such as Mozilla
Firefox. The following sections describe the system
architecture functionality.
Figure 3: SOA Architecture Block Diagram.
4.1 Client Server
The service-oriented architecture classically relies on
a typical application server to integrate the various
web services into one cohesive solution. However,
there is no reason that the client cannot represent it-
self to the process server. The Soar web applica-
tion was relegates the client server to serving only
the most basic content. Initially, the browser requests
the javascript libraries that define the AJAX interac-
tions and the basic xhtml structure of the Soar web
application. For our implementation, soap libraries
were used to enable the client’s direct communica-
tion with the Process Server. From this point on, the
web server is only contacted incidentally to provide
images and applets that support the look-and-feel of
the web application. Every web service comes in
pairs of methods; one method that actually provides
the web service and another method that returns an
XHTML block necessary for the browser to present
that web service to the user. The SOAP Web Ser-
vices offered by the Process Server are completely
described in WSDL and available to the clients as a
standard GUI. The standard GUI provides an interac-
tive set of web dialogs to capture data selection cri-
teria and gridding directives.. The criteria are sub-
mitted to the Process Server as a SOAP/XMLrequest
which executes the needed science algorithm. Other
web services provide status of pending requests and
ultimately the results of the request back to the client.
Figure 4: Internal Architecture with an independent SOAP
Client.
4.2 Process Server
The Process Server provides the data processing ca-
pabilities required to transform data products to meet
requests submitted by the client. It is comprised of a
number of distinct cooperating systems as shown in
Figure 5.
4.2.1 SOAP/HTTP Server
The criteria comprising each individual request is
submitted, either by an independent SOAP client, or
the SOAR WWW Browser GUI to a SOAP web ser-
vice running under Apache/Axis. That server submits
the request using SQL to a PostgresSQL based Task
Database which queues all the requests. In addition
to the science algorithm web service methods, there
are a number of additional web services for login, re-
trieving task status, retrieving results from a task and
removing a task from the database.
4.2.2 Task Database
The database maintains the state of the system. It
tracks the users registered with the system and web
sessions the user is interacting with. Web sessions are
simply a way to distinguish separate logins within the
system. Each request submitted by a client on behalf
of a user is stored as a task, along with the method or
algorithm requested, the parameters needed to gov-
ern the execution of the algorithm, the date/time the
request was submitted, and, eventually, the date/time
the request was completed.
WEBIST 2007 - International Conference on Web Information Systems and Technologies
374

4.2.3 Workflow Engine
When a new request or task is inserted into the
database, the Workflow Engine examines and allo-
cates the task. If the task is a primitive task, it is sub-
mitted directly to the Portable Batch Scheduler (PBS)
for processing. If the task is a compound task, it is
broken down into child tasks, which themselves could
be compound or primitive. As the primitive tasks
complete, their results are listed in the database. If a
primitive task has a parent compound task, the results
are rolled up to the parent. A compound task is com-
pleted only after all the primitive tasks it depends on
complete. For example, there is a primitive method
DailyImage which produces an image from a single
day of AIRS or AMSU data. One of its parameters
is the data day to process. Another method DailyIm-
ageRange is a compound method that takes parame-
ters startdate and enddate. When the work flow engine
considers a new DailyImageRange request, it creates
additional DailyImage tasks for each day of the range.
All the primitive tasks are submitted at once to PBS.
4.2.4 Portable Batch Scheduler
When a primitive task is submitted to SOAR, the qsub
process of PBS is used to submit the task to PBS. PBS
monitors the computation resources available on the
Bluegrit Computation Cluster and schedules the tasks
to run as resources are available. PBS will execute
as many jobs in parallel as it can within the comput-
ing resources available, and as jobs complete, the next
queued job will be executed.
4.2.5 Bluegrit Computation Cluster
Bluegrit is an IBM cluster comprised of 32 blades
with 2.2 GHz IBM dual powerpc CPUs. It is con-
nected to the outside world through a management
node. The SOAR work ow software submits software
through PBS by an SSH connection from the database
on Matisse to the Bluegrit management node. PBS al-
locates one of the blades to execute each job.
4.2.6 Science Data Archive
The Bluegrit Computation Cluster includes a 2.2 TB
shared filesystem which is available on all the individ-
ual nodes of the cluster from a large Intel based NFS
server. The input science data sets needed for pro-
cessing reside on the disk, and any files created during
processing are output to the filesystem. Currently, for
the test system, it holds 15 months of AIRS/AMSU
gridded data. Eventually other tasks will be inte-
grated in the system that will extend the current static
Science Data Archive to interact with external data
archives at NASA and NOAA to retrieve needed in-
put data on demand. Additionally, whenever a science
algorithm task is submitted the cluster, prior to ac-
tual execution, the programs check the Science Data
Archive to see if a meeting the requested criteria al-
ready exists from a previous request. If so, the request
is not recreated, it is simply returned as the result of
the new request.
4.2.7 HTTP File Server
When data files, images, or animations are created on
the cluster and stored on the Science Data Archive,
they are made available to the end user through a
read/only HTTP file server running on the Bluegrit
management node. The URLs for the result files
on the Bluegrit HTTP server are stored in the task
database and returned to the client through the SOAP
server on request.
4.3 Directory Server
The traditional mechanism for discovery of web ser-
vices is through a UDDI server, and WSDL defini-
tion for SOAR could be registered with a UDDI server
with appropriate keywords for an independent user to
discover and access the server. The WSDL includes a
complete description of the SOAP web services avail-
able from the Process Server, and sufficient informa-
tion for a SOAP client to access the system.
4.4 Web Services
As previously mentioned, in addition to the science
algorithms, the system includes a number of ancillary
web services for interacting with the system. These
include login, UserTaskStatus, CompletedTasks, Ge-
tResultsById and RemoveTaskById.The focus of the
current development has been to construct a frame-
work for web services which can later be extended
by adding additional algorithms. As discussed above,
the tasks are processed individually, while compound
tasks are composed of multiple primitive tasks. These
algorithms utilize the GrADS system(Goldberg et al.,
2003), a tool that is widely used by the atmospheric
science community for performing science data visu-
alizations.
SERVICE ORIENTED ATMOSPHERIC RADIANCES (SOAR) - A Web Service Research Tool for the Gridding and
Synthesis of Multi-Sensor Satellite Radiance Data for Weather and Climate Studies
375
5 STATUS OF CURRENT SOAR
IMPLEMENTATION
A prototype version of SOAR is installed at a user ac-
cessible web site at UMBC (SOAR). The web site im-
plements the above described client server features to
specify requests and discover information on services.
This web site incorporates user registration function-
ality with a front end to the systems data process-
ing capabilities. It also contains animation service
options. The current SOAR implementation allows
the system to perform subsetting for arbitrary bound-
ing boxes and time durations with a relatively high
resolution for a pre-computed AIRS/AMSU gridded
data set. This data set is for a spatial grid resolution
of 2.0 deg. latitude by 0.5 degree longitude which
have been limb corrected and where the 3 X 3 foot-
print array of AIRS fov selected within the AMSU
fov which falls within a grid element. The data were
prepared by NOAA/NESDIS on their Process server
and transferred over the network to the NASA pro-
cess server where the meta database is updated to re-
flect the available periods for which the gridded data
are available. NASA then transferred the data to the
UMBC SOAR data management system for archiv-
ing. For this prototype study, the current holdings
consist of 1.25 TBs of daily data gridded data sets for
the period Jan.1. 2005 to March 31, 2006. Select pre-
choreographed scripts were developed to dynamically
invoke and perform temporal/spatial/spectral subset-
ting services as may be requested by the user GUI
interface, and to enable a product to be animated for
the desired instrument channels for any chosen avail-
able time period. Users interested in viewing atmo-
spheric changes over certain regions or globally, can
select such regions from a specifying a bounding box
on the globe with out having to enter the coordinates
for the desired region. The visualization services uti-
lize the GrADS system that is widely used by the me-
teorological community. GrADS offers a variety of
capabilities in graphing and animating data in four di-
mensions. The main use of GrADS in this project is to
analyze, process, and display data according to user-
specified parameters. The process server converts
user requests into command line inputs to GrADS.
In the prototype, GrADS accepts commands from the
process server, locates data within the local cache,
processes the data, and stores an image along with
the associated binary data in a user download cache.
The image location is passed back to the web server
for display via a link in the a Directory Results page.
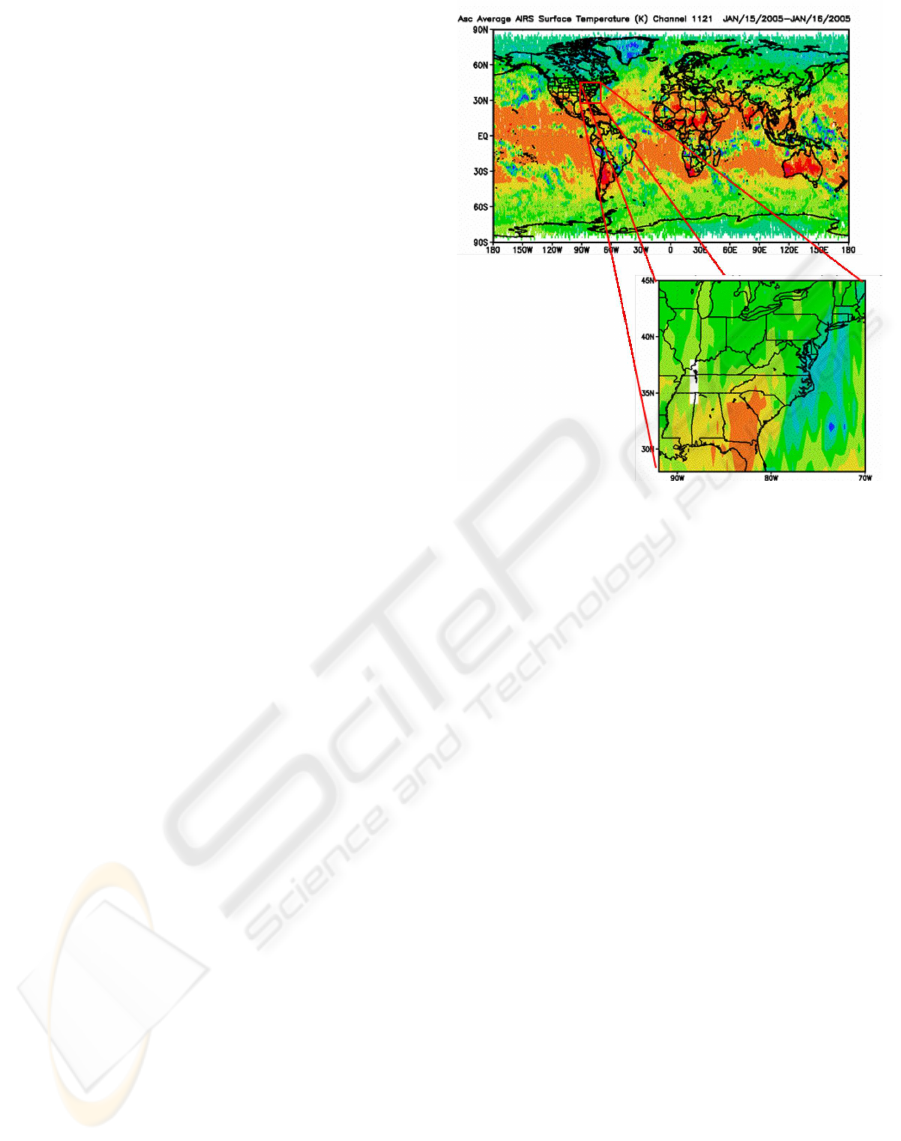
Figure 5 illustrates the subsetting display of a por-
tion of the East coast of the US extracted from the
daily AIRS data set archived at UMBC and averaged
Figure 5: Spatial Subsetting.
over a month. For our implementation, once the sub-
setted data are properly selected, the system simply
passes the selected data sets and the subsetting param-
eters to the GrADS system which in turn performs the
averaging of the data set and returns an updated data
set and corresponding display.
6 CONCLUSION
This prototype has effectively demonstrated a dy-
namic, user-friendly application to access multiple
satellite instruments for the research of atmospheric
data, process the data as requested by the user, and
deliver the processed data. Although not all of the
final project goals have yet been implemented, the
prototype has delivered an extensible framework to
which additional features such as convolving and
cloud clearing algorithms can easily be incorporated
to provide a system that meets all project goals. This
prototype has demonstrated on a small scale that the
dynamic generation of science data products and im-
ages, as opposed to the use of static data products
and images on existing web sites, is in fact possible.
While much additional work yet remains on each of
these additional features before they can be fully oper-
ational, the foundation has been laid for an evolvable
system configuration to meet current and future client
demands.
WEBIST 2007 - International Conference on Web Information Systems and Technologies
376

ACKNOWLEDGEMENTS
We would like to express our appreciation to Brian
Blackburn and David Chapman for their contributions
in developing the browser based dynamic client server
SOAP messaging capability.
REFERENCES
Barry, D. K. (2003). Web Services and Service oriented
architectures. The Savvy Managers Guide 1. Morgan
Kaufman Publishers.
Xerox Enhances productivity with IBM Service
Bus Solution and Service Oriented Archi-
tecture (2005). October 28. http://www-
306.ibm.com/software/success/cssdb.nsf/CS/SPAT-
6FCQB2?OpenDocument& Site=wp
Ensuring the Competitive Edge; Transamer-
ica Life Insurance Company Simpli-
fies Infrastructure with Sun Software.
http://www.sun.com/products/soa/success.jsp#1
Berger, A. K. (2006). Getting an E-Biz Up and Keeping it
Running. May 17. http://www.EcommerceTimes.com
Sullivan, J. O., Edmond, D., Hofstede and A. H. M. ter
(2005). The Price of Services. In ICSOC-2005 Pro-
ceedings 3rd International Conference Amsterdam,
Netherlands.
Hey, T. and Trefethen, Anne E. Cyberinfrastructure for e-
Science. Science 2005, Vol.308 pp. 817-821
Foster, I. Service-Oriented Scienc. Science 2005, Vol. 308,
pp 814-817
Geosciences Network. http://www.geongrid.org/
Network for Earthquake Engineering. http://it.nees.org
Laser Interferometer Gravitational-Wave Observatory.
http://www.ligo.caltech.edu/
NRC of National Academies of Science. Climate
Data Records from Environmental Sciences, National
Academies Press 2004
Chahine, M. (2003). JPLAIRS Image Archive June 2003.
http://www.airs.jpl.nasa.gov/Multimedia
GrADS Home Page. Center for Ocean-
Land-Atmosphere Studies. 25 Apr 2006.
http://www.iges.org/grads/grads.html
Goldberg, M. D., Qu, Y., McMillin, L. M., Wolf, W., Zhou,
L. and Divarkarla, M. (2003). AIRS near-real-time
products and algorithms in support of operational nu-
merical weather prediction. IEEE Trans. Geosci. Re-
mote Sensing, vol. 41, pp. 379-389, Feb. 2003.
SOAR Home Page. http://iclass.cs.umbc.edu/SOAR
SERVICE ORIENTED ATMOSPHERIC RADIANCES (SOAR) - A Web Service Research Tool for the Gridding and
Synthesis of Multi-Sensor Satellite Radiance Data for Weather and Climate Studies
377
