
VECTOR BASED MAPPING OF POLYGONS ON IRREGULAR
TERRAIN MESHES FOR WEB 3D MAP SERVICES
Arne Schilling, Jens Basanow and Alexander Zipf
i3mainz - Institute for Spatial Information and Surveying Technology, University of Applied Sciences FH Mainz
Holzstraße 36, Mainz, Germany
Keywords: Cartography, Geographical Information Systems, computational geometry, 3D landscape models.
Abstract: In this paper we show how to efficiently integrate traditional GIS data into terrain models in order to
generate complete 3D maps with little overhead for textures. The results meet the requirements for the Web
3D Service (W3DS), a proposal for the standardization for delivering 3D web maps. Our approach is
designed to create fully vectorized 3D scenes that deliver the best possible quality and do not require
dynamic texture generation and handling. We describe the mesh operations for integrating polygonal GIS
data like forests, parks, buildings blocks, or streets into the terrain mesh and compare the results with a
texture based approach.
1 INTRODUCTION
In recent years much effort has been invested into
the standardization of 3D GIS (Geographical
Information Systems) solutions and to make them
suitable for web applications. The Open Geospatial
Consortium (OGC) plays a major role in this
standardization process and has already issued a
range of specifications for GIS web services, e.g. a
Web Map Service (WMS) or Web Feature Service
(WFS). Currently the foundations for exchanging 3D
GIS related data structures and graphics over
internet protocols are being discussed and first
solutions implemented. The new specifications and
recommendations include a Web 3D Service (W3DS
- OGC 2005) which delivers 3D map display
elements that can be explored in real time by any
web client, and an information rich data exchange
model (CityGML - Kolbe et al. 2005) that is
specifically designed for 3D city models. The latter
incorporates not only the geometrical description but
also semantic information of typical GIS objects.
In order to make a 3D Spatial Data Infrastructure
(SDI) work, which is the eventual goal of our
activities, it is not sufficient to agree on the technical
interfaces. A major research topic is related to the
integration and preparation of various data coming
from different sources. This refers to the automatic
assembly of different Levels of Detail (LODs),
integration of official cadastre data (Stoter 2004),
terrain-object integration, point object processing,
and other problems. In Schilling and Zipf (2002) the
authors showed how to apply such integrated
visualization models for 3D tour animations.
In this paper we focus on the integration of
traditional 2D GIS data into 3D landscape and city
models which use terrain models as basic height
source. Such models may be referred to as 2,5D, but
can be complemented with models coming from 3D
databases. The 2D data comes typically from a WFS
and must be mapped on the terrain model based on
Triangulated Irregular Networks (TIN).
The remainder of this paper is structured as
follows. First, we compare different approaches for
the integration of 2D GIS data and digital elevation
models. Then we briefly explain the technical
background and requirements before we go into
detail about the geometrical operations of our
approach. In the last section we compare our results
with an image based overlay.
198
Schilling A., Basanow J. and Zipf A. (2007).
VECTOR BASED MAPPING OF POLYGONS ON IRREGULAR TERRAIN MESHES FOR WEB 3D MAP SERVICES.
In Proceedings of the Third International Conference on Web Information Systems and Technologies - Web Interfaces and Applications, pages 198-205
DOI: 10.5220/0001274201980205
Copyright
c
SciTePress

2 RELATED WORK
We can distinguish 2 general approaches how to
display 2D vector data together with surface models.
1) The most common approach is to render
vector graphics into an image and to project it on the
terrain as texture. Traditional GIS layers, raster data,
and sometimes scanned paper maps are overlaid and
combined to a single texture layer (e.g. Haeberling
1999). Additionally, hardware accelerated
techniques like mip-map filtering and image
pyramids can be used to optimize rendering speed
and memory consumption.
In contrast to this static method also a dynamic
version has been investigated by Kersting and
Döllner 2002. They extend the concept of static
texture pyramids and introduce on-demand texture
pyramids, which are not prepared in a pre-
processing step, but rendered for each frame using
an off-screen pixel buffer (p-buffer, see also Wynn
2001). The advantage of this method is that huge
amounts of texture data that would be necessary for
every possible resolution don’t need to be
transmitted over the network. Instead, only the 2D
vector data is being transmitted. Since the p-buffer is
hardware accelerated, the images of the texture
pyramids can be rendered on demand for arbitrary
resolutions.
2) The second approach is a geometry based
mapping, i.e. to adapt the 2D vector data to the
surface of the terrain model and to render it as
separate geometric primitives.
Wartell et al. 2003 show how to overlay 2D
polylines on top of terrain models. The overlayed
polylines are rendered independently from other
image data due to rasterization artefacts. They
present the triangle clipping DAG (direct acyclic
graph) data structure which allows rendering the
projected polylines together with a quad-tree based
terrain model. They address the challenging problem
of combining progressive terrain meshes, which
change at nearly every frame as described by e.g.
Hoppe 1998 or Lindstrom and Pascucci 2002, with
3D polyline data, which also needs to adapt
accordingly.
Agrawal et al. 2006 use a similar technique for
combining a textured terrain model with polyline
data. In their case, the terrain is organized as block-
based LOD structure derived from a height raster,
which allows efficient memory paging and
optimized data structures like triangle-strips. Due to
this block-based simplification and visualization
scheme (9 tiles are visible at one time), height values
can be picked up for each line segment from the
underlying mesh with the highest resolution. Over
meshes with lower resolutions, these height values
must be corrected accordingly.
Schneider et al. 2005 show how to handle
polygonal GIS data in a similar manner. The
polygon borders are treated in a similar way as the
polylines described above. The interior of the
polygon is triangulated and added to the new
geometry, to which a z-offset is added in order to
avoid interference with the terrain and rendering
artefacts. An overview of earlier works in this field
and some foundations on practicable topological
data structures is provided by Lenk 2001.
Both approaches have advantages and
drawbacks. A naïve texture mapping without
dynamic rendering is suitable for remote sensing
raster data like satellite imagery. Vector GIS data
like streets, borders, and landuse areas require a
much higher resolution in order to avoid aliasing and
jagged edges. Especially thin lines must be drawn
with variable width, otherwise they will be filtered
out or look odd in the far distance. Vector
integration requires more complex geometric
operations and is more expensive in the preparation
phase. Overlaying triangulated polygons on top of
the terrain causes huge overheads for large areas.
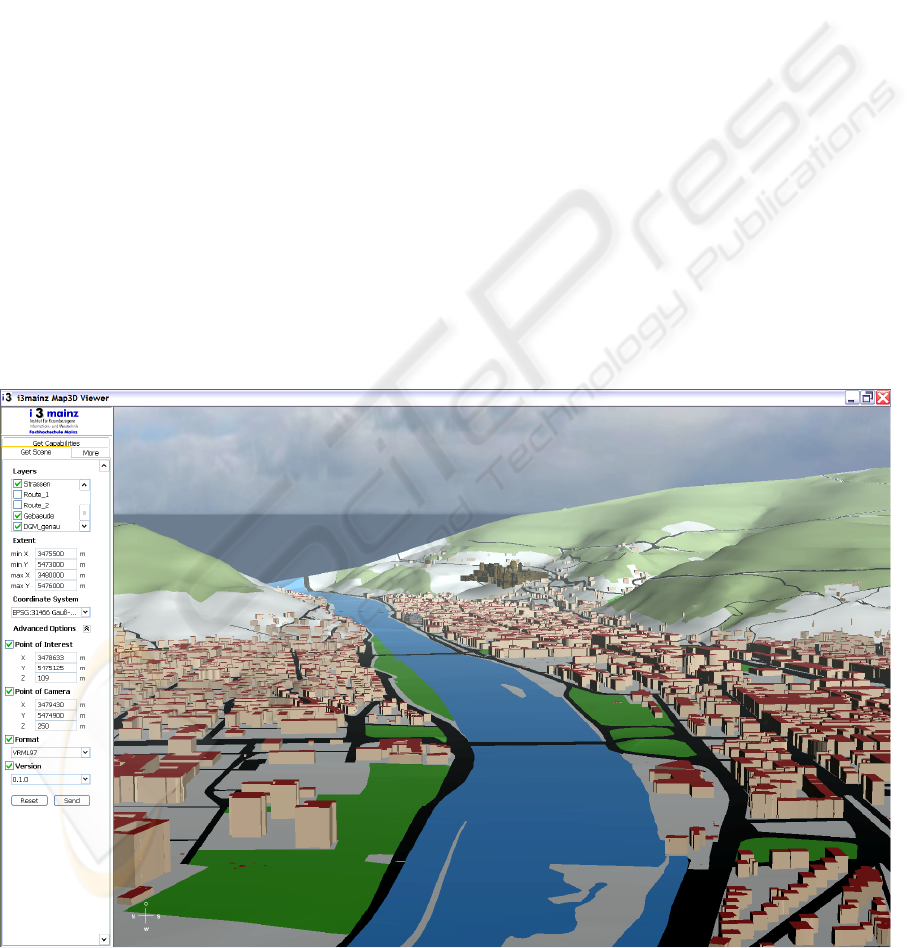
3 WEB APPLICATION FOR 3D
MAPS
The presented work is embedded in a larger project
that involves a 3D web map server, catalogue
services, several clients and the integration of
various data sources (see Figure 6 for a screenshot of
the web client). We give a brief introduction in the
deployed technologies since they provide important
implications and also constraints for the presented
method for 3D map generation. In this project,
among other issues, we implement two technologies
that have been proposed to the Open Geospatial
Consortium (OGC) as Discussion Papers.
Finally the need for standardization of
geographical 3D web services has been
acknowledged, which led to the first efforts in that
direction. A specification for the delivery of
perspective views of digital terrain models has
already been accepted, the Web Terrain Server
(WTS) – it will be renamed Web Perspective View
Service (WPVS) in future versions. Being an image
based service, it does not support interactive
applications very well. The Web 3D Service
(W3DS) goes one step further (OGC 2005). The
VECTOR BASED MAPPING OF POLYGONS ON IRREGULAR TERRAIN MESHES FOR WEB 3D MAP SERVICES
199
parameters are similar to those of the WTS. The
requested area is described as simple bounding box.
Information on available layers and styles is
provided by the server using the GetCapabilites
request. The GetScene request delivers complete 3D
scenes that can be displayed by web browsers or
integrated in specialized client software. VRML 2.0
must be supported as basic format, but also other
formats can be used. The requested area is described
as simple bounding box. Optional parameters
include a point of interest, a point of camera and a
style for each layer based on the OGC Styled Layer
Descriptor (SLD).
The W3DS follows the concept of a medium
server & medium client scheme, that is, the server is
responsible for the data integration and transfers the
display elements to the client, which is rendering the
scene in real time. Usually browser plugins that
support the specified format are downloaded from
third party companies and used for rendering and
navigation.
Dynamic concepts like continuous LODs for
triangle meshes or streaming of geometry parts are
not incorporated, which is on the one hand beneficial
for the broad applicability, but on the other hand
shows the need for developing standards that cope
with classical GIS features as well as techniques that
are already state of the art in computer graphics.
In our scenario we need to be able to support
desktop computers as well as mobile handsets such
as cell phones equipped with 3D graphics chips.
Consequently, the scenes that we deliver to the client
are static. However, block based visibility schemes,
in which complete tiles with variable size and LOD
are streamed to the client, are still feasible.
The second important technology that we deploy
is the CityGML specification that addresses
interoperability problems during data exchange
between different systems (Kolbe et al. 2005). It has
been developed by the SIG3D (Special Interest
group of the Geodata Infrastructure of North-Rhine
Westphalia, Germany) and proposed to the OGC in
June 2006 as discussion paper. The geometry
description is based on the Geographic Markup
Language (GML), but furthermore includes
materials and textures, prototypic objects,
aggregations and 5 predefined LODs. Although
CityGML is primarily envisaged to completely
describe any 3D city model, and not 2D vector
maps, it is mentioned here because some important
interrelationships between the terrain model and
built objects are addressed. First, it introduces the
concept of closure surfaces, which are used to seal
holes in the ground. Open structures like tunnels and
pedestrian underpasses can be modelled this way.
The triangulation of the terrain is not perforated
since the closure surface belongs to both object and
terrain. Similar to closure surfaces are terrain
intersection curves, which describe the exact
location where a building is touching the ground.
Using these curves, buildings floating over or
sinking into the ground can be avoided.
Both kinds of curves need to be integrated into
the terrain using a similar method as described in the
remaining part of this paper. However, the height
values must be taken from the input curves.
4 APPROACH FOR POLYGON
INTEGRATION
Reviewing the preconditions above, we can state
that:
a) dynamic off-screen rendering is not
supported by standard web browsers,
b) the amount of transmitted data should be
as small as possible, especially when we
consider low bandwidth mobile networks,
c) raster images are very inefficient for
representing polygonal data.
Therefore, geometric mapping should be preferred
over image based mapping. In this paper we pursue
an approach that produces fully vectorized 3D maps.
Polygonal data sets such as building blocks, green
areas, forests, and roads are loaded from 2D GIS
layer files and integrated into a custom Constrained
Delaunay implementation for the terrain. The main
properties of this method is, that the shape of the
terrain is not altered, and z-buffer problems do not
occur, since the resulting terrain is still a single
continuous surface but with integrated areas that
represent the input 2D shapes. After the geometrical
integration operation we can identify the triangles
lying completely inside the area and mark them as
owned by the GIS layer the polygon comes from.
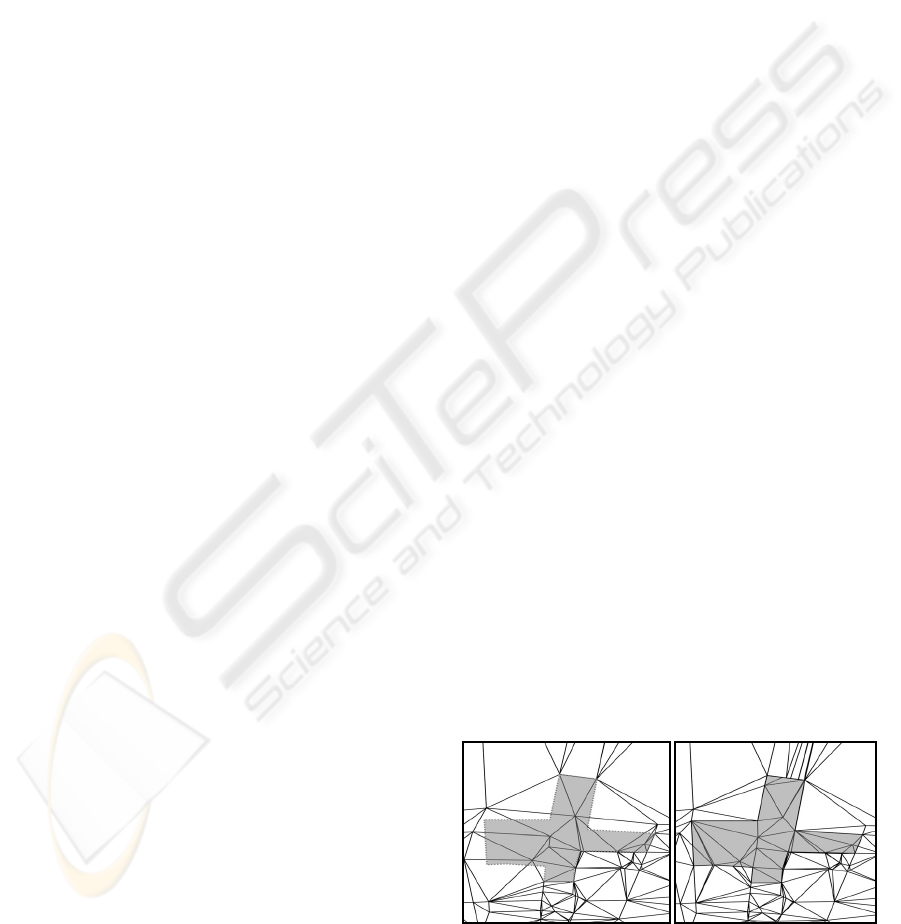
Figure 1: Polygon integration. Comparison of the
situations before (left) and after (right) the mesh
operations. The area becomes visible when different
colours are applied to the triangles.
WEBIST 2007 - International Conference on Web Information Systems and Technologies
200
When the mesh is encoded into the target
transmission format, a style (e.g. a layer colour) can
be applied to these areas which thus become visible.
Figure 1 shows the comparison of the situations
before and after all integration operations for one
polygon. The edges of the mesh which lie exactly on
the polygon border are marked as constrained in
order to avoid the destruction of the area by
subsequent mesh operations.
It should be noted that in this context
“constrained” does not mean that the edge must not
be altered at all. It means that the line shape must be
preserved. Nodes may still be inserted directly on
the constrained edge, splitting it into two and
changing the topology. This case occurs regularly,
when geometries of different layers lie next to each
other, for instance at the transition between different
biotopes, at the border between land and water and
many other cases.
Geometries of different layers may be
overlapping. In this case the last layer will take the
ownership of the triangles beneath. Integrating
several layers in a specific order will look like
painting them on top of each other in a desktop GIS
program.
5 MESH OPERATIONS
In order to achieve the result as displayed above, we
need to focus on the polygon borders. All vertices
can be easily integrated into the mesh, but the
connection between them by edges must be treated
more carefully, since direct lines might lead to
distortions.
The algorithm handles all layer polygons after
each other. The first step is to integrate all vertices
of the outer and inner polygon boundaries into the
triangulated irregular network (TIN) of the terrain.
For each vertex v we find the triangle under v.x / v.y
and compute the height h value h. The new node
n(v.x, v.y, h) is inserted into the TIN and the
triangulation is adjusted (Figure 2). All these
vertices are now part of the TIN as nodes (called
Constrained Nodes here).
For all search operations on the TIN it is very
important to work with an effective spatial index,
otherwise huge overhead computations would slow
down the process. We use our own Quadtree
implementation optimized for triangle meshes.
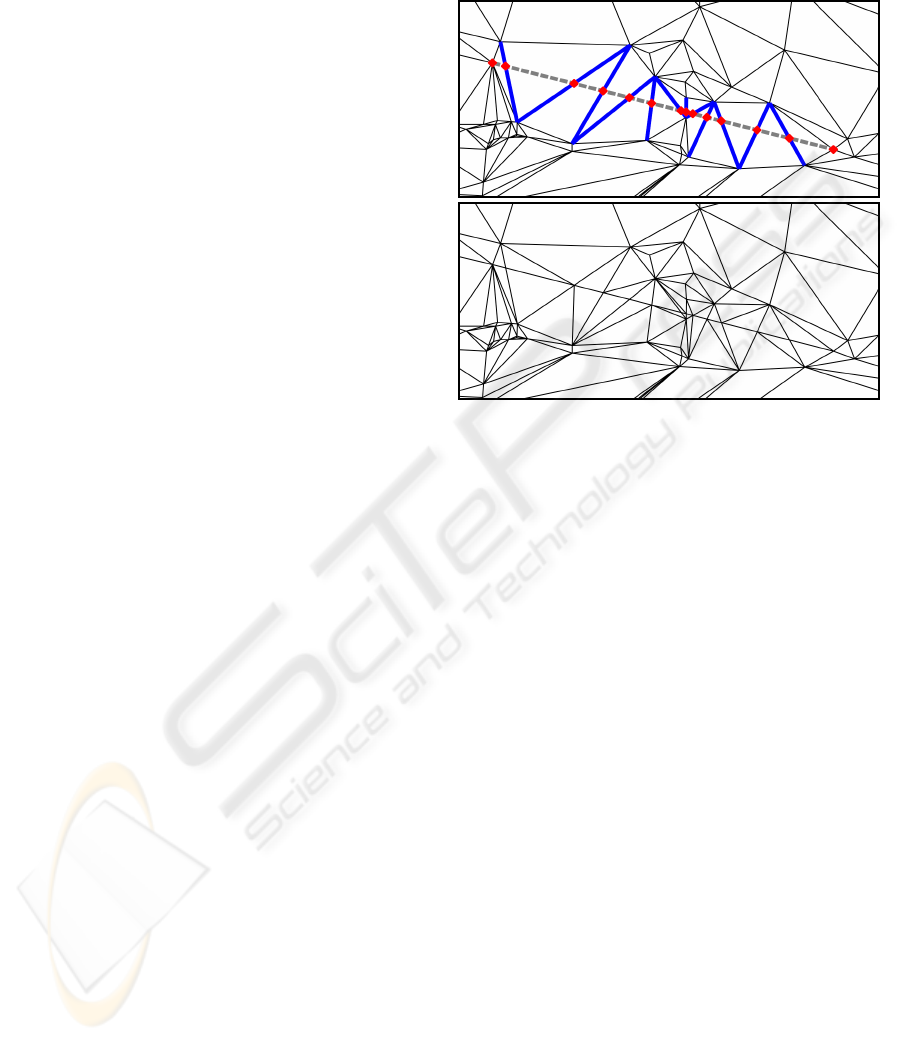
The next step is to connect all Constrained
Nodes by edges. The general approach is to remove
all triangles that lie between the two Constrained
Nodes of a segment and connect them directly with a
single edge. The holes on either side of the edge are
triangulated afterwards. Although the resulting mesh
would seem to be correct from above, it would mean
to create a ridge or a trench in the surface.
Figure 2: Connecting two nodes by a string of constrained
edges. Situation before insertion (top) with the new
segment as dashed line and the involved original edges
and new nodes in bold style. Situation afterwards (bottom)
with the new segment represented by constrained edges.
Therefore, we need to find the intersection points
of the segment and existing TIN edges and compute
the correct height over the edges (Figure 2). On each
intersection point we perform a node on edge
insertion operation. This deletes the edge and the
adjacent triangles and produces 4 new edges and 4
new triangles. The new nodes can be inserted in a
random order. In fact, the order is given by the
spatial index which is used to find the triangles
beneath the segment and can hardly be predicted.
Now we need to find the new edges under the
segment and mark them as constrained edges,
because their shape should be preserved and not
modified by subsequent operations. In order to avoid
a relatively costly search on the spatial index, we
start with the first Constrained Node and look for
connected edges in the direction of the segment.
This is a topological function and is performed very
quickly. The loop is finished when the second
Polynode is reached.
The last step is to identify all triangles within the
polygon and mark them as owned by the layer which
is currently processed. For this we use the quadtree
again which performs a simple search by the triangle
centre points. The following pseudo-code shows the
complete loop for one layer.
VECTOR BASED MAPPING OF POLYGONS ON IRREGULAR TERRAIN MESHES FOR WEB 3D MAP SERVICES
201
for each polygon p in layer
for each vertex v in p
calculate height h over tin at v
insert new node(v.x,v.y,h) into tin
end
for each segment s in p
n0 = start node of s
n1 = end node of s
if n0 and n1 are connected by edge e
mark e as constraint
else
find intersection points I of s with
edges of the tin
for each p in I
calculate height h over edge e
insert new node(p.x,p.y,h) on e
end
n = n0
while n!= n1
find edge e lying in direction of s
mark e as constraint
n = opposite of n node on e
end
end
find all triangles T of tin within p
for each t in T
mark t belonging to layer
end
end
6 GEOMETRY EXTRACTION
Before the finished vector map is transmitted to the
web client, the TIN topology must be broken down
into an indexed triangle array or triangle strip array.
Most formats support a mesh colouring by triangle
so that we can distinguish the integrated areas. The
other possibility is to put all triangles that are owned
by one layer into a separate geometry. Thus we get
one geometry per layer (Figure 3). The advantage is
that we can apply a different style to each layer. A
style can be a simple colour, material, or texture.
Especially generic textures for the natural
environment like grass or crop areas can improve the
visual quality of landscape models enormously, also
for map-like non-photorealistic visualizations.
Additionally we can better influence the reflectivity
for different materials. For instance water surfaces
should be rendered using higher shininess values
than for wood.
7 VECTOR MAP VS. TEXTURE
MAPS
One of our main goals was to reduce the file size of
3D maps as much as possible since they need to be
transmitted to Web Map clients within a low
bandwidth network. In this chapter we compare the
file sizes of vector maps and textured maps with the
same content. The map area has an extent of 2x2 km
and contains layers for water, wood, parks, and
streets. The original DEM consists of 14504
triangles. After the integration of all layers we get
39208 triangles; that is an increase of 170%.
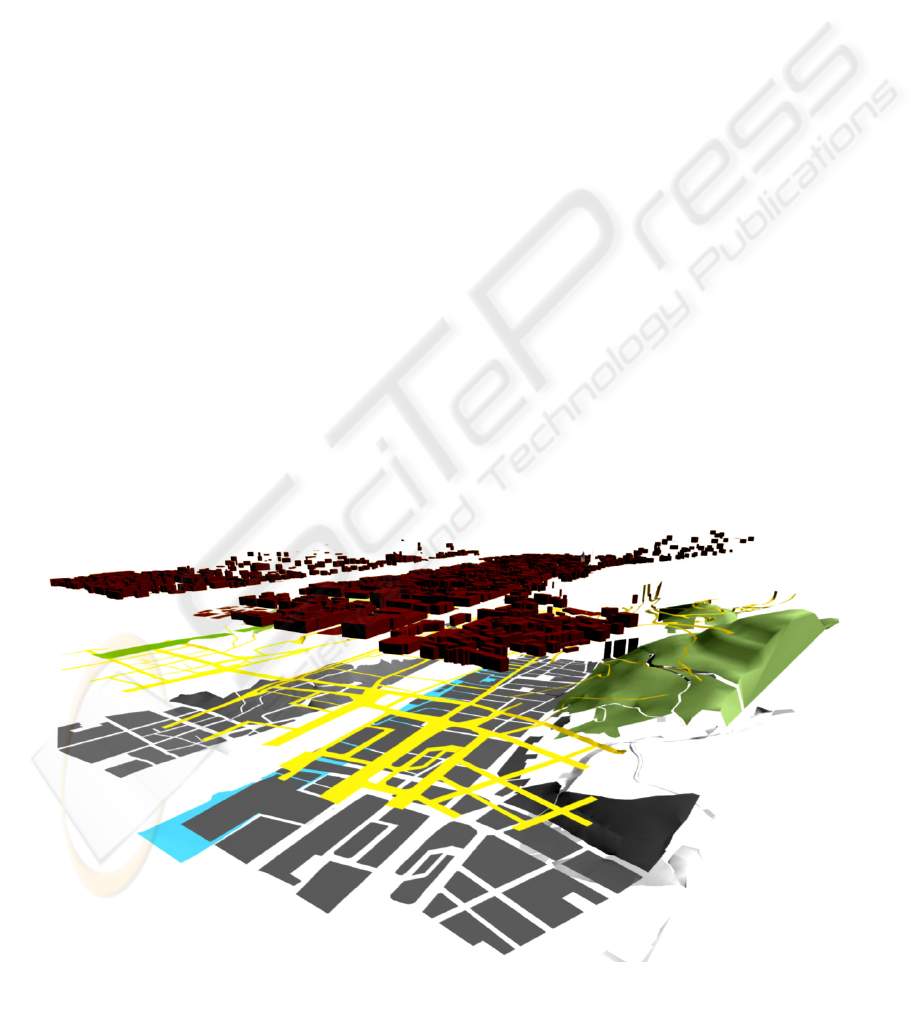
Figure 3: Terrain areas are separated into geometries representing the layers. To each layer geometry a different style can be
applied. Buildings are placed on top of the terrain.
WEBIST 2007 - International Conference on Web Information Systems and Technologies
202
This value depends strongly on the relation
between the LOD of the digitized areas and the LOD
of the terrain. For data sets consisting of larger areas
like geological maps, it is much lower.
We found that compressed VRML encoding is
the most effective one compared to other
compressed ASCII and binary encodings like X3D,
3ds, Viewpoint and others. After encoding the vector
map into VRML and performing a standard ZIP
compression the resulting file is as small as 414 KB
(see Figure 4c).
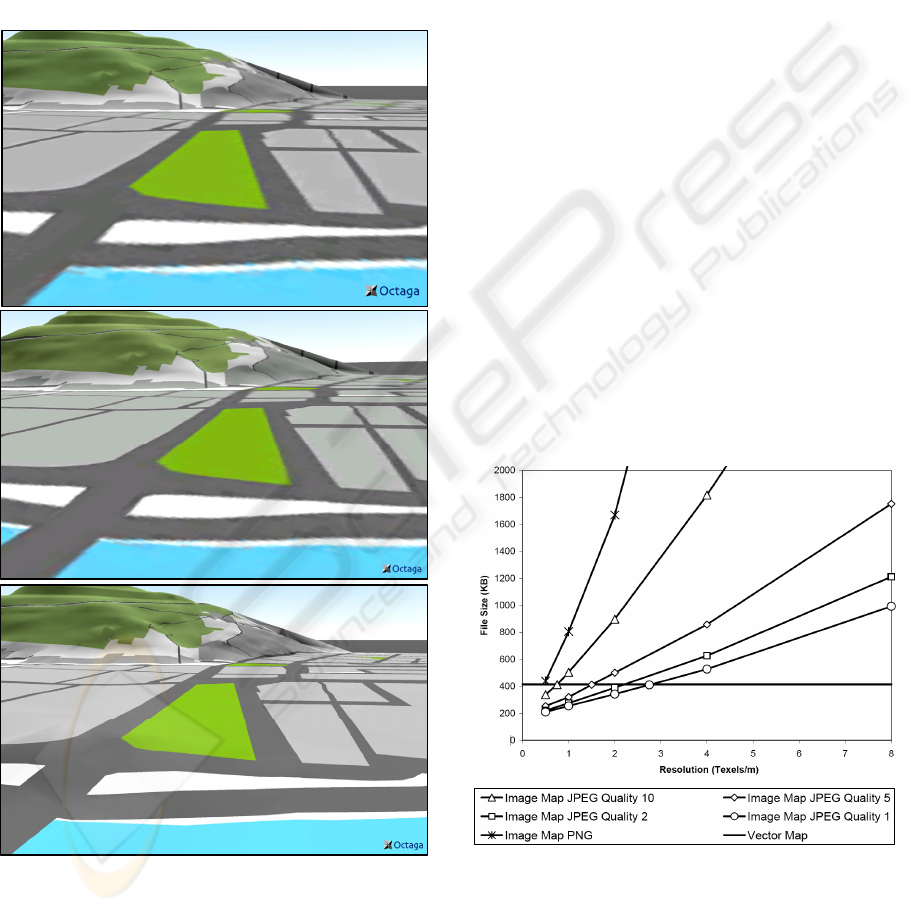
Figure 4: Comparison of texture mapping and geometry
based mapping, a) texture map with low resolution, low
JPEG compression, b) texture map with high resolution,
high JPEG compression, c) vector map with integrated
areas.
Additionally to the vector map we produced
terrain textures by loading the GIS layers into the
commercial GIS package ArcMap and exporting the
display as TIFF raster image with maximum
resolution. The TIFF was post processed by standard
imaging software in order to crop the image to the
correct map extent and to create JPEG and PNG
textures of various resolutions and JPEG
compression ratios. Texture coordinates were
calculated by projecting the images from above and
added to the scene. Although much more
sophisticated texturing schemes are feasible
including dynamic texture trees and multi-texturing,
comparing to this simple approach is still valid if we
consider only a small region, which must be sooner
or later rendered everywhere at the highest available
resolution if the avatar is exploring the whole scene.
Figure 4 shows a comparison of two different
texture maps and the vector map loaded in a
standard web browser plug-in. The textures have
different resolutions and JPEG compression ratios.
The term Texel refers to the pixels of the texture
image. The compression ratio is a compound value
based on the entries in the Huffman encoding table,
ranging from 0 (worst quality) to 12 (best quality).
a) Resolution 1,33 m per texel, JPEG com-
pression 10, file size 413 KB.
b) Resolution 0,5 m per texel, JPEG com-
pression 02, file size 390 KB.
c) Vector map, file size 414 KB.
d)
Figure 5: File sizes of texture maps in relation to image
resolution and quality compared to the equivalent vector
map.
Figure 5 shows how these parameters influence
the texture file size. The mentioned file sizes refer to
the combined size of compressed VRML and JPEG
files. The JPEG textures have also been ZIP
a
a
a
)
)
)
b
b
b
)
)
)
c
c
c
)
)
)
VECTOR BASED MAPPING OF POLYGONS ON IRREGULAR TERRAIN MESHES FOR WEB 3D MAP SERVICES
203
compressed. This is usually not done for 3D web
applications, since JPEG is very effective for most
images. However, in the case of rendered vector
graphics the file size could be reduced to 30% - 65%
of the original JPEG file, due to the monotonous
image structure. As can be seen, the 3 scenes have
about the same file size. PNG as an encoding with
lossless compression is in general better suited for
GIS data, but yields unacceptable amounts of data.
Figure 4 shows that higher resolutions should be
preferred when trading off between resolution and
image quality. However, only the vector map
(Figure 4 c) allows rendering crisp edges.
8 CONCLUSIONS AND
OUTLOOK
We showed how to effectively combine 2,5D terrain
models and 2D GIS data - especially polygonal data
– by using mesh integration operations. We can
achieve superior visual quality for representing areas
like forests, streets, water, geological strata, and
others on terrain models. On the downside, the
proposed method involves some additional
computations that naturally increase the response
time. In our current implementation and for the
example above, the polygon integration takes 10
times longer than the initial terrain triangulation. So
this should be done in a pre-processing step if
possible.
Another important aspect is how to apply mesh
reduction algorithms on this kind of meshes for
deriving lower LODs or producing hierarchical data
structures for continuous LOD streaming
(progressive meshes, e.g. Hoppe 1998). Of course,
the interior constrained edges should be preserved as
long as possible so that the map appearance is not
destroyed by edge collapse or vertex removal
operations too early. Basically, the error metric
needs to be adapted so that alterations of interior
edges are charged with a penalty factor. Schroeder
1997 shows how to classify vertices and edges and
how to adjust the quadratic error metric.
The file sizes of vector maps can be further
reduced with mesh compression techniques.
Isenburg and Snoeyink 2002 report a reduction of
about 50% for gzipped VRML files using an ASCII
based encoding of mesh compression Higher
compression ratios can be achieved with binary
encoders that produce optimized bit streams, for
Figure 6: Screenshot of the final Web 3D Map client. The software runs as Java Webstart application and includes a
custom Java3D viewer. Parameters for the OGC GetScene request can be set on the left panel, which include layers, spatial
extent, coordinate system, POI, POC and others. Data courtesy of Land Surveying Office City of Heidelberg.
WEBIST 2007 - International Conference on Web Information Systems and Technologies
204

instance Delphi (Coors and Rossignac 2004).
They use as few bits as possible for describing
the mesh connectivity. Another advantage is that
such compressed binary formats can be decoded
very quickly on the client side, whereas text parsers
tend to be very slow and need many resources (esp.
XML parsers). We are currently investigating
methods to transmit 3D geo data more effectively
since we also need to handle complex 3D city
models that include buildings, textured landmarks,
point objects, and many more. One way could be to
describe only the model structure (the scenegraph) in
an open format like X3D, and to use compressed
binary encoding for the geometry.
ACKNOWLEDGEMENTS
This work has been funded by the Klaus- Tschira-
Foundation (KTS) Heidelberg within the project
SDI-3D - www.heidelberg-3d.de. We thank the
Land Surveying Office of Heidelberg for supporting
us with spatial data.
REFERENCES
Agrawal, A., Radhakrishna, M, Joshi, R.C. 2006.
Geometry-based Mapping and Rendering of Vector
Data over LOD Phototextured 3D Terrain Models.
WSCG 2006 - The 14
th
International Conference in
Central Europe on Computer Graphics, Visualization
and Computer Vision, Jan. 30 – Feb. 3, 2006, Plzen -
Bory, Czech Republic.
Coors, V., Rossignac, J. 2004. Delphi: geometry-based
connectivity prediction in triangle mesh compression.
In The Visual Computer, International Journal of
Computer Graphics, Vol. 20, Number 8-9, 2004, pp.
507–520.
Haeberling, C. 1999. Symbolization in Topographic 3D
Maps: Conceptual Aspects for User-Oriented Design.
In Proceedings of 19
th
International Cartographic
Conference ICA ‘99, Ottawa, Canada, pp. 1037-1044.
Hoppe, H. 1998. Smooth view-dependent level-of-detail
control and its application to terrain rendering. In
IEEE Visualization, October 1998, pp. 35-42.
Isenburg, M., Snoeyink, J. 2002. Coding Polygon Meshes
as Compressable ASCII. In Proceedings of Web3D
Symposium'02, Feb. 2002, Tampe, AZ, pp. 1-10.
Kersting, O., Döllner, J. 2002. Interactive 3D
Visualization of Vector Data in GIS. In Proceedings of
the 10th ACM International Symposium on Advances
in Geographic Information Systems - ACMGIS, Nov.
2002, Washington D.C., pp. 107-112.
Kolbe, T.H., Gröger, G., Plümer, L. 2005. CityGML –
Interoperable Access to 3D City Models. In
Proceedings of the Int. Symposium on Geo-
information for Disaster Management. Mar. 21-23,
2005, Delft, The Netherlands.
Lenk, U., 2001, Strategies for integrating height
information and 2D GIS data. In Joint OEEPE/ISPRS
workshop: From 2D to 3D, establishment and
maintenance of national core spatial databases,
October 2001, Hannover, Germany.
Lindstrom, P., Pascucci, V. 2002. Terrain Simplification
Simplified: A General Framework for View-
Dependent Out-of-Core Visualization. In IEEE
Transactions on Visualization and Computer Graphics
Vol. 8 , Issue 3 (July 2002), pp. 239-254.
Open Geospatial Consortium Inc. (OGC) 2005. Web 3D
Service. OGC Discussion Paper, Ref. No. OGC 05-
019.
Schilling, A., Zipf, A. 2002. Generation of VRML City
Models for Focus Based Tour Animations -
Integration, Modeling and Presentation of
Heterogeneous Geo-Data Sources. In Web3D
Conference, 9-12.03.2003, Saint Malo, France.
Schneider, M., Guthe, M., Klein, R. 2005. Real-time
Rendering of Complex Vector Data on 3D Terrain
Models. In Proceedings of the 11
th
International
Conference on Virtual Systems and Multimedia –
VSMM, Oct. 3-7, 2005, Ghent, Belgium, pp. 573-582.
Schroeder, W.J. 1997. A Topology Modifying Progressive
Decimation Algorithm. In IEEE Proceedings
Visualization '97, pp. 205-21.
Stoter, J.E. 2004. 3D Cadastre. PhD thesis Delft
University of Technology. In: Netherlands Geodetic
Commission NCG : Publications on Geodesy : New
Series, 57. 327 p. ISBN 90-6132-286-3.
Wartell, Z., Kang, E., Wasilewski, T., Ribarsky, W.,
Faust, N. 2003. Rendering Vector Data over Global,
Multi-resolution 3D Terrain. In Proceedings of Joint
EUROGRAPHICS – IEEE TCV Symposium on
Visualization, May 26-28, 2003, Grenoble, France,
pp. 213-222.
Wynn, C. 2001. Using P-Buffers for Off-Screen
Rendering in OpenGL. NVIDIA Corp. white paper.
VECTOR BASED MAPPING OF POLYGONS ON IRREGULAR TERRAIN MESHES FOR WEB 3D MAP SERVICES
205
