
HARNESSING THE WEB TECHNOLOGY TO ENRICH
VISUALLY CHALLENGED USERS NAVIGATION
Hulya Francis, Madjid Merabti
School of Computing and Mathematical Sciences, Liverpool John Moores University, James Parsons Building
Byrom Street, Liverpool, UK
A. Taleb Bendiab
School of Computing and Mathematical Sciences, Liverpool John Moores University, James Parsons Building
Byrom Street, Liverpool, UK
Keywords: Navigation, GIS, visually challenged users, web technology, tactile, auditory, olfactory senses.
Abstract: Navigating urban streets without sight is fraught with difficulty and is often dangerous. Visually challenged
people rely on ancillary equipment such as a white cane to probe the immediate area in front of them as well
as developing other pre-existing personal physiological senses such as tactile, auditory, and olfactory
senses, to train themselves to walk along pavements. Conventional navigation systems based on geo-maps
alone are of little use to a visually challenged pedestrian. Hence, there is a need to develop a navigation
client-server system capable of providing information appropriate for a visually challenged pedestrian to use
to navigate urban pavements. This paper describes a navigation system that includes an enriched
information model and a technology to deliver such information in an easy-to-use, accessible fashion. The
paper introduces the technical challenge to the creation of a digital database for the navigation server that
stores appropriate data. A prototyped digital navigation model of Hoylake Town Centre, UK has been used
to test and validate the proposed model. This paper describes the role and function, and outlines the
architecture for the Web-based mobile computing location-based services navigation support systems.
1 INTRODUCTION
A visually challenged person will need training
before being able to walk unaided, along a
pavement. Pavements are cluttered with street
furniture, vehicles sometimes parked on pavements,
repairs and other obstructions. Obstructions are
usually short-term and dynamic. As such,
obstructions do not remain in place for any length of
time and the pattern of obstruction changes
frequently. Conventional navigation systems are
based on maps that model the primary features of an
area. The features of an area included in
conventional maps are based on tangible objects that
can be seen in the area e.g. roads, pavements, street
furniture, buildings etc. Conventional navigation
systems provide this information to support
navigation such as that found in the ubiquitous
NavSat systems. This information is of little use to a
visually challenged pedestrian. A major challenge is
the creation of a digital database for the navigation
server that stores appropriate data. New digital
models have been made of a case study area:
Hoylake Town Centre, near Liverpool, United
Kingdom. The digital database has been populated
with micro tactile, auditory and olfactory data that
visually challenged people will find useful. The
digital database has been designed to provide
information to make it easy for visually challenged
pedestrians to navigate urban streets. Digital
soundscapes for example provide information about
the type and extent of sounds along the route; tactile
maps contain information about the type and
position of tactile surfaces or permanent wind
draughts along the route; and olfactory maps provide
information about the type and extent of smells
along the route. Such data is used to enrich
conventional data to assist visually challenged
pedestrians find their way safely.
No conventional navigation systems provide
189
Francis H., Merabti M. and Taleb Bendiab A. (2007).
HARNESSING THE WEB TECHNOLOGY TO ENRICH VISUALLY CHALLENGED USERS NAVIGATION.
In Proceedings of the Third International Conference on Web Information Systems and Technologies - Internet Technology, pages 189-196
DOI: 10.5220/0001272401890196
Copyright
c
SciTePress
information about obstructions in real time. The
navigation system described here provides an
opportunity for a user to record centrally information
about current obstructions. Such information will
become immediately available to others pedestrians
in the vicinity. There is a need to ensure the delivery
of information is appropriate to the user’s particular
needs. Recent advances in multimodal interface
design offers a real way forward towards achieving
this goal. Mobile location-based services’ systems
offer potential for delivering information in an
unobtrusive, accessible fashion. A multimodal
speech- and/or button driven interface on a thin
client such as a PDA will help ensure wide
acceptability of the system amongst visually
challenged users. The navigation server will detect
the client’s position via an on-board GPS and will
deliver user-specific, location-specific information
in real time to help guide a pedestrian safely along
an urban pavement.
Conventional information models are not
appropriate for supporting navigation in visually
challenged circumstances. Francis, H (1997)
identified a non-traditional data-stream used by
visually challenged people to navigate footpath
routes in Lancaster University. Later research by
Francis (Royal National Institute for the Blind,
1997) identified similar findings in research on blind
pedestrians. Similar research carried out amongst
visually challenged pedestrians in Liverpool
(Francis, 2003-2005) noted the inability of
conventional information models to supply
unconventional data.
The conventional information model relies on
sight being present. Recent technological advances
to help overcome problems with navigation for
people without sight have been based primarily on
developing technology based on Geographic
Information System (GIS) and Global Positioning
System (GPS). Typical attempts have included audio
systems that speak turn-by-turn instructions and,
systems that make use of obstruction warning
devices that employs infra-red technology. These
approaches are limited by two fundamental
shortcomings: (a) the size and complexity of the
technology they use and (b) the fact that the
information model they employ is derived for use by
sighted people.
2 DATA MODEL AND DESIGN
Conventional map data do not provide the data
normally used for navigation by visually challenged
Authentification
Manage users
update services
Administrator
<<include>>
Create new acc ount
View user account
<<extend>> <<extend>>
From an address
From coordinates
Location Service
<<extend>>
MapPath Servi ce
<<include>>
Route service
<<include>>
Point of interest
<<include>>
Event of interest
<<include>>
Tracking Service
Obstacle Service
Compass Service
Client
<<extend>>
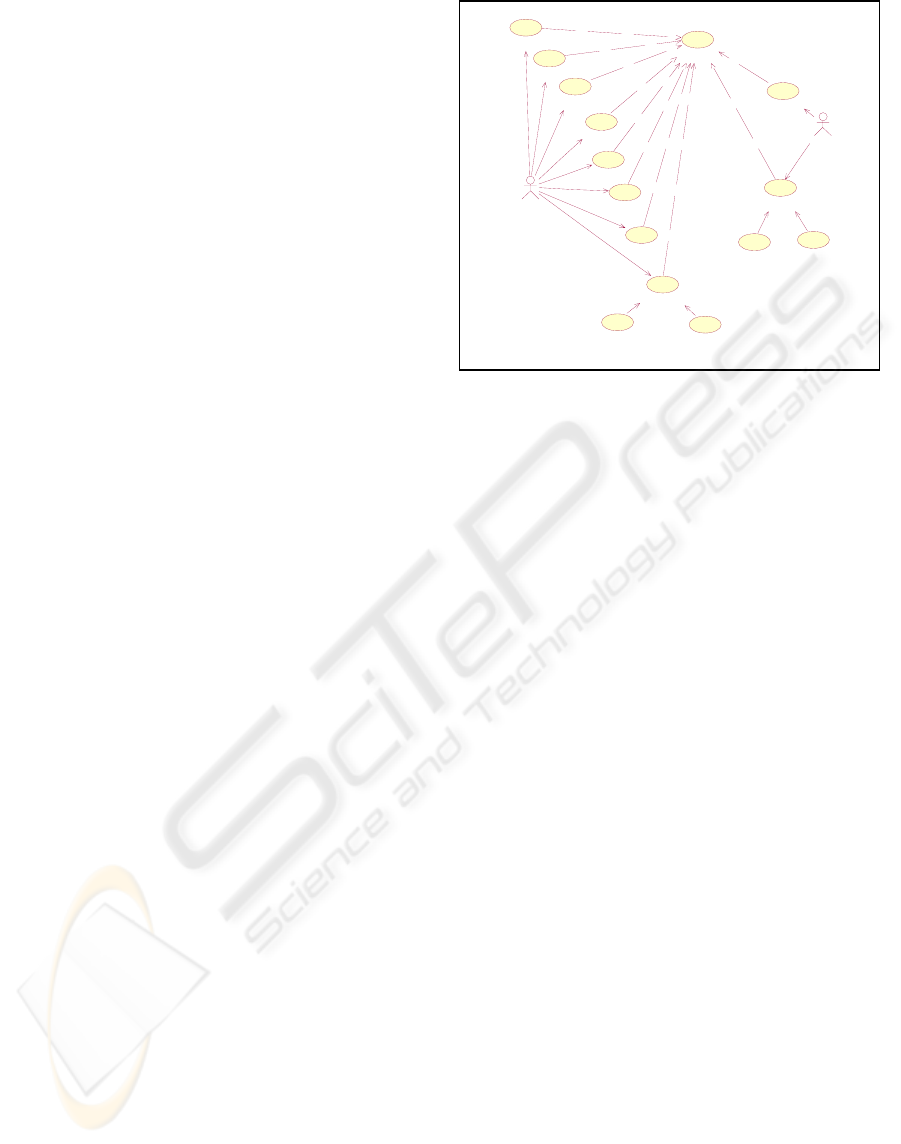
Figure 1: Application Use Case Diagram.
users. The success of the proposed navigation
system hardware is dependent upon the right
information being available. New digital maps that
include the data required for navigation in visually
challenged circumstances will need to be derived.
Using advanced Global Position System technology,
digital maps of the micro environment are being
assembled for the case study area. The digital maps
will include data about significant sounds, tactile,
olfactory features in the environment suitable for
positioning. A range of digital maps will be prepared
for inclusion in the navigation server including
soundscapes, tactile positions, olfactory extents and
auditory prompts.
The navigation system provides information to a
user in a mobile location-based services
environment. A user carrying a GPS-enabled PDA
client will be able to query the navigation system
about routes and services along a given route. The
navigation system will provide information in real-
time via a multimodal speech-driven interface.
Augmented navigation support in visually
challenged circumstances will require both the
inclusion of unconventional data as well as a new
approach to information delivery. With this in mind
it has been necessary to design a new generic
navigation system to address the navigation needs of
visually challenged people. The following Unified
Modelling Language constructs provides an outline
of the proposed design.
The use case diagram in Figure 1 shows all the
services offered to a user, who can be either a simple
client or an administrator.
WEBIST 2007 - International Conference on Web Information Systems and Technologies
190
MapService
location
destination
set Logo()
generateMap()
display MapP ath()
display MapP oint ()
displayStops()
Locat ionService
getLoc ation()
getCoordinate()
getAddress()
RouteService
dctFile
getPath()
getDirection()
creat eNetwork()
POIServic e
EOIService
CompassService
direction
getAngl e()
ObstacleService
segment
getObs tacle()
Session
SessionID
UserID
Last Proces s
UpdateProcess ()
Device
deviceID
ref
getS creenSiz e()
Tracking
userName
refreshRoute()
changeOrigin()
User
userID
userName
pass word
group
logon()
0..*
0..*
0..*
0..*
uses
1..*
0..1
1..*
0..1
UserRes ult
userID
generateUserResult()
Request
service
device
output
createNew()
request Service()
0..*1 0..*1
express
GISservice
name
locationService
csf
GDOServer
output Type
setMapServer()
1
1
1
1
generates
1..*0..1 1..*0..1
request
Services manager
DBlocation
getServiceLocation()
changeSe rvi ceLoc ation()
0..*
1
0..*
1
manag es
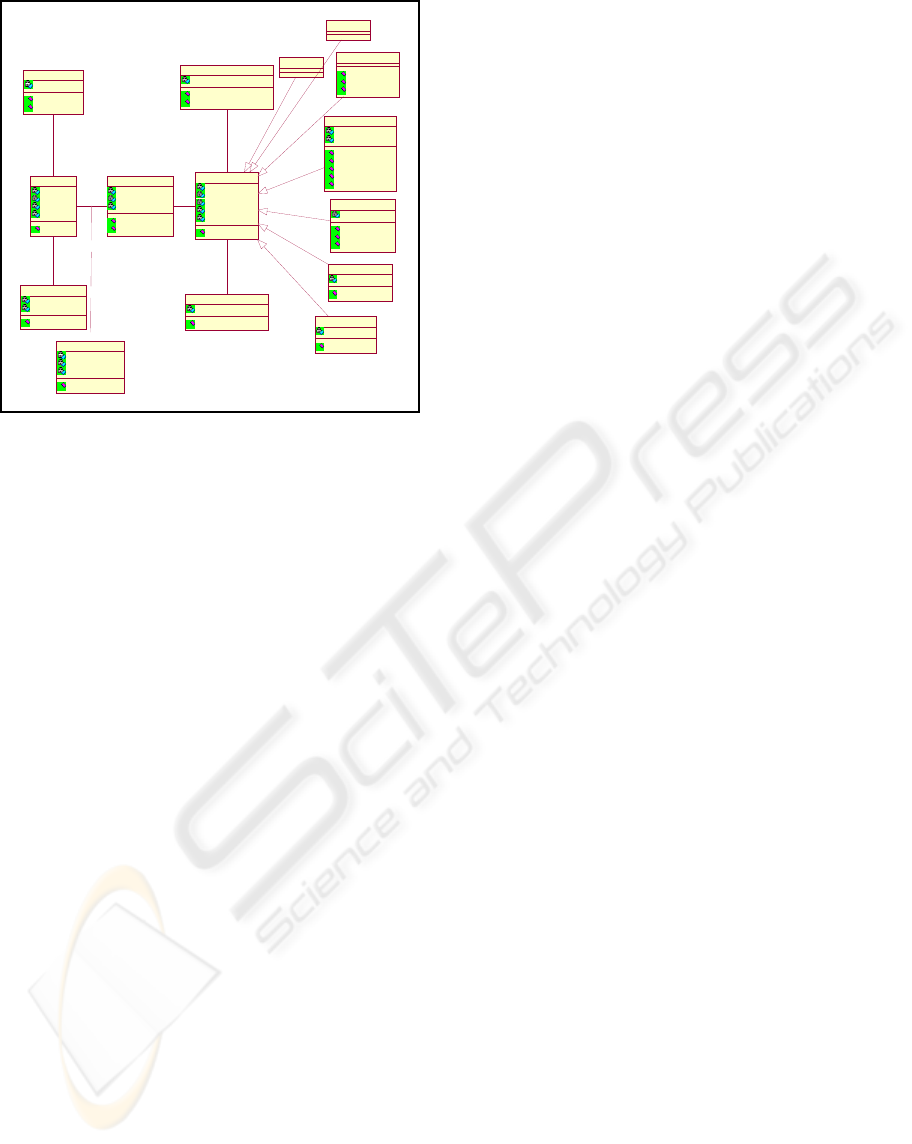
Figure 2: Class Diagram of the Application.
Figure 2 provides an overview of the available
services in the system. The location service can be
called by providing either an address (street name,
street number or postcode) or coordinates. If called
by providing an address, the service will display a
map with the address highlighted or retrieve its
coordinates. These coordinates can be then used by
another service or another application in the case of
a web service configuration. If called by providing
coordinates, the location service will assign the
nearest street to this point and return either the
corresponding address on a text format or a map
with the address highlighted.
The MapPath service retrieves a map displaying
the shortest path between 2 points. This service takes
an address as origin or integrates coordinates
provided by the GPS.
The Route service also generates the shortest
path between 2 points but will retrieve route
direction instead of a map.
These three services will be implemented in the
prototype. The following services will be
implemented in the future:
The point of interest (POI) service shows,
for instance, restaurants, bus stops or
museums on a map.
The event of interest (EOI) service shows on
a map the location of a specific event. The
system could tell if a cultural event is taking
place somewhere in the city and show the
location on a map. If the user is an impaired
person, the system will provide route
instructions.
The proximity service compares an origin to
multiple destinations and determines which of
the destinations is the closest to the origin.
The system could then show the nearest
restaurant from the user’s location for
instance.
The allocation area service display on a map
the area that could be traversed during a
certain time from an origin. This service can
also display the area locate at a certain
distance of an origin.
The proximity and allocation area analysis are
two analyses enable by the GIS engine. The
following services are more specific to the
application developed for the blind users:
The Compass Service handles the user’s
bearing. Before sending a route instruction to
a blind user, we need to know the initial
direction he is facing. To do so, a compass is
embedded in the device to determine the
direction. Knowing their intended route, we
can generate a direction to follow and
compare it to the user’s one. The system will
then give instructions to correct his bearing.
The innovative Obstacle Service checks if
there is any obstacle on the path the user is
taking. If so, instructions to avoid the obstacle
are provided to the user.
The Tracking Service maintains knowledge
of the current location. This service enables to
refresh the different analysis and adapted the
response to the user’s pace. This is a major
service, which will enable to match the route
instructions to the user’s location. In the case
of a sighted user, the system can send the full
set of instructions from the starting point to
the destination. The user will then follow them
at his pace. In the case of a blind user,
providing the full set of instructions on a
speech format is not acceptable. The system
has to follow the user’s pace and to give the
route instructions in accordance with the path
he is taking. This also entailed to
communicate the information regarding
potential obstacles at the right time.
The management area enables the creation of
new accounts and the management of the
existed ones. This area let the administrator
specify new location of a component if we are
in a distributed environment. The management
area won’t be integrated to the prototype for
the moment. This area has to be customised
for the client of the future application.
However, basic management services will be
HARNESSING THE WEB TECHNOLOGY TO ENRICH VISUALLY CHALLENGED USERS NAVIGATION
191
developed as an independent module. These
services include the management of users’
accounts.
2.1 The Class Diagram
The diagram in Figure 3 shows the relationships
between the components of the navigation system.
provide a
location address
select output:
A
cgm, Jpeg, text
Select device:
Desktop, Palm
provide
coordinates
select output:Acgm,
Jpeg, Text, Voice
Send request
Reset request
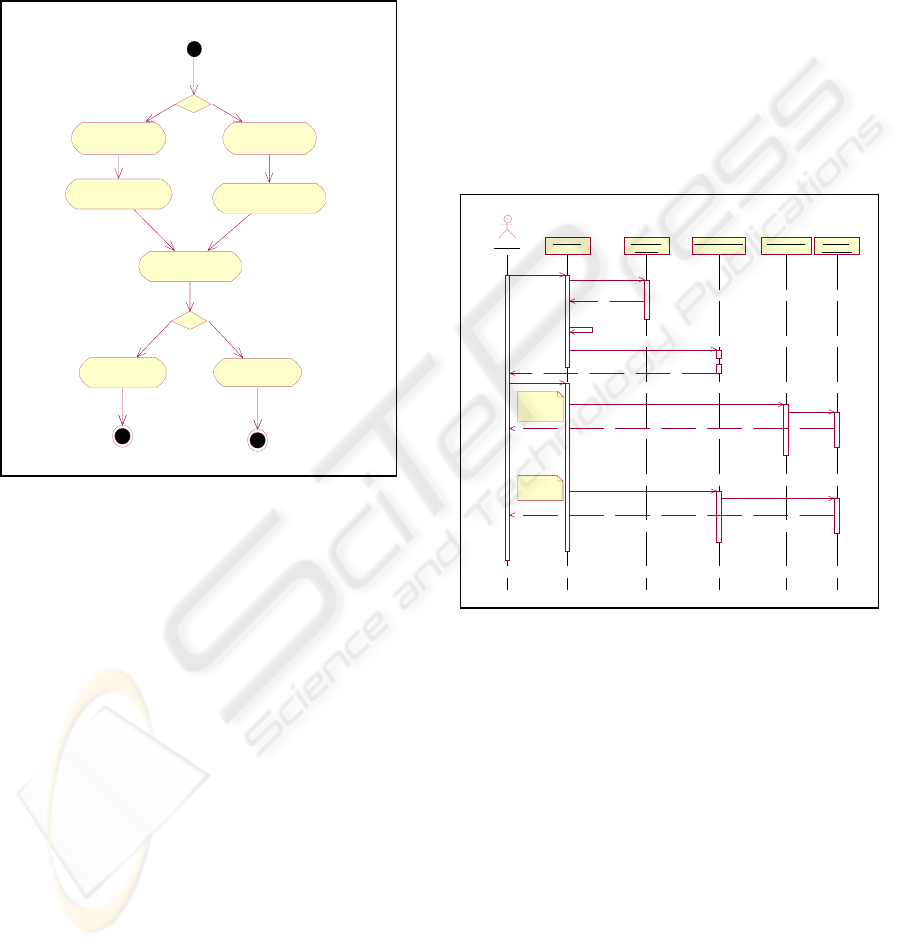
Figure 3: Activity Diagram of the Location Service.
The user interacts with the system through a
device. He or she expresses a request that is the
interface for the GIS services. Once the request
generated, it has got all the information to call the
required service. The services manager provides
information about the different services e.g. their
location. This will be very useful in a distributed
environment. Once the request is processed, a
response will be generated and send to the user in a
suitable format. This response enables session
tracking. If the connection breaks, the previous
result generated can be retrieved when the user logs
on again and saves him from building a new request.
2.2 Location Service
The activity diagram in Figure 3 shows the different
options offered within the location service.
For the moment the user’s got only two device
options: desktop or palm. The screen size of these
devices is hard-coded but the class exists and can
therefore be used to extend this choice. The final
client-side application will send the user’s device
profile to the server. The sequence diagram in Figure
5 represents the interactions between a user and the
components of the system when an address is
provided to the location service. Location Service
checks whether more than one address match the
given location and offers a list of addresses to select.
If the location is requested form coordinates, the
system will have to assign a street to the coordinates
given. This process involves the GeoMedia Network
component. A network is built over the street
feature. This network is made up of edges and
nodes. So that when a coordinates are assigned to a
street, it is first assigned to the closest edge of the
network and the system will then identify the
corresponding street.
A : Client
a R eques t : Services
manager
: Locat ionService : MapS ervice a result :
UserResult
RequestService(loc)
getS erviceLoc ation( )
creat eNew( )
getLoc at ion( )
suitable locat ions
If a Map is
request as
output
If coordinates
are request
as output
a location
displayMapPoint( id)
getCoordinate(id )
service location
generateUserResul t( )
Map
generateUserResult( )
coordinates
Figure 4: Sequence Diagram of the MapPath Service.
2.3 MapPath Service
Once the location of the origin and destination point
is defined, Route Service generates the shortest path.
The path is then sent to MapPath Service. The path
of the generated map is contained in a string and
sent to UserResult to build the result.
2.4 Route Service
The Route Service performs a shortest path analysis.
Route direction are then generated and sent back to
the request. The sequence diagram below shows the
interaction between the components involved for
this service.
WEBIST 2007 - International Conference on Web Information Systems and Technologies
192
After performing the shortest path analysis, the
system checks if there is any obstacle on the path. If
so the route instruction is customised.
A : Client
a Request : Services
manager
: RouteService : LocationService : MapS ervice a result :
UserRes ult
Request Service(map)
getS erviceLocat ion( )
createNew( )
get the location matc hing the
request
location
getRoute()
getCoordinat e( )
getLoc ation( )
location
location
coordinates
getPat h( )
path
displayMapPat h(path )
service locati on
generate userResult.xml
map
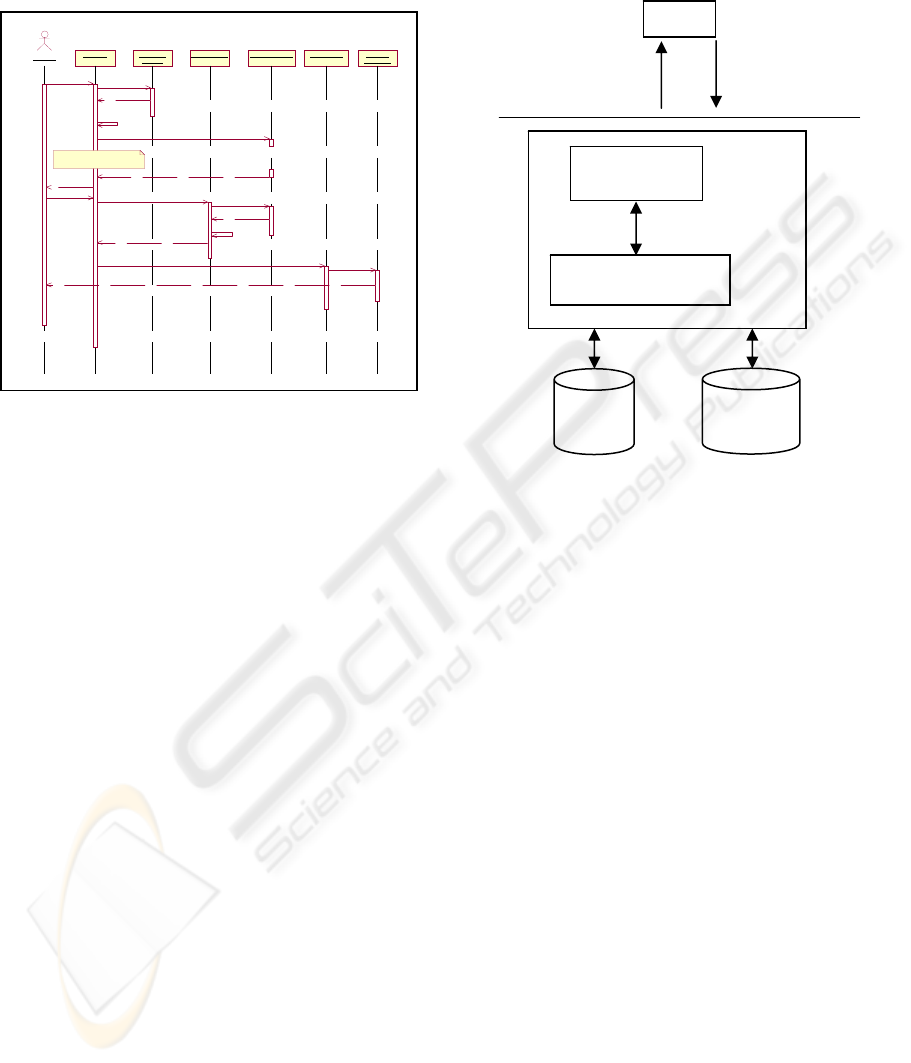
Figure 5: Sequence Diagram of the Route Service.
2.5 The Architecture and
Framework
GeoMedia’s architecture is based upon the
Microsoft’s Component Object Model (COM)
technologies, therefore it seems suitable to develop
the application using the Microsoft .Net Framework.
Moreover, the .Net Framework provides good
facilities to develop Web services. Indeed, the
system is intended to be designed as a Web service
in the future. The .Net framework support different
languages: VB, C# and C++. ASP.Net with Visual
basic seemed to be the most appropriate language to
develop the system in a minimum of time, as
Intergraph used VBScript in its programming
documentation.
Microsoft also provides several free
development tools for mobile and embedded
applications under their .NET framework, such as
the Microsoft Mobile Internet Toolkit (MMIT).
MMIT adopted Wireless Markup Languages and
compact HTML (cHTML), which can be applied for
mobile devices. After thought, this toolkit won’t be
used here, as we prefer the more generic XML and
Extensible Stylesheet Language Transformations
(XSLT) approach. Because the presentation code
and business logic of the application can be
separated, the system will be more flexible, more
efficient and more manageable. Indeed, the first
prototype will be web-based, the user connecting
himself to an URL, but the final system will be an
application on the handheld device that makes itself
the request to the server. The following schema
shows communications within the system.
Figure 6: Communications within the system.
Communications between client and server (Figure
6) are entirely made up of XML messages. XML is
an efficient communication way through the
wireless network. The application takes spatial
queries in XML format, answer the query and sends
the result back to the calling application by way of
XML.
XSLT handle transformations between XML and
HTML or WML. The application calling the service
will send the profile of the device used. The
response will be then translated in a suitable format
for this device.
2.6 The Speech Interface
The .NET Speech Platform provides a development
and deployment environment for speech-enabled
Web applications. The Microsoft .Net Speech SDK
is built around a newly emerging standard: Speech
Application Tags (SALT). SALT has been submitted
to the World Wide Web Consortium (W3C) for
adoption as a standard for telephony and multi-
modal applications, which incorporate speech-
enabled elements within a visual Web interface.
CLIENT
XML query
XML response
GIS
M
etadata
Server
ASP.Net Interface
(Generates XML)
Geoprocessing Object Library:
GeoMedia WebMap
HARNESSING THE WEB TECHNOLOGY TO ENRICH VISUALLY CHALLENGED USERS NAVIGATION
193
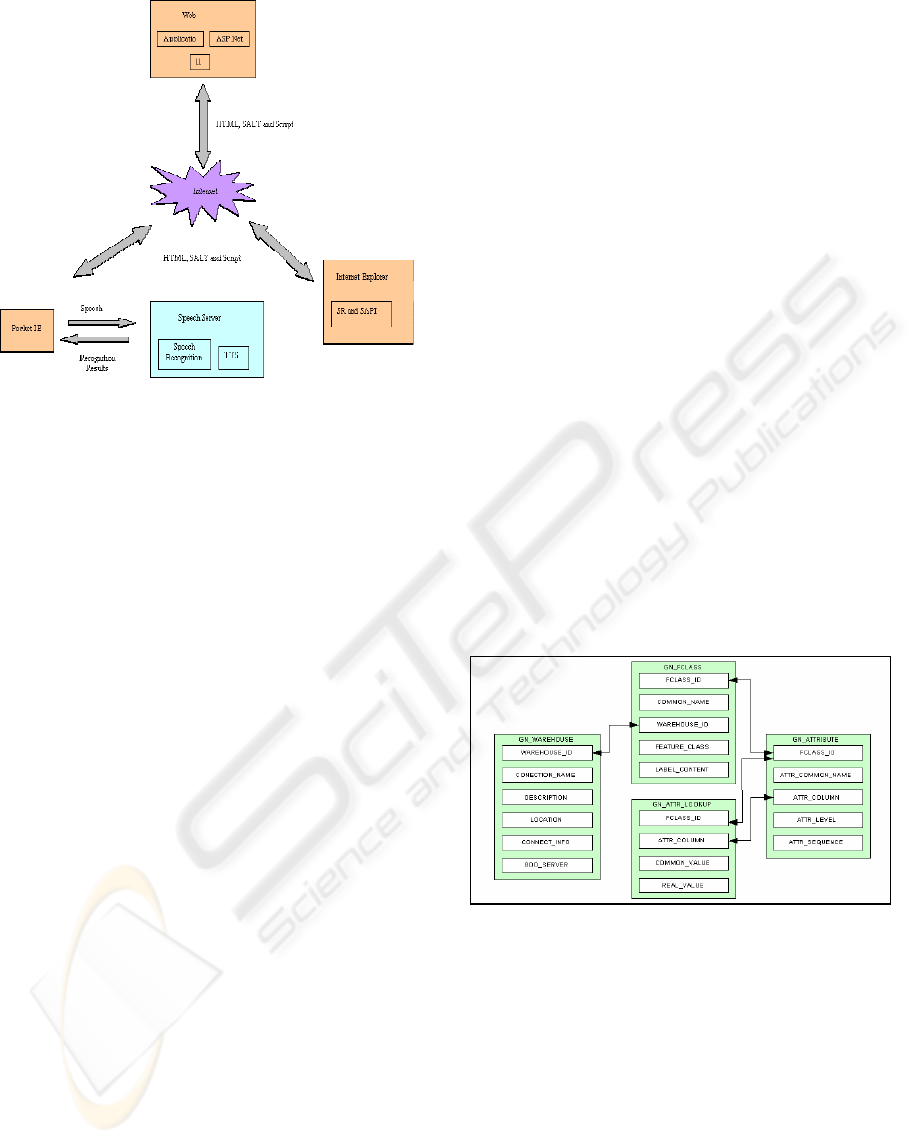
Figure 7: The speech interface.
Figure 7 provides the details of the Speech Interface
used in the system development. Speech Application
Language Tags (SALT) are a lightweight set of
extensions to existing markup languages, in
particular HTML and XHTML. It consists of a small
set of XML elements, with associated attributes and
DOM object properties, events and methods, which
apply a speech interface to web pages. SALT
enables multi-modal and telephony access to
information, applications and Web services from
PCs, telephones, tablet PCs and wireless personal
digital assistants (PDAs).
The SDK provides a suite of four development tools
for use within the Visual Studio .NET development
environment: the Grammar Editor, Prompt Editor,
ASP.NET Speech Control Editor, and the Speech
Debugging Console.
The Grammar Editor is a graphical grammar
file editor. Use the Grammar Editor to create
grammar files, which are then bound to a QA
or Command control. The Grammar Editor
also validates grammar files, verifying that the
files contain valid XML code, and that they
are compliant with the W3C Speech
Recognition Grammar Specification V. 1.0,
without building the entire application.
The Prompt Editor is a data entry and edit
tool for prompt databases. Use it to create a
prompt database containing recording scripts,
.wav files, and descriptive and tracking data
for each prompt. It includes the Prompt
Validate Tool, which checks prompt coverage,
and allows testing of extractions in sample
combinations. The Prompt Editor includes a
graphical Wave Editor to customize .wav
files. Use the Wave Editor to display the
wave-form, edit word boundaries, copy and
paste individual sound segments within and
across .wav files, and play the edited .wav
files.
As the application is based on an XML interface,
ASP.NET Speech Control Editor won’t be used.
The Speech Server provides text-to-speech (TTS)
and speech recognition resources for telephony and
PocketPC clients. The Speech Server receives
speech and returns recognition results, and receives
marked up text and returns speech.
In the first scenario, the client is Microsoft Internet
Explorer with the Microsoft Internet Explorer
Speech Add-in installed. The Speech Add-in
implements SALT functionality using a prompt
engine, text-to-speech (TTS) engine, and a speech
recognition (SR) engine. Applications are developed
with the .NET Speech SDK and posted on the Web
Server. The Web Server exchanges HTML, SALT,
and script with the Speech Add-in on the desktop.
Speech recognition occurs on the desktop. Multi-
modal applications with desktop clients can be
deployed using only the .NET Speech SDK.
In the second scenario, the client is pocket Internet
Explorer with a Speech Add-in. The Web Server
sends HTML, SALT, and Script to the Pocket PC.
Figure 8: Structure of the feature metadata.
The Pocket PC sends a compressed representation of
the audio and a pointer to the recognition grammar
to the Speech Server that performs recognition and
returns results to the PocketPC.
2.7 The Network
The wireless-based navigation information system
will be based on a WiFi (Wireless Fidelity) network.
A WiFi network is thought to be the best possible
enabling technology to provide a real-time, stable,
fast communication channel. The WiFi network will
WEBIST 2007 - International Conference on Web Information Systems and Technologies
194

offer the following advantages: It’s fast (11Mbps),
reliable, and it has a long range (1,000 ft in open
areas and 250ft in closed areas).
2.8 Metadata
Metadata are formal descriptions of data. They are
very useful to enable the process of search and
discovery over distributed archives. We also need
metadata to determine whether a dataset, once
discovered, will satisfy the user’s requirements. The
following diagram in Figure 8 shows the table
structure of the feature metadata.
The meta-database is used to define feature
classes that can be directly queried by the user
through the XML interface. For example, when the
user is looking for restaurants, the metadata enable
to identify the source warehouse where the feature
comes from, the table name and other attributes.
Indeed, the table name and source warehouse may
be unrelated to the feature name. This is actually the
case for the restaurants as they are references as
“Restaurants” in the GIS.
2.9 System Development
To be successfully driven by and deliver spoken
instructions and maps to a mobile device, based on
user requirements, in this case a hand held personal
digital assistant (PDA) device, equipped with
onboard GPS capability.
The delivered spoken instructions and maps
would provide navigation support based on a route
derived on the system server. The navigation support
would be automatically updated based on the current
position of the device, although no GIS software or
map data need be installed in the device itself.
The application will be designed to be “Web
Enabled” taking into account the .net environment.
If possible this may provide a way of using the
application on a suitable mobile phone, via the web.
It is anticipated that the software produced from
this research study could be used to provide mobile
location information, whenever, and wherever it is
required.
This project will attempt to address the following
problem areas that are associated with the delivery
of spoken instructions and map images to mobile
devices.
• Speed
o Spoken instructions and images
must be delivered quickly enough
between client and server and vice
versa. This may be difficult due to
limited bandwidth.
• Data Integrity
o Data will be delivered to devices
in small packets. These must be
successfully received, in order to
build a recognizable image.
• Speech and image Quality
o The speech and images received
must be meaningful to the user,
but this must take into account the
size/resolution of the display
screen.
• Relevant Content
o Data delivered must be relevant to
the user, as we are dealing with a
small screen size. This must be
taken into account before data is
delivered.
2.10 Design
The system design will be completed using UML
(Unified Modeling Language). This will produce a
series of diagrams from which objects that will be
required to build the system will be identified.
Pseudo code may also be created at this stage, which
will be used in the implementation of the system.
2.11 Implementation
The system will be implemented by following the
UML design produced at the design stage. The
system will be specifically implemented using
Microsoft .net and the C# programming language.
2.12 Testing
Two groups of visually challenged users have agreed
to test the system in Hoylake, near Liverpool. This is
however the final testing stage of the project testing
stage, making it ready for a final “sign off” as a
finished product. Testing will however be carried
out in collaboration with RNIB, on a constant basis
as part of the implementation stage, in order to
ensure that a complete, robust and useable piece of
software has been produced.
HARNESSING THE WEB TECHNOLOGY TO ENRICH VISUALLY CHALLENGED USERS NAVIGATION
195

3 CONCLUSION
Current information models do not contain the data
visually challenged users need for successful
navigation. Previous research recognises a need to
develop a new navigation system to serve the needs
of visually challenged users. To be successful, the
new navigation system must provide data that
visually challenged users normally find useful. Such
unconventional data includes tactile, olfactory and
auditory data. Contemporary navigation systems are
based on an information model that uses tangible
topographical features found in the micro-
environment. The navigation support system
described in this paper uses an enriched information
model that extends conventional data by
incorporating the unconventional data described
above. Such data has never before been provided by
a digital system. To achieve this, a major data
collection effort has been undertaken to develop a
new data base containing micro-data describing the
case study area. Digital maps of the area have been
developed for use on the navigation server.
Operating via the web will ensure easy access to
navigation support via a speech-driven multimodal
interface. The system will provide location-based
information to clients roaming freely in a wireless-
enabled urban area via HTTP. Geographic spatial
analyses will be carried out on a GeoMedia
professional GIS-based navigation server. Not all
visually challenged users have the same degree of
visual impairment. The system described here will
provide mechanisms for providing information
appropriate to each user’s requirements. Given that
urban streets are filled with a wide variety of people
and objects, the system provides opportunities for
pedestrian users to record obstructions and changing
topographical features. Information added to the
database will be immediately available to other users
in the vicinity. The system goes some considerable
way towards overcoming the shortcomings of
conventional navigation systems by providing
services and facilities that better match the needs of
visually challenged pedestrians in the urban
environment.
REFERENCES
Blenkhorn, P. and Evans, D.G., 1997. "A system for
enabling blind people to identify landmarks: the sound
buoy." IEEE Trans. on Rehab. Eng. 5, 3, 276-278.
Brabyn, J., Crandall, W., and Gerry, W., 1993. "Talking
signs: a remote signage solution for the blind, visually
impaired and reading disabled." Proc. 15th Annual
Int. Conf., IEEE Eng. in Medicine and Biology
Society, 1309-1310.
Francis, H., 1997 A Database Design for a GIS-based
Relational Database for Tactile Mapping: Case Study
Lancaster University Campus M.Sc. Dissertation,
Department of Systems, School of Management,
Lancaster University)
Fritz, S., Michel, R., Raab, A., and Strothotte, T., 1995.
"User interface design for a travel aid for blind
people." Workshop on Non-Visual Graphical User
Interfaces for Blind People, Software Ergonomie,
Darmstadt.
Gilden, D., 1997. "Moving from naive to knowledgeable
on the road to technology transfer." Technology and
Disability 7, 115-125.
McInerney, R., D'Allura, T., and Benn, T., 1995. "An
evaluation of talking signs: Lighthouse staff
utilization." Arlene R. Gordon Research Institute, The
Lighthouse Inc., New York.
Scadden, L.A., 1997. Technology and people with visual
impairments: a 1997 update. Technology and
Disability 6, 137-145.
Motluk A, Senses special: The art of seeing without sight,
New Scientist issue 2484, 29 January 2005,
Yoichi Takebayashi, Multimodal Anthropomorphic
Interface, IJCAI-97 Workshop on
Intelligent Multimodal Systems
Zelek John S. September 2005, Pages 1108-1112 Vision
2005 - Proceedings of the International Congress held
between 4 and 7 April 2005 in London, UK
WEBIST 2007 - International Conference on Web Information Systems and Technologies
196
