
Position Estimation on a Grid, Based on Infrared
Pattern Reception Features
N. Petrellis, N. Konofaos and G. Ph. Alexiou
Computer Engineering and Informatics Dept.
University of Patras, Greece.
Abstract. The location of the position of a moving target on a grid plane is
studied in this paper. The estimation method is based on encountering the
number of infrared patterns that arrive to the target as expected, unexpected or
out of order. Since the position of the target is not determined by an analog
signal intensity, no high precision sensors and measurements are required and
the coordinate estimation can be carried out by a pair of transmitters and a pair
of sensors on the moving target. The speed of the estimation is adjustable
according to the desired accuracy. An error of less than 5% can be reached in
most of the covered area. The presented system can be used in a number of
automation, robotics, virtual reality and ubiquitous applications.
1 Introduction
Several approaches have been recently proposed in order to estimate the position of a
moving target in an indoor area. The target may be a vehicle, a robot or even a human
in virtual reality applications.
The Global Positioning System [1] is the dominant solution for outdoor navigation
while cellular phone infrastructure can also provide indication of the position of a
mobile user [2]. Concerning indoor navigation all of the approaches presented so far
are based on measuring ultrasonic, RF, laser, magnetic or infrared light signal
strengths [3-9]. Triangulation methods are often applied to combine the indication
provided by multiple transmitter signals into a single coordinate. Another popular
technique is measuring the time of the flight of a signal in order to estimate distance.
In this case, the signal transmitter and receiver can both be mounted on the target.
Some techniques are also used in order to identify both the distance and the surface of
the target [7]. The indoor distance that can be estimated ranges from some centimeters
(for accurate machine tool handling) to several meters.
The position estimation system presented in this paper is not based on measuring
directly the strength of a signal. The signal strength is expressed as the ratio (success
rate) of the received digital infrared patterns to the expected ones in a specific time
interval. Different patterns are transmitted from 2 or more devices (called IRTX)
mounted on constant positions around the area we are interested in. Two sensors
(IRRX) are placed on the moving target facing opposite directions. The fact that the
infrared transmitters and receivers are not both placed on the moving vehicle results
Petrellis N., Konofaos N. and Ph. Alexiou G. (2006).
Position Estimation on a Grid, Based on Infrared Pattern Reception Features.
In Proceedings of the 3rd International Workshop on Ubiquitous Computing, pages 21-28
DOI: 10.5220/0002478000210028
Copyright
c
SciTePress

in larger area coverage since the signal does not have to travel a return path.
Processing digitally the success rate values can be performed by low cost
microprocessors. No high precision transmitters and receivers are needed as required
in the approaches based on analog signal intensity. Moreover, utilizing the success
rate of digital infrared patterns makes our positioning system feasible for a number of
domestic applications that already use infrared remote controls. For example, TV or
Hi Fi sets could recognize the position of a person and adapt appropriately their
orientation of the speakers and the screen, the sound volume etc.
In our previous work [10], the position of a moving target was estimated in an area
of 5m
2
using two transmitters with overlapping ranges. A calibration stage precedes
normal operation in order to specify the success rate behavior at specific points in the
covered area. If the two IRTX devices do not transmit concurrently, an exponential
model can be used in order to approximate the success rate behavior anywhere in the
plane. The success rate value measured at a specific position is identical for a number
of locations if a single pattern type is used. Hence, multiple infrared pattern types are
employed in order to assign an individual success rate vector in each position.
In the present work we extend the success rate vector considering the scrambled
patterns and the number of patterns received out of order. These additional
dimensions provide better estimation accuracy. In order to increase the speed and
minimize error, we focus in the case of two IRTX devices covering a confined area
and transmitting concurrently infrared patterns. In this case an approximation model
cannot be easily selected due to high scrambling and non-uniform behavior.
Consequently, a different approach is followed: a grid is drawn on the area that is
covered by the two IRTX devices. During the calibration phase the target visits the
grid nodes and learns the values for the various success rate dimensions.
At real time, the nearest node to the target is selected according to the least
deviation of the current success rate values from the calibration ones. Then, a fast
refinement procedure is carried out in the selected node’s neighborhood. This
refinement procedure is based on a two-dimensional interpolation search.
An estimation error mapping is presented for a grid plane of 20cm squares
examined as a case study, indicating the areas where accurate position estimations can
be achieved. The average relative error in these areas is less than 5% in each
direction. The error estimation can be further reduced if more samples are
encountered both during the calibration and the position estimation phase.
2 System Description
The architecture of the IRTX devices is presented in Fig. 1. A processing unit
generates the digital codes of the various pattern types. Each code consists of a
number of identical pulses. The codes are transmitted over a carrier in order to avoid
interference from other infrared light sources. The carrier frequency used in our setup
is 38KHz in order to utilize commercial low cost infrared receivers. A higher
frequency can be used in order to achieve faster position estimation. The carrier and
the pattern signals are mixed and amplified prior to the infrared emitting diode
driving. A number of commercially available diodes can be used according to the area
that has to be covered. A single diode of moderate beam angle (40
o
) dissipating
22
50mW has been used at each IRTX device for our case study. Diodes with wider
beam angle and higher power dissipation can increase the area covered by a single IRTX
device.
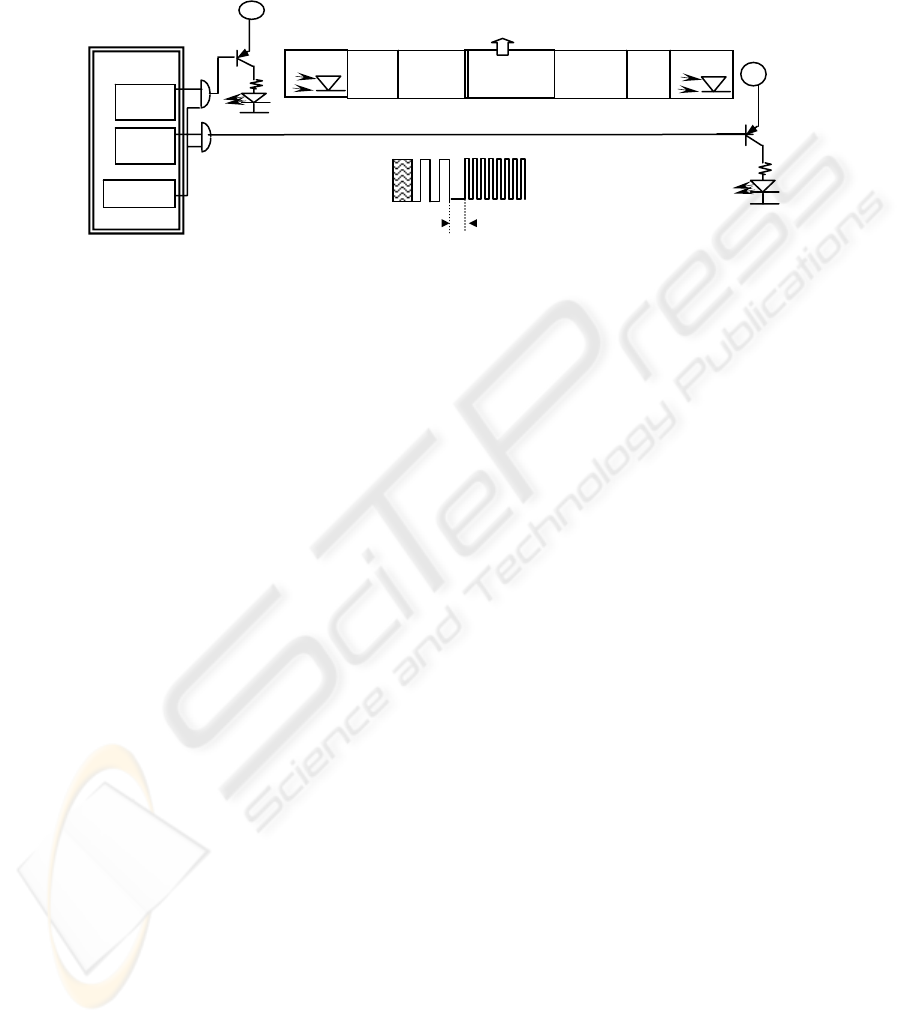
Fig. 1. The architecture of the IRTX and the IRRX device. A sample pattern sequence: A
Preamble followed by one MOD2 and one MOD8 pattern.
The IRTX device transmits initially a preamble indicating that a new round starts
(Fig. 1). The preamble can be a long pause period or a special pulse code not
matching any of the pattern codes that follow. As a next step, M identical codes are
transmitted, each one consisting of i long pulses. All of these codes belong to the
same pattern type called MODi. These M codes are separated by pause intervals of a
specific duration, P. The value of P is longer than the pulse period of any pattern
code. Then, another set of M identical codes of different type is transmitted. These
codes consist of j pulses shorter than the MODi ones. Hence, using this sequence, all
of the pattern type codes are transmitted and a new preamble is sent again indicating
that a new round starts.
Four pattern types are transmitted in our setup by each one of the two IRTX
devices used. In particular, IRTX1 transmits MOD2, MOD5, MOD6 and MOD9
while IRTX2 transmits MOD3, MOD4, MOD7 and MOD8. The specific combination
was used in order to compare the behavior of similar pattern types like MOD3 with
MOD4 or MOD5 with MOD6. In the general case, MODi can cover longer distances
than MODj if i<j. Nevertheless, no position estimation can be carried out by long
period patterns in short distances. If the two IRTX devices transmit codes
simultaneously the aforementioned behavior of MODi compared to MODj is not
always valid, due to intense scrambling.
The receiver consists of 2 sensors (IRRX
A
and IRRX
B
) facing opposite directions
and a microcontroller (Fig. 1). Each IRRX sensor consists of an infrared detector
followed by a carrier filter. The output of the carrier filter is connected to the
processing unit. This unit is responsible for the recognition of a code as a valid pattern
or not. Both valid and invalid codes are encountered and the average values of the
samples retrieved are used for the position estimation. In our experimental setup, a
host computer or a laptop is needed to process the average values and present the
resulting coordinates.
In our experimental setup, the processing unit controlling the IRRX devices
estimates the success rates during a single round (between two preambles) based on
proc. unit
Pause interval P
Preamble
MOD2 MOD8
MOD
2
,
5
,
6
,
9
MOD
3
,
4
,
7
,
8
38KHz
IRTX1
IRTX2
+
47Ω
SFH485
+
5V
IRRX
A
BPF
Carrier
Re
j
ect.
Controller
Host Com
p
ute
r
IRRX
B
BPF
Carrier
Re
j
ect.
Sensor
Sensor
2N3906
23
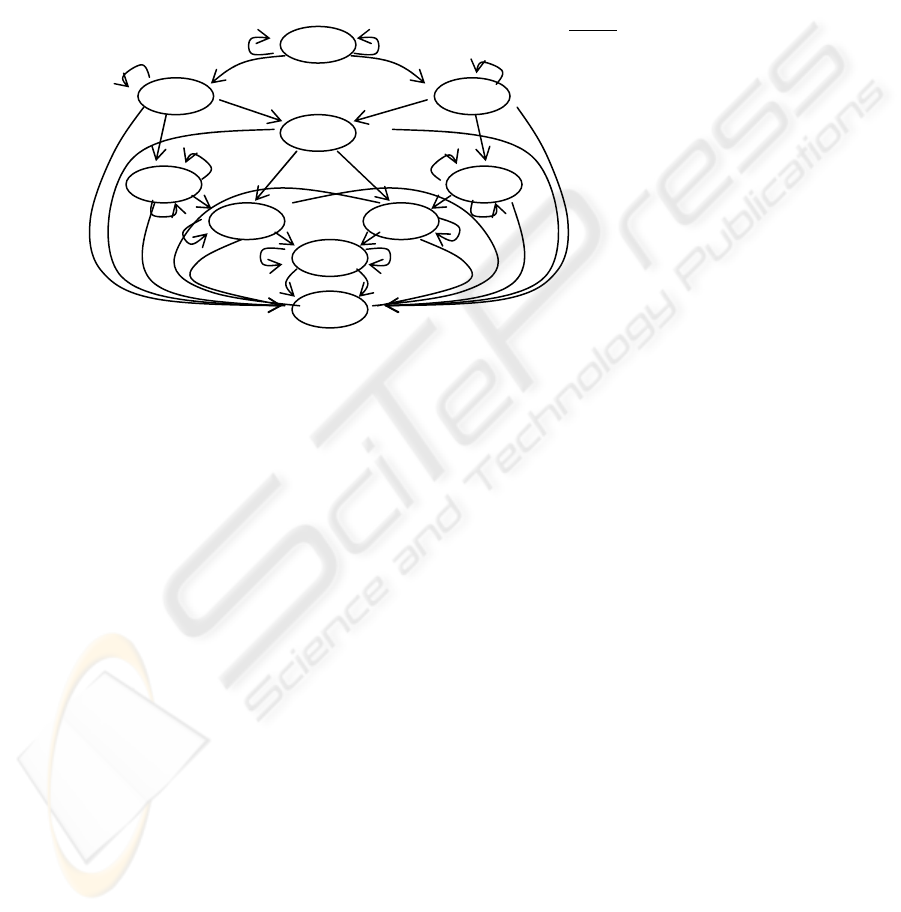
the state diagram presented in Fig. 2. The 2
nd
and 4
th
character of the state names
indicate three potential stages of a single round reception on IRRX
A
and IRRX
B
respectively: U for Unknown, P denotes that a preamble has been recognized on the
specific sensor and n denotes that any arriving pattern is encountered.
In AnBn both receivers accept and record patterns although some of them may not
arrive in the order expected or by the corresponding IRRX device. The number of
patterns that arrived in order on IRRX
A
are stored in vector A, while the out of order
patterns are stored in A’. Vectors B and B’ are used in the same way on IRRX
B
. The
state End denotes that a new preamble has been detected.
Fig. 2. FSM for the recognition of the patterns received on IRRX
A
and IRRX
B
.
3 Position Estimation Method
The success rate is defined as a ratio of the number n
i
of the received successive
identical MODi patterns, to the number M of the expected ones. M is common for all
MODi. Hence,
SuccessRate
MODi
=n
i
/M (1)
A number of samples are retrieved and the average value of the sample success
rates is used for the position estimation or as a reference value defined during the
calibration phase. In order to minimize the effect of instant noise, some samples that
deviate mostly from the others may be excluded from the averaging process.
The two IRRX devices (named IRRX
A
and IRRX
B
) provide independent success
rate measurements but it is more convenient to have IRRX
A
facing at IRTX1 and
IRRX
B
facing at IRTX2. Considering the restricted beam angle of the receiving
devices it would be expected that every IRRX device receive patterns from the
transmitter in front of it. Despite the fact that inside too large indoor areas with no
surrounding objects this might be true, this is not the case for smaller rooms where
reflections are significant. Instead of viewing the reflections as a drawback we exploit
their effect by encountering the scrambled patterns as a different factor during the
position estimation phase. More specifically, we define two vectors for storing the
AUBU
APBU
AUBP
APB
AnBU
AUBn
AnB APB
AnB
End
An Bn
AP BP
An
Bn
B
AP
AP
AP
AP
AP
AP
AP
BP
BP
BP
BP
BP
BP
An/*
1 Bn/*2
An/*1 Bn/*2
An
Bn
An/
*
Bn/*4
An/
*
Bn/*4
An/*3
Bn/
*
4
BP
AP
An/*1Bn/*
2
Actions:
*1 – A[n] ←1; A[i] ←0,
for every i<n; TA←n
*2 – similar to *1 for B, TB
*3 – if n<TA then A’[n] ← A’[n]+1
if n=TA then A[n] ← A[n]+1
if n>TA then A[n] ←1, A[i] ←0,
for every i>TA and i<n ; TA←n
*4 – similar to *3 for B, B’ and TB
24

success rates measured from an IRRX device as derived by Fig. 2. IRRX
A
determines
the vectors A and A’ that store the success rates of the in and out of order samples
respectively. These vectors refer to all of the MODi pattern types even if some of
them were expected from the IRRX
B
instead of the IRRX
A
device. In the same way B
and B’ are set by IRRX
B
device. Hence, vector A contains the following 10 values:
A=[a
1
,a
2
,…,a
10
] (2)
For example, a
2
in equation (2) denotes the success rate measured by IRRX
A
for
MOD2 using patterns that arrived in order while a
2
’ in A’ includes the MOD2 patterns
that arrived out of order. If IRTX1 transmits MOD2, MOD5, MOD6 and MOD9, the
parameters a
3
, a
4
, a
7
, a
8
encounter patterns sent by IRTX2 and received by IRRX
A
through reflection. Parameters a
10
, a
10
’, b
10
, b
10
’ may encounter scrambled or
attenuated MODi patterns (i>9) that are not supported by any IRTX device.
The vectors RA
j
, RA
j
’, RB
j
and RB
j
’ corresponding to A, A’, B and B’ are defined
during calibration for every grid node j. All RA, RA’, RB and RB’ vectors are stored in
the memory of the IRRX microcontroller. For example, if the area is covered by a
grid of 100 nodes then 400 vectors of 10 floating point values need to be stored after
calibration.
At real time operation, the vectors A, A’, B and B’ store the measured success rates
at a specific position of the vehicle and are compared to all RA, RA’, RB and RB’ node
vectors in order to locate the closer one. The comparison is based on the calculation
of the relative deviation between a node success rate value and the corresponding
value of the current position of the vehicle. This operation can be applied to all the
values of the vectors A, A’, B and B’ if the reflection or scrambling effects need to be
considered. The relative deviation d
j
between the real time measured value v of a
position vector and the corresponding reference value r
j
of a node j (estimated during
calibration) is defined by equation (3). Parameter v can be any of a
i
, a’
i
, b
i
or b’
i
, and
r
j
its corresponding value in the RA
j
, RA
j
’,RB
j
and RB
j
’ vectors of the node that is
currently examined. All the resulting d
j
parameters are added up into a single
deviation value Dj that indicates how close is the current position to the node j
(equation 4).
d
j
=(v-r
j
)/v, if (v>r
j
)
d
j
=( r
j
-v)/ r
j
, if (v≤r
j
)and (r
j
≠0)
d
j
=1 if v=0 or r
j
=0
(3)
∑
∑
∑
∑
∈∈∈∈∈∈∈∈
+++=
',',',', BvRBjrBvRBjrAvRAjrAvRAjr
djdjdjdjDj
(4)
In equation (4) both the expected, unexpected and out of order samples have been
considered. The closer node is selected from the minimum of the Dj values. Although
the selection of the closer grid node is a fundamental issue, a refinement procedure
should follow in order to further approximate the exact position of the target. This
refinement stage is based on the assumption that in the small dimensions of a grid the
success rate of a specific pattern changes linearly between successive nodes and thus,
an interpolation search in two dimensions can be applied.
25
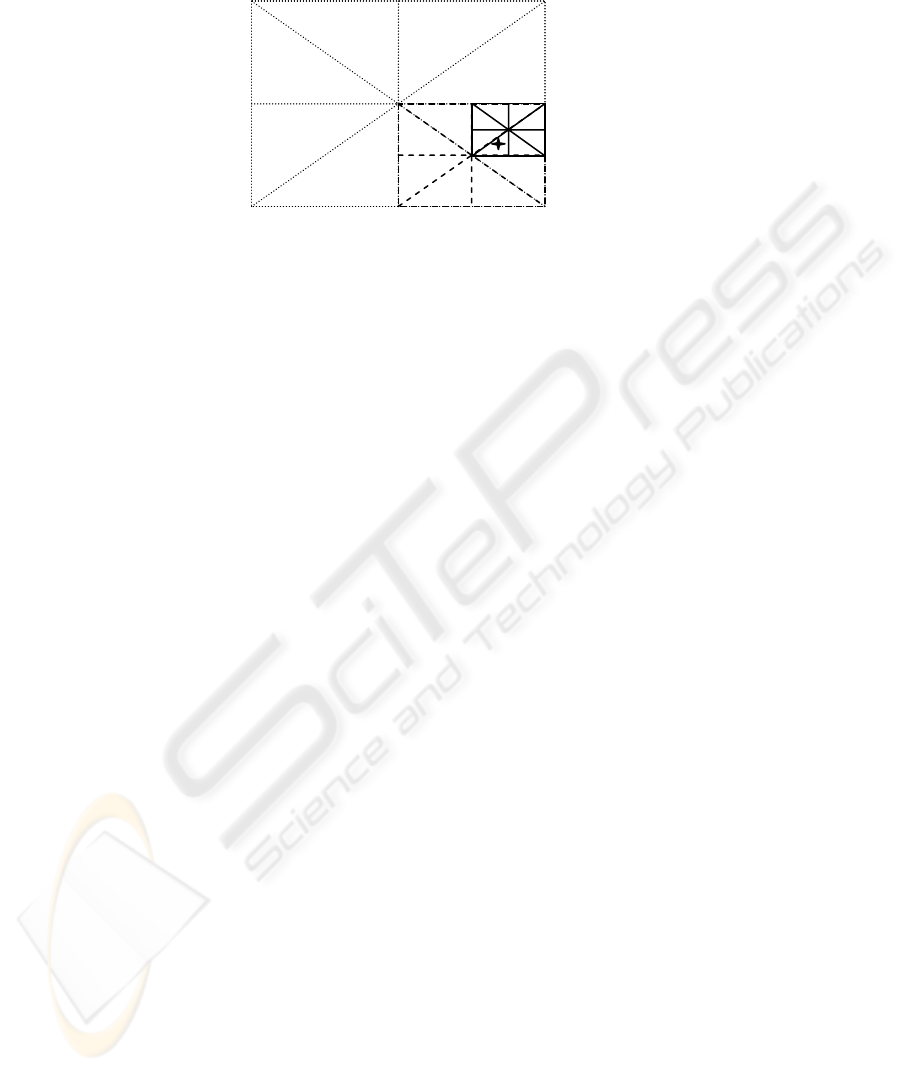
Fig. 3. Refinement Stage.
For instance, consider the grid of Fig 3. If E0 is the initial node that is found to be
closer to the current position P, the reference values between the success rate vectors
of E0 and its neighboring nodes Ei (1≤i≤8) are averaged in order to get an
approximation about the reference success rates of the position in the middle of E0
and Ei. These new reference success rates are used in equation (4) in order to
determine the direction we should look for the target. In Fig. 3, it is shown that P was
located in the direction of E2 in the initial set of neighboring nodes. The point in the
middle of E0 and E2 (denoted as E0’) is now assumed to be the center of a new grid
with node distance set to the half of the initial. The reference success rates of the
neighboring nodes of E0’ in the new grid are once again determined by averaging the
known or estimated from the previous step success rate values. Applying recursively
the refinement procedure, the position P can be approximated at the next step by E0’’
etc. If the minimum Dj estimated in a new grid is not lower than the one of the
previous grid the refinement procedure stops.
4 Experimental Results
The experimental results presented in this section, were retrieved using the following
setup: an IRTX device (IRTX1) is used as a coordinate reference. A grid of 20cm
squares is drawn in front of IRTX1. The coordinates of a point are expressed in the
form (ver,hor,dir), where ver and hor denote the vertical and horizontal distance of
the point from IRTX1 and dir the direction (Left or Right). A second transmitting
device (IRTX2) is placed at (260cm, 60cm, Left) as shown in Fig. 4. The IRTX2 is
not in a vertical position related to the moving target. The specific position and
orientation of IRTX2 was chosen in order to break the symmetry between the left and
the right of the IRTX1 axis. Moreover, the angular displacement of the IRTX2 and
the IRRX
B
device leads to success rates with different behavior compared to the ones
achieved from the communication between IRTX1 and IRRX
A
. The purpose of this
topology is to achieve distinct A, A’, B and B’ vector values for each individual
position on the grid in order to reduce the points that may be confused.
E1
E2
E8
E3E4
E5
E6 E7
E0
E0
E1’
E2’
E3’
E4’
E5
’
E6’
E7’
E
E0’’
E1
’’
E2’’
E3’’
E4’’
E5’’
E6’’
E7’’
E8’’
P
26
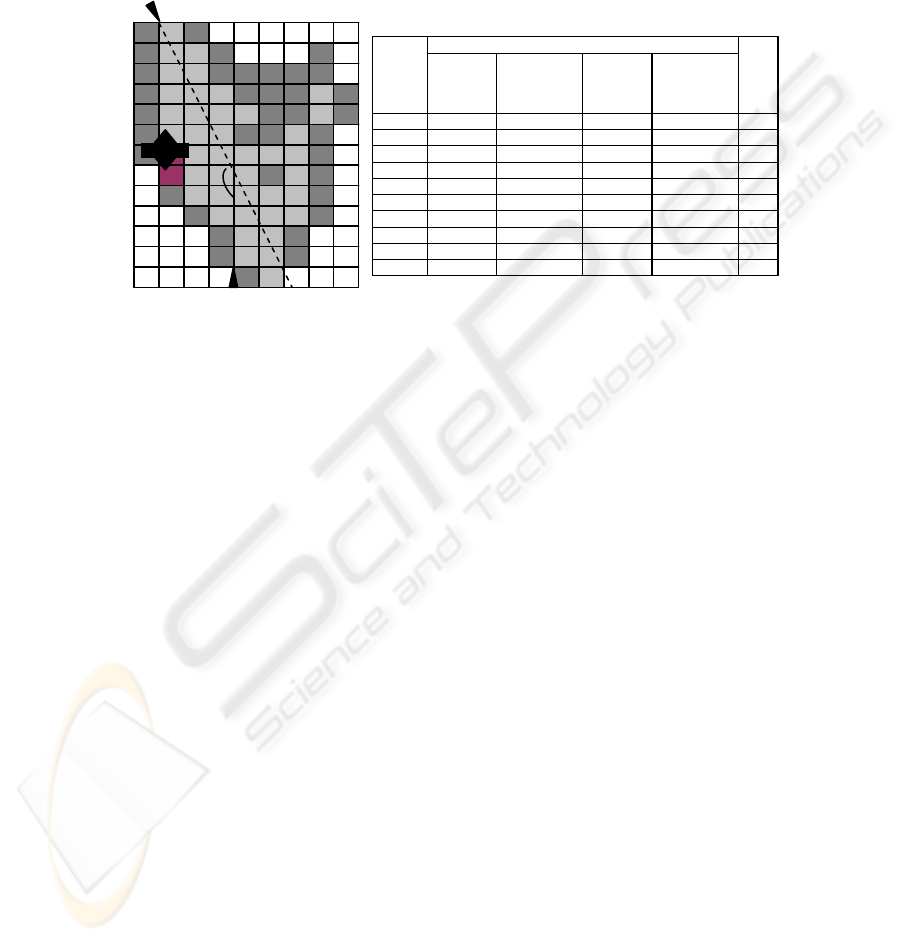
A mapping of the reliable and unreliable regions along with some example
estimations is also presented in Fig. 4. Reliable position estimation can be carried out
in more than 40 squares, covering an area of 1.6m
2
. An estimation in our set up is
assumed to be reliable if the horizontal and vertical distance of the real position from
the estimated one is 10cm or less. The mean error achieved in the reliable areas is
approximately 5cm.
Fig. 4. Mapping of Reliable (pale shade) and Unreliable regions on the grid.
As far as the speed of the position estimation is concerned, a calculation of the time
needed to get a single success rate value for a pattern is needed at first. This time
interval is not equal for all the MODi types. As already mentioned, the pulse period of
MODi is shorter for higher i values (ranges from 500us to 1320us in our setup) but
the number of pulses is also higher.
The aforementioned pulse period times were selected in order to allow the period
of the pulse to be longer than the period of the carrier (38KHz in our case). A single
MOD2 pattern needs 2x1320us=2.64ms while a MOD9 pattern needs
9x500us=4.5ms. If the number of samples needed to extract a success rate is M=10
and the pause period between two successive codes is P=1ms then the total time
needed by the IRTX device to transmit a round of patterns which is the time interval
between two preambles, is less than 200ms. In most cases more than one round is
needed in order to get multiple success rate values and abort the samples with higher
deviation.
The estimation speed achieved in our lab can be drastically enhanced if a higher
carrier frequency is chosen. If infrared components with fast rise and fall times are
used the carrier frequency can be increased up to 1MHz. In this case a custom carrier
filter can be used at the side of the receiver.
IRTX1
IRTX2
IRRX
IRRX
150
o
80R 40R 40L
80L
20
60
100
140
180
220
260
Estimated Position
Real
Position
Expected
Patterns
Expected+
Erroneous
Patterns
Expected+
Wrong
Order
Patterns
Expected+
Erroneous+
Wr. Ord.
Abs.
Error
50,10L
20,20R 110,30L 30,20R 47,19L 9cm
70,0C
100,50L 100,40L 90,50R 70,10R 10cm
100,20R
140,40R 140,40R 140,40R 140,40R 44cm
110,30R
95,40R 110,30R 110,30L 110,30R 0cm
110,30L
120,20L 120,20L 110,20L 110,20L 10cm
130,60L
181,52L 150,60L 195,77L 190,50L 20cm
125,20L
180,80L 180,80L 190,80L 130,20L 5cm
160,30L
160,20L 160,30L 163,10L 160,10L 0cm
186,62L
200,80L 200,40L 170,60L 194,58L 9cm
210,50L
210,60L 200,40L 210,50L 210,50L 0cm
27

5 Conclusions
The ultra low cost system presented in this paper is capable of locating the position of
a target on a grid plane covering distances of more than one meter with adequate
accuracy (less than 10cm error). The coordinate estimation method is based on the
success rate that multiple pattern types are received at a specific position. The closer
node of the grid is located first and then a 2D interpolation search estimates the exact
target position. Using an appropriate topology of the pattern transmitting devices, the
grid squares that allow reliable position estimation were mapped. The factors
affecting the speed of the position estimation method were also discussed.
Future work will focus on studying proper topologies of more than 2 infrared
transmitting devices in order to extend optimally the area covered. Moreover, it will
be attempted to increase the degrees of freedom of the moving target. The history of
movements of the target will also be exploited in order to predict potential future
positions and increase the stability of the coordinate estimation.
References
1. Hoffman-Wellenhoff, B., Lichtenegger, H. and Collins, J.: Global Positioning Systems,
Theory and Practice. Springer-Verlang, Berlin (1997)
2. Salamah, M., Doukhnitch, E. and Devrim, D.: A Fast HW Oriented Algorithm for Cellular
Mobiles Positioning. Springer-Verlag Berlin Heidelberg LNCS 3280 (2004) 267-277
3. Borenstein, J., Everett, B. and Feng, L.: Navigating Mobile Robots: Systems and
Techniques. A.K. Peters Ltd. Wellesley, MA (1996)
4. Coor-Harbo, A.: Geometrical Modeling of a Two Dimensional Sensor Array for
Determining Spatial Position of a Passive Object. IEEE Sensors Journal, Vol 4, No 5, (Oct
2004) 627-642
5. Fox, D., Burgard, W., and Thrun, S.: Markov Localization for Mobile Robots in Dynamic
Environments. Journal of Artificial Intelligence Research, 11 (1999) 391-427
6. Krohn, A., Beigl, M., Hazas, M., Gellersen, H.-W.: Using Fine-Grained Infrared
Positioning to Support the Surface-Based Activities of Mobile Users. 5
th
IWSAWC,
ICDCSW (2005) 463-468
7. Aytac, T. and Barshan, B.: Simultaneous Extraction of Geometry and Surface Properties of
Targets Using Simple Infrared Sensors. Optical Eng. 43(10), (2004) 2437-2447
8. Kosel, J., Pfutzner, H., Mehnen, L., Kaniusas, E., Meydan, T., Vazquez, N., Rohn, M.,
Merlo, A.M. and Marquardt, B.: Non Contact Detection of Magnetoelastic Position
Sensors. Elsevier Sensors And Actuators, A 123-124 (2005) 349-353
9. Prigge, E.A. and How J.P.: Signal Architecture for Distributed Magnetic Local Positioning
System. IEEE Sensors Journal, Vol. 4, No. 6, (Dec 2004) 864-873
10. Petrellis, N., Konofaos, N. and Alexiou G.: Testing IR Photon Sensors for Target
Localization Applications. International Workshop on Advances in Sensors and Interfaces,
Bari, Italy, Apr. 19 (2005) 153-158
28
