
REQUIREMENTS ELICITATION FOR DECISION SUPPORT
SYSTEMS: A DATA QUALITY APPROACH
Alejandro Vaisman
Universidad de Buenos Aires
Keywords: OLAP, Data Warehousing, Requirements, Decision Support System.
Abstract: Today, information and timely decisions are crucial for an organization’s success. A Decision Support
System is a software tool that provides information allowing its users to take decisions timely and cost-
effectively. This is highly conditioned by the quality of the data involved. In this paper we show that
conventional techniques for requirement elicitation cannot be used in Decision Support Systems, and
propose DSS-METRIQ, a methodology aimed at providing a single data quality-based procedure for
complete and consistent elicitation of functional (queries) and non functional (data quality) requirements.
In addition, we present a method based on QFD (Quality Function Deployment), that, using the information
collected during requirements elicitation, ranks the operational data sources from which data is obtained,
according to their degree of satisfaction of user information requirements.
1 INTRODUCTION
Among the phases of the software development
process, requirement analysis and specification of
functional and non-functional requirements is a
crucial one. The lack of good requirement
specification is a major cause of failure in software
development. The Software Engineering community
has developed many useful tools for requirement
analysis in transactional systems. These kinds of
systems deal with the day-to-day operation of an
organization. Decision Support Systems (hereafter
DSS) are of a complete different kind: they are
focused on integrating data and models in order to
improve the decision-making process. The software
development cycle of DSS has particularities that
require applying methodologies different than the
ones used for operational systems because: (a)
traditional methodologies have been thought and
designed with transactional systems in mind; (b)
specific methodologies applicable to DSS aroused as
ad-hoc answers to practical needs, and most of them
are just mere enumerations of activities that must
take place during system implementation, focusing
on populating the data repository while ignoring
important issues like the impact of changes in the
operational data sources, or, worse, if these data
sources satisfy the users’ information requirements.
Based on the above, we propose a methodology
called DSS-METRIQ, that integrates concepts of
requirements engineering and data quality, in order
to provide a comprehensive solution to the
requirements elicitation process specifically oriented
to data warehousing, OLAP and Decision Support
Systems. DSS-METRIQ is a methodology aimed at
providing an integrated and consistent analysis of
functional (queries) and non-functional (data
quality) requirements. DSS-METRIQ also addresses
completeness of the operational data sources (i.e.
what is the set of queries the system will be able to
answer in a reliable way using the available data),
and data quality issues. The methodology also
accounts for conflicting requirements and provides
tools for their resolution. A relevant contribution of
DSS–METRIQ is a method which, using the
information collected during requirements
elicitation, ranks the operational data sources
according to their degree of satisfaction of user
information requirements.
In Section 2 we review related work and study
the differences between DSS and operational
systems with respect to requirements elicitation.
Section 3 discusses Data Quality. Section 4
introduces DSS-METRIQ, and Section 5 gives a
more detailed description. We conclude in Section 6.
2 RELATED WORK
The concept of Decision Support refers to a
methodology (or collection of methodologies)
designed to extract information from a database (or
316
Vaisman A. (2006).
REQUIREMENTS ELICITATION FOR DECISION SUPPORT SYSTEMS: A DATA QUALITY APPROACH.
In Proceedings of the Eighth International Conference on Enterprise Information Systems - ISAS, pages 316-321
DOI: 10.5220/0002444603160321
Copyright
c
SciTePress

data warehouse) and use it to support the decision
making process. In spite of the popularity gained by
DSSs in the last decade, a methodology for software
development has not been agreed. System
development involves (roughly speaking) three
clearly defined phases: design, implementation and
maintenance. However, in the development cycle of
traditional software systems, activities are carried
out sequentially, while in a DSS they follow a
heuristic process (Cippico, 1997). Thus,
methodologies for developing operational and DSS
systems are different. Most contributions on
requirements analysis for DSS came from consulting
companies and software vendors. On the academic
side, Winter and Strauch (2003, 2004) introduced a
demand-driven methodology for data warehousing
requirement analysis. They define four-steps where
they identify users and application type, assign
priorities, and match information requirements with
actual information supply (i.e. data in the data
sources). There are several differences with the
methodology we present here. The main one resides
in that our approach is based on data quality, which
is not considered in the mentioned paper. Moreover,
although the authors mention the problem of
matching required and supplied information, they do
not provide a way of quantifying the difference
between them. On the contrary, we give a method
for determining which is the data source that better
matches the information needs for each query
defined by the user. Paim and Castro (2003)
introduced DWARF, a methodology that, like DSS-
METRIQ, deals with functional and non-functional
requirements. They adapt requirements engineering
techniques and propose a methodology for
requirements definition for data warehouses. For
non-functional requirements, they use the Extended-
Data Warehousing NFR Framework (Paim &
Castro, 2002). Although DWARF and the extended
NFR framework are close to the rationale of DSS-
METRIQ, the main differences are: (a) we give a
more detailed and concrete set of tools for non-
functional requirements elicitation; (b) we provide a
QFD-based method for data source ranking; (c) we
give a comprehensive detail of all the processes and
documents involved. Prakash and Gosain (2003)
also emphasize the need for a requirements
engineering phase in data warehousing development,
and propose the GDI (Goal-Decision-Information)
model. The methodology is not described at a level
of detail that may allow a more in-depth analysis.
3 QUALITY CONCEPTS
Many techniques have been developed in order to
measure quality, each one of them associated to a
specific metric. In what follows, we comment on the
ones we are going to use in our proposal.
GQM (Goal Question Metric) is a framework for
metric definition (Basili, Caldiera & Rombach,
1992). It describes a top-down procedure allowing to
specify what is going to be measured, and to trace
how measuring is being performed, providing a
framework for result interpretation. The outcome of
the process is the specification of a system of
measurements that consists of a set of results and a
set of rules for the interpretation of the collected
data. The model defines three levels of analysis: (a)
conceptual (Goal), where a goal for a product,
process or resource is defined; (b) operational
(Question): at this level, a set of questions is used
for describing the way an specific goal will be
reached; (c) quantitative (Metric): the metric
associated with each question.
Quality Function Deployment (QFD) (Akao,
1997), proposed in the 60's by Yoji Akao, was first
conceived as a method for the development of new
products under the framework of Total Quality
Control. QFD aims at assuring design quality while
the product is still in its design stage. It defines an
organizational behavior based on the conception of a
multifunctional team that intends to reach consensus
on the needs of the users and what they expect from
the product. The central instrument of the
methodology is the "house of quality" matrix.
Data Quality. Efforts made in order to improve data
quality are generally focused on data accuracy,
ignoring many other attributes and important quality
dimensions. Wang et al identified four data quality
categories after evaluating 118 variables (Wang &
Strong, 1996): (1) intrinsic data quality; (2)
contextual data quality; (3) data quality for data
representation; (4) accessible data quality. There is
a substantial amount of academic research on the
multiple dimensions applicable to quality of
information. For the sake of space we do not
comment on them in this work. The interested reader
should take a look to the work of Hoxmeier
(Hoxmeier, 2000), Jarke et al (Jarke & Vassiliou,
1997), and many other ones.
4 DSS-METRIQ OVERVIEW
We now introduce DSS-METRIQ, a methodology
specifically devised for requirements elicitation for
DSSs. The methodology consists of five phases:
scenario, information gathering, requirements
integration, data source selection, and document
generation. The rationale of the methodology is
REQUIREMENTS ELICITATION FOR DECISION SUPPORT SYSTEMS: A DATA QUALITY APPROACH
317

the following: on the one hand, the data consumer’s
functional requirements are analyzed, unified and
documented. On the other hand, the quality of data
in the data sources is collected from the data
producer users. This information is then analyzed as
a whole, and a set of documents are produced, that
will allow matching requirements with available
data. In the remainder of this section we will
introduce the methodology, and discuss the
conceptual basis over which it is built. A detailed
description can be found in (Vaisman, 2006).
Framework.
The methodology defines the
following roles and participants in the team that will
carry out the project: (a) Project leader; (b) Training
leader; (c) Requirements engineer; (d) Query and
Data manager: analyzes the queries; (e) Information
administrator. A User is any person participating in
the project. Users to be interviewed are: (a) data
producers; (b) data consumers; (c) referent users
(users with a higher hierarchy in the organization
than the ones defined in (a) and (b)).
Data Sources. DSS-METRIQ defines two kinds of
data sources: physical and logical. The former are
sources where data is actually stored. The latter are
sets of data sources producing a data element.
Supporting Elements. DSS-METRIQ provides
elements for supporting the management of the
information collected throughout the process. These
elements are forms, matrices, a data dictionary and
an aggregations dictionary. Forms are elements
that register the collected information, and can be
updated during the process. Matrices are equipped
with certain intelligence that allows giving weight to
the information contained in the forms, in order to
qualify and prioritize requirements. A data
dictionary is a catalogue of data that contains names,
alias and detailed descriptions of the atomic
elements that compose the user queries, data
sources, and the data warehouse. Its purpose is the
definition of a common meaning for each one of
these elements, allowing formulating user’s
requirements on the basis of a unique terminology. It
can also be updated throughout the process. The
aggregations dictionary is a catalogue containing
information on dimensions and aggregations.
Data Quality Requirements. We work with the
following quality dimensions: accuracy,
consistency, completeness, timeliness, query
frequency, source availability and accepted response
time. Associated
to timeliness we also add: currency, and volatility.
Accuracy. Measures how close to the value in the
real world is the data under consideration. The
accuracy of a data warehouse is influenced by two
main factors: (a) accuracy of the data sources; (b)
the error factor that the ETL process can introduce.
Consistency. We adopt the ontological point of view,
which describes consistency as the “logical
consistency” of information. The underlying idea is
that given two instances of representation for the
same data, the value of the data must be the same.
Completeness. Is the ability of an information
system of representing every significant state of the
real world. For instance, if there are 250 employees
in the organization, we expect at least one record for
each one of them to be in the database.
Timeliness. Measures the delay between a change in
the state of the real world and the resulting
modification of the state in the data warehouse. This
dimension is tightly associated with other two ones:
currency and volatility. Currency measures the age
of the data. It is computed as the difference between
the present time, and the instant when the data
element was created (Wang, 1992). Volatlity
measures the interval in which the data is valid in
the real world (Wang, 1992). Finally, Timeliness is
defined as:
Timeliness(d)=MAX[1–currency(d)/ volatility(d),0]
s
where s = sensitivity, s >0. Timeliness ranges
between 0 (worst case) and 1 (desirable value).
Data source availability. Given a time interval, is
the time during which the data source is available
(Jarke, Lenzerini, Vassiliou & Vassiliadis, 2003).
Expected query response time. It is the maximum
accepted time for getting the answer to a query.
Query Frequency. Minimum time between two
successive queries.
Measuring Quality It is necessary to define a
unique way of specifying user needs, and measuring
whether the DSS or the data warehouse will be able
to fulfill the minimum levels of quality required. To
this end, our methodology applies GQM to each one
of the dimensions defined above. This technique is
used both for specifying user requirements, and for
measuring the actual values for data quality in the
available data sources. Due to space constraints,
below we only show how the technique is applied to
the accuracy as follows:
a) Specification of user requirements.
Goal: Specify the level of accuracy required for
each data element in a query.
Question: What is the maximum acceptable
difference between the answered obtained, and the
actual value of the data element in the real world?
Metric: The user must specify the maximum
accepted difference between the value of a data
element in the data warehouse and its value in the
real world.
b)Measuring accuracy in the data sources.
ICEIS 2006 - INFORMATION SYSTEMS ANALYSIS AND SPECIFICATION
318

Goal: Determine the accuracy value of the data in
each source.
Question: ¿What is the divergence between the
value of the data in the source and in the real world?
Metric: Accuracy of the data source for a certain
attribute.
Measuring methodology: Given a representative
sample of the data in the real world, we define the
accuracy of the data source as:
Accuracy = [ MAX ] * 100
We proceed analogously for the other quality
dimensions. This allows determining which data
sources can be considered apt for developing the
DSS, meaning that if a data source does not fulfill
the minimum bound for a quality dimension, a data
cleaning procedure can be applied in order to
improve data quality. Otherwise, the data source
must be discarded (or a quality lower than the
desired one would be obtained).
Integrated Requirement Analysis. After finishing
the interview phase, and when all functional and
quality requirements have been obtained,
information is consolidated, yielding a single
requirements document that will be input for the
later phases of design. In this unification and
integration process we need to establish priorities
and solve conflicting requirements. Thus, we define
a set of priorities for each functional and non-
functional requirement. Conceptually, this priority
indicates the level of importance of the requirement.
Priorities are defined by a number between 1 and 5
as follows: optional requirement = 1; low
importance importance requirement = 2;
intermediate importance requirement = 3; high
importance requirement = 4; mandatory requirement
= 5. Conflicts between requirements are solved
using priorities. When two conflicting requirements
have the same priority, a high-level user must decide
which one will be considered. Once conflicts are
solved, Requirements validation is performed.
5 DSS-METRIQ IN DETAIL
In this section we describe the phases of the
methodology, giving details of the processes within
each phase. Each phase groups together tasks that
are conceptually related. In what follows we
describe the key aspects of each one.
Phase I – Scenario The goal of this phase is to
introduce the project to the different levels of the
company, building a consensus about the scope and
boundaries of the project (v.g., users, domains),
priorities, and the initial configuration of the
information. The input of this phase consists of: (1)
details of the project; (2) initial list of domains
involved; (3) scope and list of participants of the
introductory meetings. The output of the phase is a
set of documents containing: (1) domains, and
domain hierarchy; (2) users, and user hierarchy; (3)
quality dimensions; (4) data dictionary; (5)
aggregation dictionary.
Phase II – Information Gathering The goal is to
capture and document functional (queries) and non-
functional (quality) requirements, taking into
account the scope defined in Phase I. The output of
the phase includes: (1) list of the queries expected to
be posed to the system; (2) a data form, consistent
with the data dictionary; (3) data quality
requirements form, one for each data element; (4)
quality hierarchy. The steps of the phase are: (1)
interviews with users and referent people; (2) query
analysis; (3) query reformulation; (4) validation
interviews; (5) quality survey interviews; (6)
prioritizing of quality factors.
Phase III – Requirements Integration In this
phase requirements from all users and domains are
unified, using a criteria based on QFD (Akao, 1997).
In the input of the phase we have: (1) a query list;
(2) a hierarchy of quality dimensions; (3) a data
quality requirements form; (4) data and aggregation
dictionaries; (5) a hierarchy of domains; (6) a
hierarchy of users. The output of the phase is a set of
documents containing the unified data model, the
query priorities, and the data requirements
matrix. After the analysis of query redundancy,
unified query prioritizing is carried out, by means of
a scale of priorities. First, we need to unify
requirements from the different domains, defining
priorities between them. DSS-METRIQ proposes the
following order:
Priorities between domains ►
Priorities between users ► Priorities between queries of
the same user.
Intuitively, the idea is that the
requirement with the least priority in a domain
prevails over the requirement in the domain
immediately following (in importance) the previous
one. The following formula defines the global
priority computation for a query “Q” (
PriorityG(Q)):
PriorityG(Q) = PriorityD (D) * X
2
+ PriorityU (U) * X +
PriorityQ(Q);
where PriorityD(D), PriorityU(U) and
PriorityQ(Q) are the domain, users and query
priorities.
As a result of this step we obtain a query set, with
priorities defining an order for satisfying data and
quality requirements. Finally, a Data Requirements
Matrix is built, integrating all requirements.
Phase IV – Data Source Selection In this step, data
sources are studied in order to determine if they
fulfill the information requirements. The output of
((X - Xreal)^2/Xreal)
REQUIREMENTS ELICITATION FOR DECISION SUPPORT SYSTEMS: A DATA QUALITY APPROACH
319

the phase is a qualification for each data source with
respect to each data element. The first step of the
phase is the analysis of data sources. Meetings with
data producers are carried out, where the set of data
sources, their availability, and the quality of their
data are documented. The following actions are
taken: (a) the data producer determines the priority
criteria for data source usage. Priority ranges
between 1 and 5. (b) the analyst finds out if a
physical source contains the required data; (c) if a
combination of fields yields some of the required
data, this combination is considered a logical data
source. Then, the quality of the data source for each
data-source combination is determined. The data
provider informs quality characteristics of the data
source, and a mapping for the required fields (i.e.,
where is the required data located, and under which
name). The data source quality assessment step
integrates, in a single data source assessment matrix,
the three essential components of the methodology:
(a) data requirements; (b) quality requirements; and
(c) data sources. Example 1 below shows how the
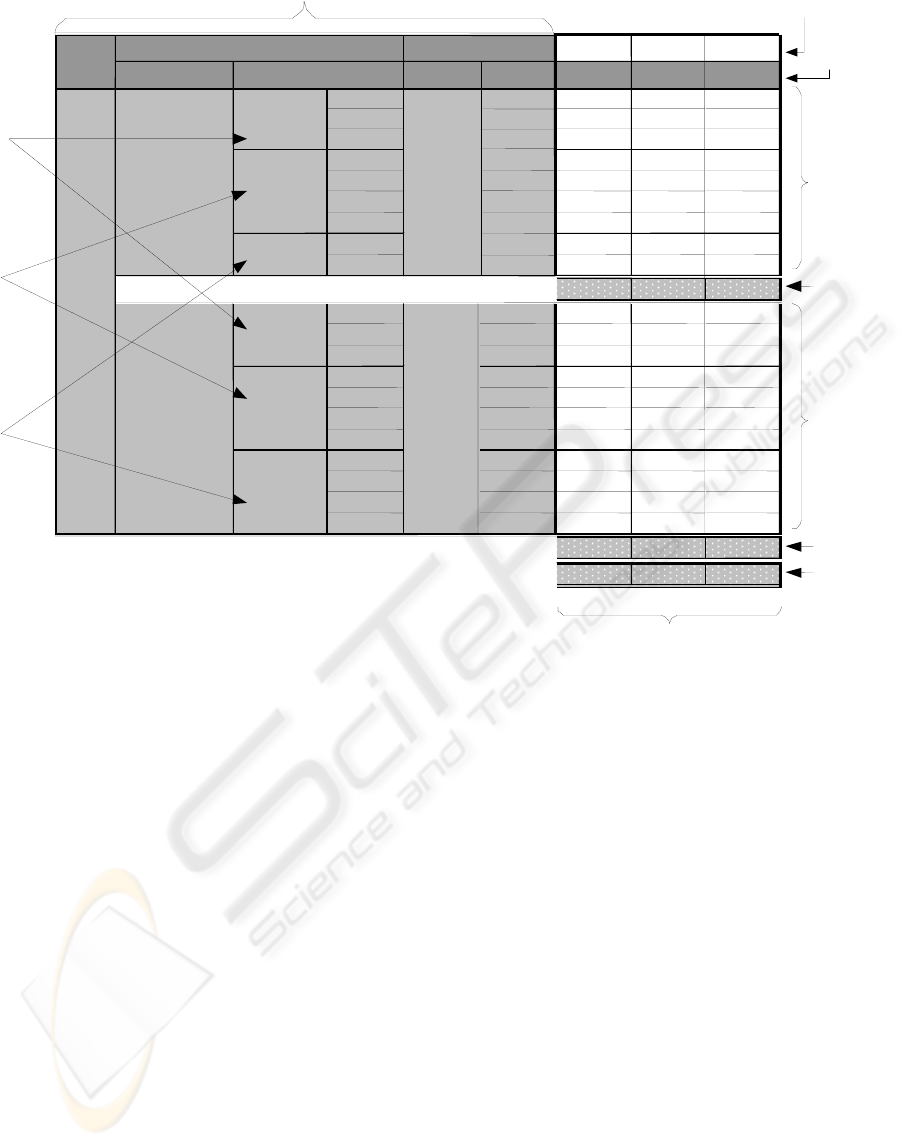
assessment matrix (see Figure 1) is built. This
procedure is an adaptation of the QFD methodology.
Example 1. Through different interviews we
obtained the following information. For User 1 and
Query 101 – Quality priorities: accuracy: 1,
consistency: 3, completeness: 5, timeliness: 2;
Global priority of the query: 130 (obtained as a
function of the user’s and domain’s priorities);
Aggregations required: day and month. For User 2,
and Query 92 - Quality priorities: accuracy: 4,
consistency:5, completeness: 1, timeliness: 3;
Global priority of the query: 31; Aggregations
required: country, province, city, neighborhood.
Each matrix block is composed as follows: (1)
Consumer users’ requirements: data (h), query ID,
quality dimensions (i), aggregations (j), global query
priority (from Phase II), and quality dimension
priorities given by the users in Phase III (v.g.
consistency has a priority of “3” for Q101). (2) Data
producer users’ information: a sub-matrix indicating
requirements fulfillment for each available data
source. According to the degree of fulfillment, a
value is given (1, 3, or 9, (d) in Figure 1), using the
following criteria: “1” is given if the condition is
not fulfilled, “3” if the condition is not fulfilled, but
can be computed from the data in the source; and
“9” if the condition is fulfilled. (3) Data source
performance for each query ((e) in Figure 1). (4)
Global data source performance ((f) in Figure 1).
The local data source performance is:
PerfLocal (S,Q,D)
= ∑ pri
i *
rel
i
, where pri
i
=Data,
quality and aggregations priorities, for data D in
query Q ; rel
i
=Degree of fulfillment of data source S
for query Q and data element D;
The global data source performance is given by :
PerfGlobal (F,D)
= ∑ HierGlobal (Q
j
) * PerfLocal
(S,Q
j
,D), for all queres Qj involving data element
D;
HierGlobal(Q
j
): Global priority of query Q
j .
Example 2. For the matrix in Figure 1, the local
performance for data source A and query Q101 is
computed as: 5 * 9 + 5 * 9 + 5 * 9 + 1 * 9 + 3 * 9 +
5 * 9 + 2 * 9 + 5 * 9 + 5 * 9 = 324. The global
performance for source A is computed as: 130 *
324 + 31 * 144 = 46584.
Data source selection. A document with a ranking of
data sources for each data is generated. It will be
used in the final data source selection process.
Phase V – Document Generation With the
information collected in Phases I to IV, a set of
documents is generated, which are reviewed by the
different users in order to get a final agreement for
closing the requirements elicitation phase. These
documents are: (1) Query requirements document.
Contains all the queries obtained in phases I to IV,
ordered by global priority. Each query is qualified
with a value ranging from “1” to “3” (“1” means that
the query can be answered with the information
contained in the data sources); (2) DSS requirements
document, containing details of each query obtained
in the process; (3) DW Requirements documents. (4)
Preliminary data model: a preliminary version of the
star-schema model for the data warehouse. (5) Data
source requirements document. Contains the
information obtained in Phase IV.
6 SUMMARY
We showed that methodologies for operational
systems do not apply in the DSS setting. Thus, we
proposed DSS-METRIQ, a methodology that
provides an integrated, data quality-based process
for functional and non-functional requirements
elicitation. A relevant contribution of this work is
the data source selection method based on matching
information needs, data quality requirements and the
quality offered by the data sources.
Future research includes a web-based
implementation of the framework, and the
development of a data source selection engine that
can deliver different combinations of data sources
fulfilling data quality requirements.
ICEIS 2006 - INFORMATION SYSTEMS ANALYSIS AND SPECIFICATION
320
REFERENCES
Akao, Y. (1997). QFD, Past, present and future. Third
International QFD Symposium (QFD’97), Linköpin.
Basili, V., Caldiera, G. & Rombach, H. (1992). The goal
question metric approach. Computer Science
Technical Report Series. CS-TR-2956. University of
Maryland, College Park, MD.
Cippico, V. (1997). Comparison of the Decision Support
Systems and Transaction Support System
Development Methodologies. Advances in Database
and Information Systems (pp. 416-426), St.
Petersburg: Nevsky Dialect.
Hoxmeier, J.A. (2000) Database Quality Dimensions.
Journal of Business and Management, 7(1).
Jarke, M. & Y. Vassiliou. (1997). Data Warehouse
Quality: A Review of the DWQ Project. Information
Quality (pp. 299-313), Cambridge, MA: MIT Press.
Jarke, M., Lenzerini, M., Vassiliou, Y., & Vassiliadis, P.
(2003). Fundamentals of Data Warehouse. Berlin,
Germany: Springer-Verlag.
Paim, F. & Castro , J. (2002). Enhancing Data Warehouse
Design with the NFR Framework Proceedings of
WER2002, 40-57.
Paim, F. & Castro , J.(2003). DWARF: An Approach for
Requirements Definition and Management of Data
Warehouse Systems. Proceedings of the 11th IEEE
Int. Conference on Requirements Engineering, 75-84.
Prakash, N. & Gosain, A. (2003). Requirements Driven
Data Warehouse Development. Proceedings
CaiSE’03.
Vaisman, A. Data Quality-Based Requirements for
Decision Support Systems. In Data Warehouses and
OLAP: Concepts, Architectures and Solutions.
.PA-USA: Idea Group. To appear.
Wang, R.Y. (1992). Quality Data Objects. Total data
quality Management Research Program.
Wang, R. Y. & Strong, D.M. (1996). Beyond Accuracy:
What Data Quality Means to Data Consumers. Journal
of Management Information Systems, 12(4), 5-34.
Winter, R. & Strauch, B. (2003). A Method for Demand-
Driven Information Requirements Analysis in Data
Warehousing Projects. In HICSS-36 (pp.231-231),
Hawaii, USA: IEEE Press.
Winter, R. & Strauch, B. Information requirements
engineering for data warehouse systems. (2004).
Proceedings of SAC’04 (pp. 1359-1365), Nicosia,
Cyprus: ACM Press.
( a )
1 3 5
Q
uer
y
ID For
For Item
SOURCE SOURCE SOURCE
exists?
5 9 1 3
SALES
Range
5 9 1 3
Ranking
5
9 1 3
Accuracy
1 9 1 3
Consistenc
y
3
9 1 3
Com
p
letenes
5 9 1 3
Timeliness
2
9 1 3
Day
5 9 1 3
Month
5
9 1 3
324 36 108
Exists?
5 3 1 9
Range
5 3 1 9
Rankin
g
5
3 1 9
Accuracy
4 3 1 9
Consistenc
5
3 1 9
Completenes
1 3 1 9
Timeliness
3
3 1 9
Country
5 3 1 9
Provinc
e
5
3 1 9
City
5 3 1 9
Neighbour’d
5
3 1 9
144 48 432
46584 6168 27432
1º 3º 2º
Q101
Data
130
Q
uer
y
Priorities
Item
Q92
Data
31
Q
ualit
y
Q
ualit
y
A
gg
re
g
ations
( b )
( d )
( e )
( e
( f )
( c )
( d )
( h )
( i )
( j )
Data source selection ranking
A
gg
re
g
ations
Data ID
Figure 1: Quality Assessment Matrix.
REQUIREMENTS ELICITATION FOR DECISION SUPPORT SYSTEMS: A DATA QUALITY APPROACH
321
