
PROBABILITY OF OVERLOAD OCCURRENCE IN A SINGLE
CELL WCDMA SYSTEM
Marko Porjazoski, Borislav Popovski
Faculty of Electrical Engineering, University “Sts Cyril and Methodius”, Karpos 2 b.b., Skopje, R. Macedonia
Keywords: WCDMA systems, overload occurrence probability.
Abstract: A WCDMA (Wideband Code Division Multiple Access) system capacity usually is defined as maximum
number of simultaneous users satisfying QoS (Quality of Service) requirements. Radio interface
characteristics put a limit on number of supported users with specified QoS requirements. This paper
evaluates capacity of a single cell WCDMA system in multi service environment, considering no power
constraints in uplink. Furthermore it exposes the influence of number of users in the cell, traffic sources
activity, traffic intensity and QoS requirements on overload probability in single cell WCDMA system.
1 INTRODUCTION
WCDMA (Wideband Code Division Multiple
Access) is adopted as access technology in UMTS
(Universal Mobile Telecommunication System). In
WCDMA distinction between different users
transmitting in a common spectrum, is performed by
using a set of orthogonal spreading sequences
(Holma, 2001). The interference level increases with
the number of multiplexed user data steams. System
capacity and interference management are basic
problems in radio resource management research
(Kim, 2005)(Perez-Romero, 2005). WCDMA
system capacity has been analyzed by many authors
(Gilhousen, 1991)(Jerez, 2002) (Schuler, 2000),
considering no eventual overload occurrence. Using
some of their conclusions about WCDMA system
capacity limits, in this paper WCDMA system
performance are evaluated in the means of overload
probability. The overload in WCDMA system will
occur when the interference outreaches maximum
allowed value and system can’t guarantee the
required quality to the established transmissions.
Number of camping users in the system, traffic
sources activity and traffic intensity must be taken
into account for performance evaluation of
WCDMA systems, due to their influence on system
behavior.
The rest of this paper is organized as follows.
Section two presents WCDMA radio interface
characteristics. Then, a single cell capacity is
evaluated in outdoor and vehicular environment for
multi service operation. In section four, the overload
probability is evaluated by modelling a call arriving-
serving process as simple Markov chain. Section
five presents results from the analysis of overload
probability in isolated WCDMA cell, under different
conditions specified by number of camping users in
the cell, traffic sources activity and traffic intensity.
Last section concludes this paper.
2 RADIO INTERFACE
CHARACTERISTICS
WCDMA system capacity is limited by interference
at the receiver site introduced by users transmitting
simultaneously in the common bandwidth.
Let us consider an isolated cell. According to the
QoS requirements in uplink direction, received
E
b
/N
0
ration of the i
th
user must satisfy the following
inequality (Holma, 2001):
(
)
[]
i
o
b
iRN
ibi
N
E
PPP
RWP
⎟
⎟
⎠
⎞
⎜
⎜
⎝
⎛
≥
−+
,
(1)
∑
=
=
n
i
iR
PP
1
(2)
where (E
b
/N
0
)
i
is the required E
b
/N
0
ratio for the i
th
user, P
i
is i
th
user’s received power at the base
station, P
N
is the background noise power, W is the
spreading sequence chip rate, R
b,i
is the i
th
user’s bit
rate and P
R
is the total received power at the base
station.
139
Porjazoski M. and Popovski B. (2006).
PROBABILITY OF OVERLOAD OCCURRENCE IN A SINGLE CELL WCDMA SYSTEM.
In Proceedings of the International Conference on Wireless Information Networks and Systems, pages 139-142
Copyright
c
SciTePress
⎥
⎥
⎥
⎥
⎥
⎥
⎥
⎥
⎦
⎤
⎢
⎢
⎢
⎢
⎢
⎢
⎢
⎢
⎣
⎡
+
⎟
⎟
⎠
⎞
⎜
⎜
⎝
⎛
−
⎥
⎥
⎥
⎥
⎥
⎦
⎤
⎢
⎢
⎢
⎢
⎢
⎣
⎡
⎟
⎟
⎠
⎞
⎜
⎜
⎝
⎛
+
=
∑
=
n
j
j
b
jb
i
b
ib
N
i
N
E
RW
N
E
RW
P
P
1
0
,
0
,
1
1
11
(3)
Assuming equality conditions, combining equations
(1) and (2), the received power for the i
th
user’s
connection is given by equation (3).
Having in mind that received power has to be grater
then 0 , P
i
> 0, following inequality has to be
satisfied:
1
1
1
1
0
,
<
+
⎟
⎟
⎠
⎞
⎜
⎜
⎝
⎛
∑
=
n
j
j
b
jb
N
E
RW
(4)
3 CAPACITY OF A SINGLE CELL
Let us consider K user classes existing in the cell,
including on class of voice users and K-1 various
classes of data services. The voice user class
comprise K
v
users and each of data classes contains
K
d,j
users, where j = 1, 2, …, K-1 denotes difference
between data classes. Inequality (4) can be re-
written in the form:
() ()
1
1
1
1
1
1
11
,
1
,
,
<
+
⎟
⎟
⎠
⎞
⎜
⎜
⎝
⎛
+
+
⎟
⎟
⎠
⎞
⎜
⎜
⎝
⎛
∑∑∑
−
===
K
j
K
i
i
o
b
ib
K
i
i
o
b
ib
jd
v
N
E
RW
N
E
RW
(5)
Having in mind that all users that belong to the same
service class have same QoS requirements, R
b
and
E
b
/N
0
, equation (5) can be simplified:
() ()
1
1
1
1
1
1
1
,
,
,
<
+
⎟
⎟
⎠
⎞
⎜
⎜
⎝
⎛
+
+
⎟
⎟
⎠
⎞
⎜
⎜
⎝
⎛
∑
−
=
K
j
i
o
b
ib
jd
i
o
b
ib
v
N
E
RW
K
N
E
RW
K
(6)
Equation (6) specifies a WCDMA system capacity
plane in the K dimensional space (Kim, 2005). All
points (K
v
, K
d,1
, K
d,2
, …, K
d,K-1
) under this K
dimensional plane, represents possible combination
of supported users in voice and data user groups in a
cell.
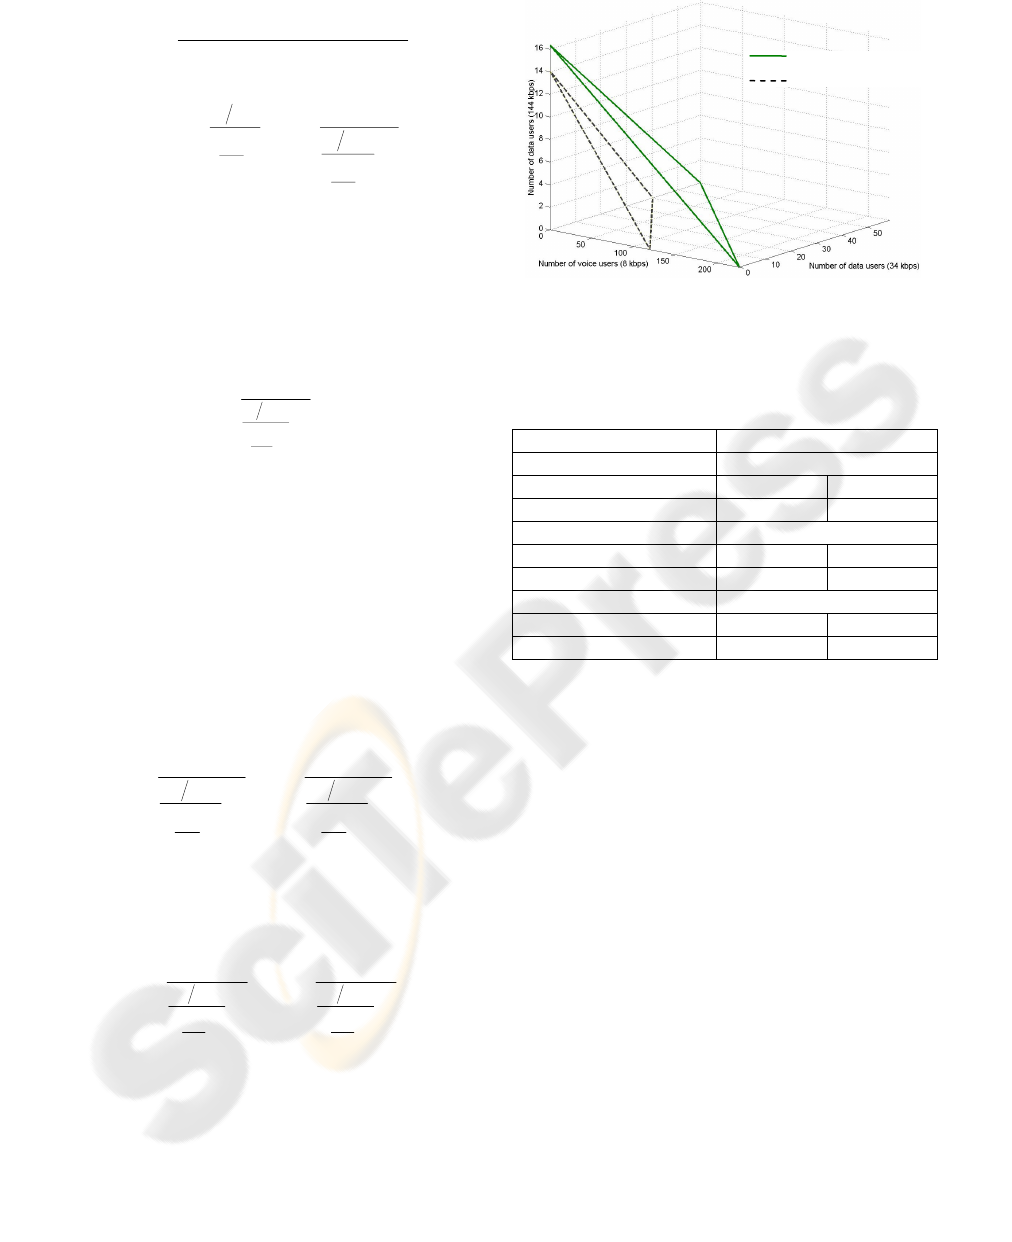
Figure 1: Three-dimensional capacity planes for the one
voice and two data user clases in outoor and vehicular
environment.
Table 1: QoS parameters for voice and data services
(3GPP TR 101 112-UMTS 30.03).
Service parameters QoS requirements in uplink
Voice Bit Rate 8 kbps
Environment Vehicular Outdoor
Target Eb/N0 6.1 dB 3.3 dB
Data service 1–Bit Rate 144 kbps
Environment Vehicular Outdoor
Target Eb/N0 3.1 dB 2.4 dB
Data service 2–Bit Rate 34 kbps
Environment Vehicular Outdoor
Target Eb/N0 4.6 dB 2.9 dB
According to equation (6) and QoS requirements for
three different services in vehicular and outdoor
environment (Table 1), we can plot three-
dimensional capacity planes for voice and two data
user classes (Fig. 1), in both vehicular and outdoor
environment. All possible combination of supported
users in the scenario with one voice and two data
user groups, in a single WCDMA cell, are
represented with points (K
v
, K
d,1
, K
d,2
) under this
three dimensional planes. The tree dimensional
plane, in fig. 1, sided by solid line, represents system
capacity boundary for outdoor environment. System
capacity in vehicular environment is limited by
plane narrowed by dashed line.
4 NUMBER OF CAMPING,
ACTIVE AND SIMULTANEOUS
USERS IN THE CELL
Overload occurs when the number of simultaneously
transmitting users becomes grater then maximum
allowed number of transmitting voice and data users,
determined by equation (4).
Outdoor environment
Vehicular environment
WINSYS 2006 - INTERNATIONAL CONFERENCE ON WIRELESS INFORMATION NETWORKS AND SYSTEMS
140

Figure 2: Markov chain describing call arriving-serving
process.
Let us consider that M users are uniformly
distributed in a cell. Call or session arrival process is
distributed by Poisson low with average rate of λ
calls/s per user, while call duration is exponentially
distributed with average value of 1/μ s.
A call arrival-call ending process can be described
with birth-death Markov chain (Kleinrock, 1975),
where the states are given by number of active users
(the users having a call in progress) (Fig. 2).
Birth and death coefficients, λ
N
and μ
N
, associated
with state N are given by:
λλ
)( NM
N
−=
(7)
μ
μ
⋅= N
N
(8)
Under conditions of equilibrium, the probability of
having N active users with call in progress is:
()
M
N
M
N
N
N
M
N
M
p
ρ
ρ
μ
λ
μ
λ
+
⎟
⎟
⎠
⎞
⎜
⎜
⎝
⎛
=
⎟
⎟
⎠
⎞
⎜
⎜
⎝
⎛
+
⎟
⎟
⎠
⎞
⎜
⎜
⎝
⎛
⎟
⎟
⎠
⎞
⎜
⎜
⎝
⎛
=
1
1
(9)
where ρ = λ/μ.
Traffic source behavior is usually characterized by
activity factor - α, representing the fraction of time
when the source is generating traffic. The
probability of having n users simultaneously
occupying radio interface, when N users are in call is
given by:
()
nN
n
Nn
n
N
p
−
−
⎟
⎟
⎠
⎞
⎜
⎜
⎝
⎛
=
αα
1
(10)
Therefore, the probability of n simultaneously
transmitting users, having M camping users in the
cell, can be computed as:
(
)
(
)
(
)
()
M
nMn
M
nN
NNnn
n
M
ppp
ρ
ρααρ
+
−+
⎟
⎟
⎠
⎞
⎜
⎜
⎝
⎛
==
−
=
∑
1
11
/
(11)
5 OVERLOAD PROBABILITY
Considering capacity constrains, overload
probability can be calculated as probability that
number of users transmitting simultaneously is
higher then maximum number of supported users
calculated by equation (4), i.e.:
∑
+=
=
M
Kn
nC
pP
1
max
(12)
where p
n
is a probability of heaving n simultaneous
users in the cell, given by equation (11), K
max
is
maximum number of supported voice and data users
calculated by (4) and P
C
is overload probability.
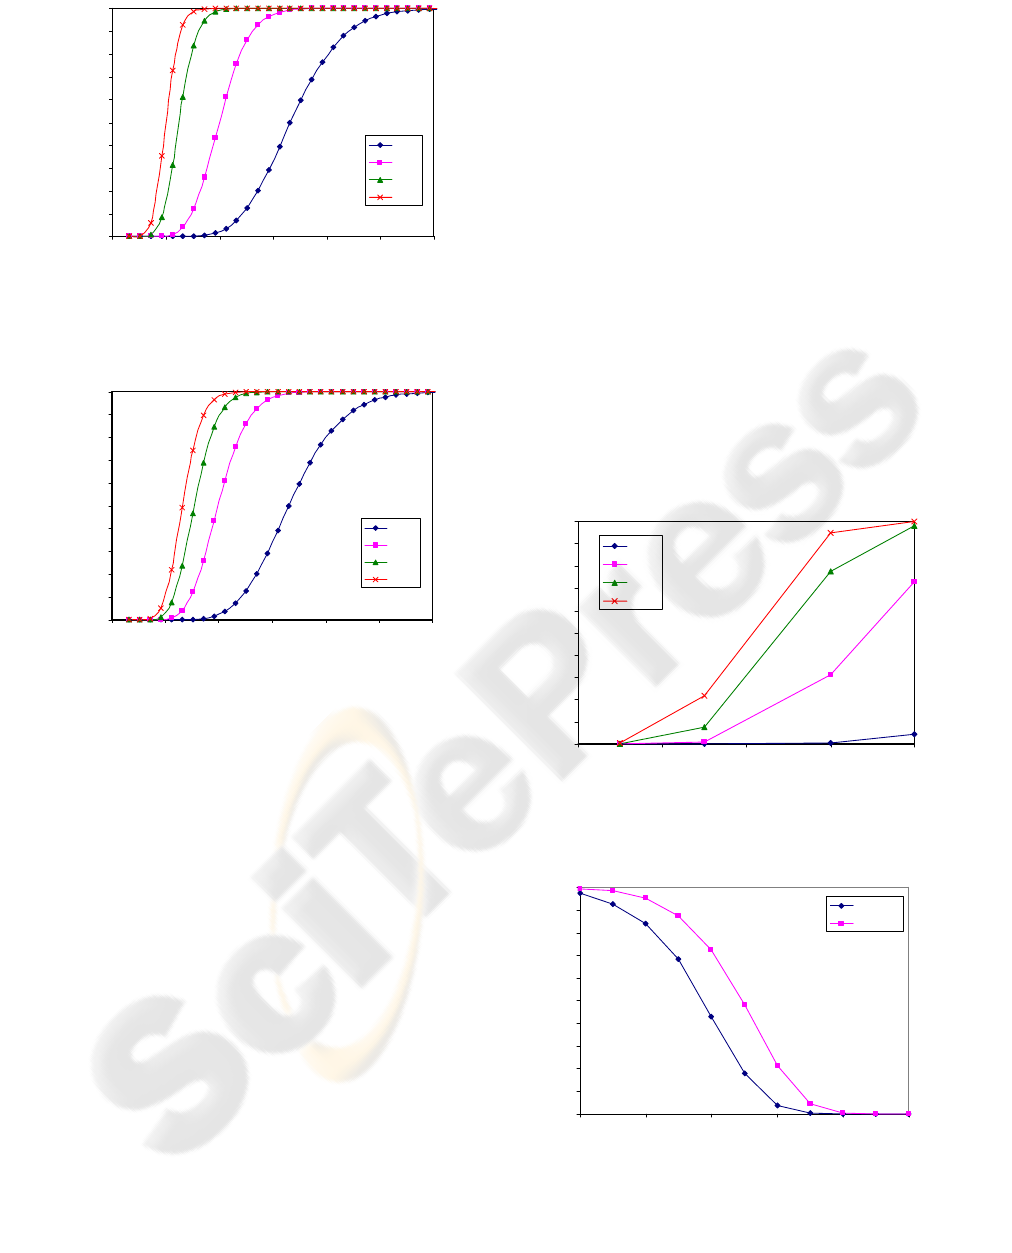
The probability of overload occurrence is examined
considering voice and class 1 data users, in outdoor
environment, under various scenario conditions
defined by: number of camping users in the cell,
traffic intensity and user activity factor. Figure 3
illustrates dependence of the overload probability on
number of class 1 data users camping in the cell and
various values for activity factor-α while traffic
intensity ρ=0.5. Dependence of overload probability
on number of data class 1 camping users and various
values for traffic intensity factor while α = 0.5 is
presented in figure 4. Overload probability
dependence on traffic intensity and activity factor
for M=55 data type 1 camping users in the cell is
represented in figure 5. The number of camping
users in particular cell depends on cell dimensions
and user density in the cell. It is obvious that, proper
cell dimensioning is required in order to satisfy and
guaranty recommended call blocking/dropping,
established by the network planner. On the other,
system capacity and overload probability depends on
mixture of various services offered to and utilised by
the users. Considering 300 users in the cell, figure 6
shows a dependence of overload probability on
percentage of users belonging to voice users group,
while rest of the users belong to data class 1. Traffic
intensity ρ=0.5 and activity factor α=0.5 are
considered for both voice and 144 kbps data group
in outdoor and vehicular environments. It is obvious
that probability of overload occurrence arises in both
environments by increasing the percentage of users
belonging to 144 bit/s data class, while keeping the
percentage of data users at the low level overload
probability is negligible.
6 CONCLUSIONS
In this paper first of all the capacity bound for uplink
of a single WCDMA cell has been derived for single
and multi service cases. When there is no
transmission power constrains engaged, the system
capacity is limited by the interference level. Also,
the capacity is strongly dependent on the mixture of
various services and their requirements.
PROBABILITY OF OVERLOAD OCCURRENCE IN A SINGLE CELL WCDMA SYSTEM
141
0
10
20
30
40
50
60
70
80
90
100
0 50 100 150 200 250 300
No. of camping users in cell
Overload Probability [%]
α=0.3
α=0.5
α=0.8
α=1
Figure 3: Overload probability dependence on number of
camping users in the cell and activity factor for traffic
intensity
ρ = 0.5.
0
10
20
30
40
50
60
70
80
90
100
0 50 100 150 200 250 300
No. of camping users in cell
Overload Probability [%]
ρ=0.25
ρ=0.5
ρ=0.75
ρ=1
Figure 4: Overload probability dependence on number of
camping users in the cell and traffic intensity for activity
factor
α = 0.5.
In the process of WCDMA radio network
planning, overload probability, defined as the
condition that number of active users in a cell is
higher then maximum number of users supported by
the radio interface, has to be taken into account.
It is shown that overload probability strongly
depends on number of camping users in the cell. On
the other hand, number of camping users depends on
cell size.
As an overall conclusion, the WCDMA cell size or
cell radius has to be selected according to the
planned call/session blocking and dropping
probability and particular services offered in that
cell.
REFERENCES
Holma, H., Toskala, A., 2001. WCDMA for UMTS, John
Wiley & Sons.
Kim, K., Koo, I., 2005. CDMA system capacity
engineering, Artech House.
Perez-Romero, J., Sallant, O., Agusti, R., 2005. Radio
Resource Management Strategies in UMTS, John
Wiley & Sons.
Gilhousen, K., Jacobs, I., Padovani, R., Viterbi, A.,
Weaver, L., Wheatley, C., 1991. On the Capacity of a
Cellular CDMA System, In IEEE Transaction on
Vehicular Technology, Vol. 40, No. 2, pp. 303-
311,May 1991.
Jerez, R., García, R., Estrella, D., 2002. Capacity Analysis
of Multicell CDMA Networks with Fast Power
Control under Multipath Fading, In Proceedings of
European Wireless 2002 (EW2002).
Schuler, J., Begain, K., Ermal, M., Mulet, T., Schweigel,
M., 2000. Performance Analysis of a Single UMTS
Cell, In Proceedings of European Wireless 2000.
3GPP TR 101 112-UMTS 30.03, Selection procedures for
the choice of radio transmission technologies of the
UMTS
Kleinrock, L., Queuing Systems, 1975. John Wiley &
Sons.
0
10
20
30
40
50
60
70
80
90
100
0.2 0.4 0.6 0.8 1
activity factor
Overload Probability [%]
ρ=0.25
ρ=0.5
ρ=0.75
ρ=1
Figure 5: Overload probability dependence on traffic
intensity and activity factor for M=55 camping users in the
cell.
0
10
20
30
40
50
60
70
80
90
100
0 20406080100
Percentage of total users number belonging to the voice
group
Overload Probability [%]
Outdoor
Vehicular
Figure 6: Overload probability in outdoor and vehicular
environment depending on percentage of users belonging
to voice/data group.
WINSYS 2006 - INTERNATIONAL CONFERENCE ON WIRELESS INFORMATION NETWORKS AND SYSTEMS
142
