
M-SHOW:A SYSTEM FOR ACCURATE POSITION
ESTIMATION IN MULTI-FLOOR BUILDINGS
Wu Ke, Zheng Zhong, He Liang, Gu Junzhong
Institute of Computer Applicaitons,East China Normal University, Shanghai,China
Keywords: Wireless LAN, Position Estimation, Fuzzy Empirical Sig
nal Model, AP Close-Range Threshold,
Pre-Locating, Joint-Probability Calculation, Fluoroscopy.
Abstract: This paper presents M-Show, a Wireless LAN based system for locating users inside multi-floor buildings.
It makes improvements in the sampling, processing and storing of empirical signals to previous studies, and
builds a Fuzzy Empirical Signal Model that gives more credible description of signal distribution. By
dividing the map into different sized Intelligent Areas (iAreas), M-Show is able to achieve alterable
positioning granularity within the same map. It also unprecedented adopts AP Close Range Pre-Locating
strategy to quickly locate the users inside a certain small scope around an AP. In addition, since statistical
calculation methods are inefficient in distinguishing vertically overlapping positions on different floors,
which is not tackled in previous locating systems, we introduce the Fluoroscopy to rectify the locating result
of probability calculation. M-Show is deployed in Shanghai Science and Technology Museum, and
experimental results show that with reduced average position query time and lower computation cost,
M-Show achieves a high locating accuracy of 93% probability within 3 feet around the user’s actual
position.
1 INTRODUCTION
As mobile computing devices and deployment of
local area wireless networks (WLAN) mushroom,
context-aware computing and service is becoming
practical. Applications that provide services related
with user locations, namely the Location-Based
Services (LBS), have gained growing popularity and
are developed increasingly complicated. Examples
of these services include map in the palm, which
displays on a cell phone or PDA screen the map of
the region around the user, and intelligent exposition
tourist, which intermittently locates the user and
guides him/her through the exhibition.
In this paper, we focus on methods of estimating
accurate
user position in multi-floor buildings with
WLAN. We studied the WLAN based locating
systems developed up to now, made improvements
to some methods presented, and put forward our
own novel solutions against new challenges.
The challenges that motivate us to develop
M-
Show include:
1) Are empirical signal models creditable?
In most WLAN based locating systems
d
eveloped by now, an empirical signal model is built
as a paradigm to which instant signals are compared
with (P.Krishnan et al., 2004). The idea is feasible in
less demanding applications. However, since radio
signal of WLAN is easily blocked or reflected by
shutting doors, closing windows, and even moving
human bodies, signal distribution is constantly
changing (Andrew Howard et al., 2003). A one-off
sample of a static position only represents signal
distribution of the moment; as time elapses, signal
distribution changes and the previous sample is no
longer authentic. Thus, it is essential to find a way of
signal sampling and storage to help eliminating the
influence on system performance cause by the
fluctuation of signal.
2) How to locate users in a multi-floor building?
Many systems have realized user locating on a
single flo
or (Paramvir Bahl et al., 2000). But users
move freely in buildings. When it comes to locate a
user who roves in a multi-floor building, are the old
methods efficient in settling new problems? How
should maps be organized for the convenience of
empirical signal storage? As the total area of system
deployment doubles and redoubles, how can we
eliminate the growth in the size of Empirical Signal
Model without loss in performance?
3) Are there crosscuts in positioning?
Among all previous systems, the probability
cal
culation has been the most popular method for it
complies with the instable nature of radio signal.
290
Ke W., Zhong Z., Liang H. and Junzhong G. (2006).
M-SHOW: A SYSTEM FOR ACCURATE POSITION ESTIMATION IN MULTI-FLOOR BUILDINGS.
In Proceedings of the International Conference on Wireless Information Networks and Systems, pages 290-297
Copyright
c
SciTePress

However, the calculations can become highly
complicated if a good accuracy is to be achieved,
and consequently the computation expense rises and
time of location query extends. Can we build a
crosscut in positioning, by which we can avert from
the arduous probability calculation every now and
then? By more intensive study of the rules of signal
propagation, can we find a method to quickly locate
the users in special areas, just like “finding the
islands in an ocean”?
2 RELATED WORK
Techniques used to track user location include GPS
(P.Enge et al., 1999), Mobile Cellular positioning
(S.Tekinay, 1998), infrared ray based locating
(R.Want et al., 1992), ultrasonic based locating
(N.B.Priyantha et al., 2000), and Wireless LAN
radio signal based locating (Paramvir Bahl et al.,
2000). GPS is excellent for outdoor user locating,
but since satellite signal is easily blocked by walls,
GPS is barely efficient for indoor user locating.
Mobile Cellular positioning has been widely used in
cell phone user tracking, but it can only tell the
approximate range of a user. Infrared and ultrasonic
signal based systems can achieve a higher accuracy,
but they require special sensor modules to work
which makes them expensive to deploy. Up to now,
Wireless LAN radio signal is the most popular
technique adopted in indoor position estimation
systems, because it can achieve good accuracy, and
the prevalence of Access Points (APs) and mobile
computing devices with WLAN access makes it easy
and inexpensive to deploy.
Many WLAN based location estimation systems
have been put forward over the years. The following
ones are generally considered typical and major.
RADAR (Paramvir Bahl et al., 2000) developed
by Microsoft Research was the earliest system to use
WLAN signal in indoor locating. It builds a radio
map and searches the k-best-neighbour of the
received signal, and the mean location of the k
neighbours is regarded to be the most probable
location of the user. The problem with RADAR is
that its computation cost is high since it searches the
whole radio map each time it does location
estimation. And it does not give very high accuracy.
HORUS (M.Youssef et al., 2002) regards the
strength of radio signal (rssi) as a statistical variable.
Via Bayes probability calculation, HORUS gained a
great advance over RADAR in accuracy. But a great
number of signals need to be sampled to form the
probability distribution formula, which makes
HORUS exhaustive to deploy.
Complex Systems Computation Group of
University of Helsinki (T.Roos et al., 2002)
presented Ekahau, which does locating by building
statistical model of WLAN radio signal. It studies
the rules of signal propagation and builds signal
attenuation models. Its performance is susceptible to
changes of the environment because it fails to shield
the instability of signal.
LOCATOR (A.Agiwal et al., 2004) gained better
accuracy over RADAR and HORUS by making
improvements in signal sampling and map
clustering. But since LOCATOR simply divides map
into uniform areas, computation cost raises
significantly as the granularity of clustering
increases.
3 M-SHOW
Our system for accurate in-building user locating,
M-Show, works in two phases. Firstly, a Fuzzy
Empirical Signal Model is built. It is a mapping
between stored sets of signals and the real physical
locations. It consists of radio signals of various APs
and the location where the signals are sampled. In
the second phase, instant signals are analyzed by our
four steps and an estimated position is returned as
the result. These two phases are described in greater
detail in the following subsections.
3.1 Fuzzy Empirical Signal Model
Building Phase
In this phase, a database is built that describes how
wireless signal propagates in the physical space
where Wireless LAN is deployed. It enables
M-Show to estimate user’s accurate position inside a
multi-floor building as described in section 3.2. In
the following subsections, how the map is
fragmentized into Intelligent Areas (iAreas) is
discussed, followed by the signal strength sampling
strategy, and then the methodology adopted for
marking an iArea with multiple sets of multiple
signal strengths from various APs.
3.1.1 Fragmentizing Maps into iAreas
Consider the following scenario: a position
estimation system is to be deployed on a floor of an
office building, as shown in Figure 1. For the
majority of the floor area, a positioning accuracy of
10 meters is demanded; in the two meeting rooms, 4
meter accuracy is required.
M-SHOW: A SYSTEM FOR ACCURATE POSITION ESTIMATION IN MULTI-FLOOR BUILDINGS
291
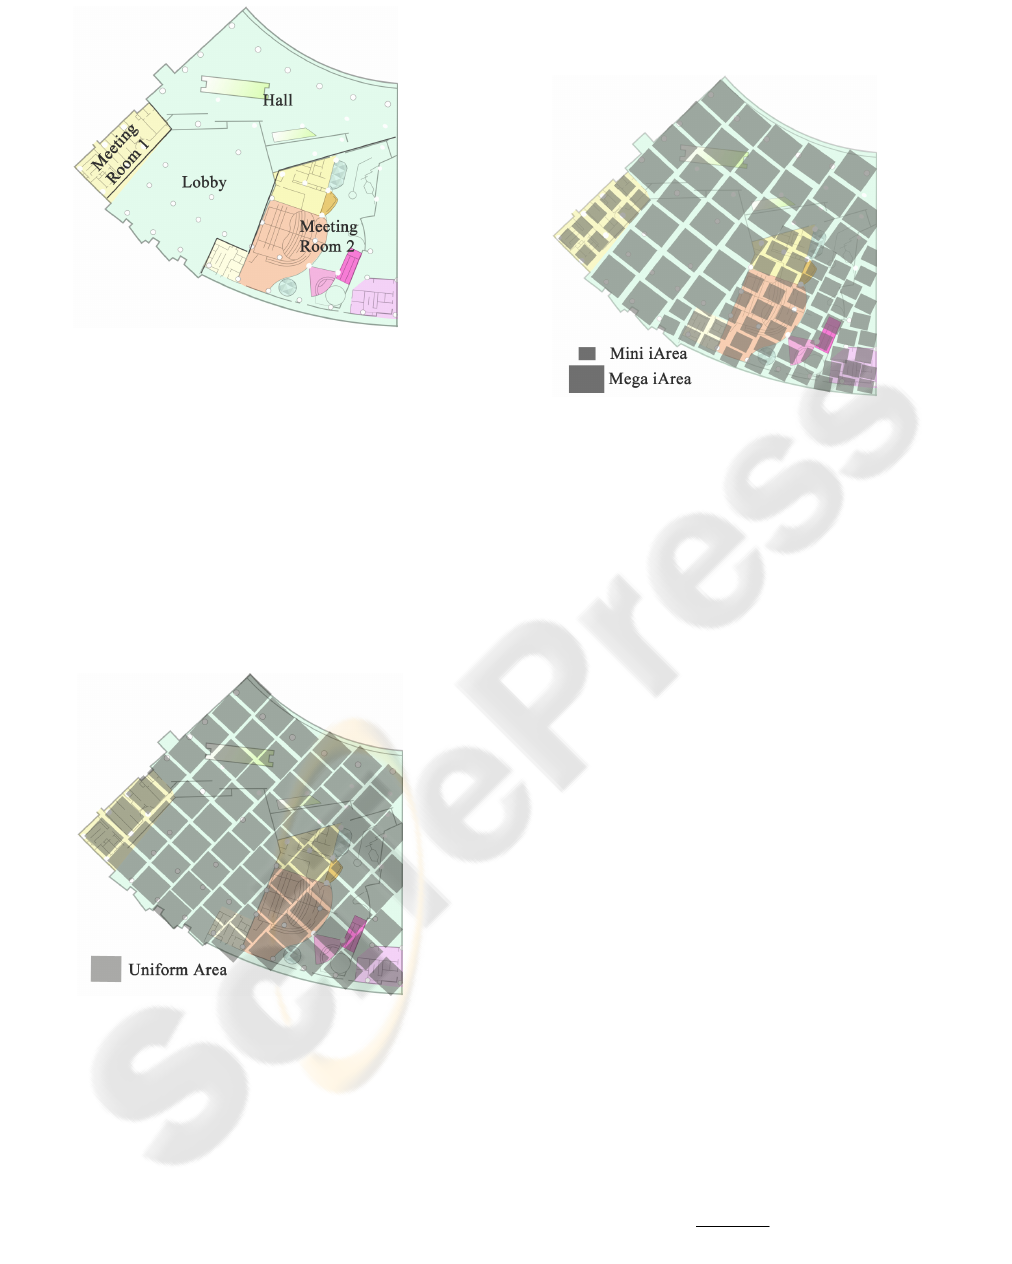
Consider adopting a traditional way of map
clustering (A.Agiwal et al., 2004). The entire site is
divided into 4-meter-diameter areas, as shown in
Figure 2, to guarantee the highest positioning
accuracy required, which is a notable waste of
system computing power. Assume that the system
rubs through anyhow; one day, the owner of the
building decides to increase the accuracy of the two
meeting rooms to 3 meters, so unfortunately the
whole map will have to be re-divided into
3-meter-diameter areas and what’s worse, the
sampling and radio map building for the whole floor
will have to be done all over again.
Now let’s see what happens in the scenario if
M-Show’s way of map fragmentation is used. Firstly
map of the floor is fragmentized into two kinds of
Intelligent Areas (iAreas): the two meeting rooms
are divided into 4-meter-diameter Smart iAreas, and
the rest part of the map 10-meter-diameter Mega
iAreas, as shown in Figure 3. Thus the required
positioning accuracy is guaranteed and system
computation power is put to best use. If accuracy of
the two meeting rooms needs to be increased, we
simply re-divide the two rooms into 3-meter iAreas
and redo the empirical signal sampling in the two
rooms.
How the map is divided into iAreas lies on the
granularity of positioning requires, but the following
are the basic rules:
Figure 1: Map of the Office Building.
Figure 3: Map Clustered into iAreas.
1) An iArea should be on one layer of the map.
2) iAreas should not overlap each other.
3) Adjacent iAreas should border on each other.
4) An iArea is larger than area of AP Close Range.
3.1.2 Sampling Strategy
The radio signal of Wireless LAN is highly
unpredictable and changeful due to the following
reasons:
1) Radio signal strength changes according to the
temperature, humidity and the moving of human
body.
2) Radio signal reflects, refracts and diffracts during
propagation indoors, which causes the “Multi Path
Effect”.
To avoid this feature being a bad influence on
position performance, previous systems have used
average value of samples (Paramvir Bahl et al.,
2000). But mere averaging the samples is not
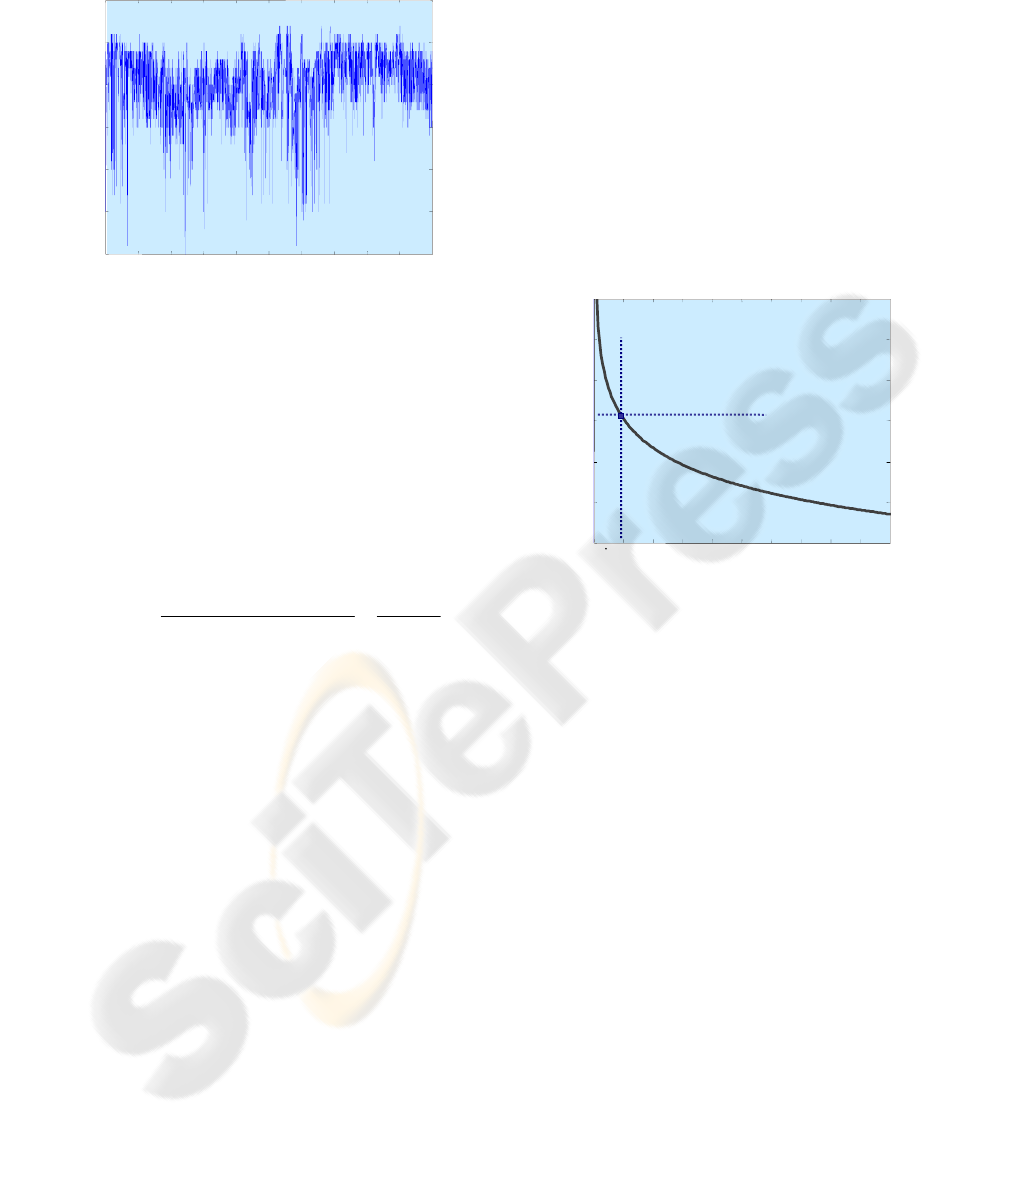
sufficient. Figure 4 shows the signal of an AP
sampled in 5000 times, with an interval of 1 second,
from which we can see that the signal does not
follow a particular mean strength. Thus M-Show
adopted a novel sampling strategy, which includes:
Figure 2: Map Clustered into Uniform Areas.
1. All-Orientation Sampling
Signal is collected with the sampler facing each
of the four orientations: the north, the west, the south
and the east. Then by processing the signals via
formula
n
rssi lg
rssi lg
n
1i
i
xDirection_
∑
=
=
, four figures are
WINSYS 2006 - INTERNATIONAL CONFERENCE ON WIRELESS INFORMATION NETWORKS AND SYSTEMS
292
obtained denoting each of the four orientations on a
certain location.
2. All-Time Sampling
We collect signals on deliberately selected
environmental conditions including: those with
rainy, sunny, cloudy and snowy weather; those with
dry, common and humid air; those with many
peopling walking all over the place, several people
moving and no people presents; with doors and
windows open and with doors and windows closed.
Signals collected are processed via the formula:
n
rssi
n
rssirssirssi
rssi
n
1i
i
n21
eTimeDivers
∑
=
=
+++
=
"
,
and all-time sample is obtained denoting the signal
on a certain location through all status of the space
possible.
3.1.3 Marking an iArea
Unlike previous systems where an area is marked
with signals from several APs, M-Show mark an
iArea with sets of AP signals. Firstly, we sample in
different location of the iArea, towards different
orientations, at different chosen times. Then, signals
collected in an iArea are organized to form such a
set: {{(mac
(E)_APi
, {rssi
(E)_APi_j
})}
k
}, where
(mac
(E)_APi
, {rssi
(E)_APi_j
}) presents the j empirical
signals from APi, and{(mac
(E)_APi
, {rssi
(E)_APi_j
})}
presents all signal sets of all APs observed in this
iArea.
To mark an iArea in such a redundant way
enables the system to be impervious to changes of
weather, moving of human bodies, and distinction of
user orientation. According to tests as described in
section 4, M-Show’s way of marking an iArea helps
the system give better position estimation
performance with even less computation expense.
3.2 Position Estimation Phase
In the position estimation phase, user’s mobile
terminal device periodically collects AP signals in
format of {(mac
(R)_APi
, rssi
(R)_APi
)}, and then the
system estimates the user location in four steps as
described in the following subsections.
5000 20 1000 2000 3000 4000
35
40
45
50
55
60
65
Signal Strength of an AP (-dBm)
Figure 4: Fluctuation of Signal during 5000 times o
f
Sampling.
3.2.1 AP Close Range Pre-Locating
Radio signal attenuates while propagation, as shown
in Figure 5, according to the following law:
Attenuation (d) = A
0
+ αlog (d) + X
σ
(Figure 3)
( d represents the distance between AP and the
receiver, A
0
and X
σ
are constants.)
0 3 6 9 12 15 18 21
-40
-10
-90
-80
-70
-60
-50
rssi
Threshhold
r
Threshhold
Signal Strength (dBm)
Distance between AP and Receiver (m)
Figure 5: Signal Attenuation in Free Space.
An AP Close Range Threshold (r
Threshold
) is an
area around the AP in which signal does not follow a
normal distribution. r
Threshold
of different APs vary
according to their power and other environmental
complications, its value commonly between 2 and 3
meters. rssi
Threshold
represents the average signal
strength on the circumference of the Close Range.
Because AP’s Close Range radius is smaller than
an iArea, if we can ascertain a user’s location in an
AP Close-Range, we can also tell which iArea
he/she is in. If we use iArea
(T)_APi
to represent the
iArea AP
i
’s Close Range lies in, the process of AP
Close Range Pre-Locating can be described as:
FOR ALL MEMBERS IN {(mac
(R)_APi
,
rssi
(R)_APi
)}
IF ∀j s.t. rssi
(R)_APj
≥ rssi
Threshold_APj
THEN RETURN Area
(T)_Apj
3.2.2 Empirical Signal Filtering Strategy
The multiple sets of signals M-Show uses to mark an
iArea represents signals a Mobile Terminal is likely
to receive under ALL environmental conditions: in
different weathers, with doors open and close, with
M-SHOW: A SYSTEM FOR ACCURATE POSITION ESTIMATION IN MULTI-FLOOR BUILDINGS
293
people moving all over or no people at all, and the
user facing north or east…and so on. However, as
far as a certain query of position is concerned, not all
the signals stored need to be used in calculation. In
order to cut down computation cost, An Empirical
Signal Filtering Strategy is adopted.
We use {(mac
(T)_APi
, rssi
(T)_APi
)} to represent
signal sets collected instantly by Mobile Terminal,
U
empi
={{(mac
(E)_APi
, {rssi
(E)_APi_j}
)}
k
} to represent the
empirical signals stored in Fuzzy Empirical Signal
Model, and U
prob
={{(mac
(U)_APi
, {rssi
(U)_APi_j
})}
k
}to
represent the set of signals which are screen out by
Empirical Signal Filtering Strategy. Let U
prob
initially equals U
empi
, and Empirical Signal Filtering
Strategy can be described by the following steps:
1. To eliminate empirical signal sets of the APs
who’s signal is not received by Mobile Terminal.
IF ∀ x,y s.t. mac
APx
∈{mac
(T)_APi
}&&
mac
APx
∉{mac
(E)_APi}y
THEN U
p prob
{(mac
rob
= U −
(E)_APi
, {rssi
(E)_APi_j
})}
y
2. To select one set out of all empirical signal sets of
each AP that is with the minimum vector distance
towards the observed signal set.
FOR EACH {(mac
(U)_APi
,{rssi
(U)_APi_j
})}
IN U
prob
AND FOR EACH mac
(U)_APi
IN {mac
(U)_APi
}
k
FIND |rssi
(R)_APi
−rssi
(U)_APi_z
|
=min {| rssi
(R)_APi
−rssi
(U)_APi_j
|},
(j=1 to SizeOf {rssi
(U)_APi_j
}
k
)
THEN{(mac
(U)_APi
, {rssi
(U)_APi_j
})}
k
={(mac
(U) ( k
- (mac
_APi
, {rssi
U)_APi_j
})}
(U)_APi
,{rssi
(U)_APi_j
})
+ ( mac
(U)_APi
, rssi
(U)_APi_z
)
3.2.3 Joint-Probability Calculation
At a static point outside AP Close Range, the signal
follows the normal distribution. The concept of
computing Joint-Probability is to aggregate all
probabilities of the user’s presence in each iArea and
to select the one iArea with the highest probability.
To do this, we take the following three steps:
1. To compute the Singular Probability Set of each
iArea
Here we use {{(mac
(U)_APi
, rssi
(U)_y_APi)
}
j
} to
represent iArea
y
’s empirical signal set obtained by
Empirical Signal Filtering. If the signal received
from AP
x
is rssi
APx
, the probability of the user being
in iArea
y
is:
⎟
⎟
⎠
⎞
⎜
⎜
⎝
⎛
⋅=
2
2
(j)(U)_y_APx_APx
xy
2
)rssi-(rssi
-exp
2
1
)(Prob
σ
πσ
j
, σ
2
is
the variance of AP
x
’s signal in iArea
y
.
If Mobile Terminal fails to receive signal from
AP
x
(or the signal is simply to weak to be sensed),
M-Show adopts a compensatory value called
Not-Null-Probability as a substitute of the singular
probability. The Not-Null-Probability of AP
x
’s
signal in iArea
x
is the possibility that Mobile
Terminal can receive AP
x
’s signal inside iArea
x
. For
example, among all signal sets collected in iArea
x
,
30% of which contain AP
x
’s signal, then the
Not-Null-Probability of AP
x
’s signal in iArea
x
is 0.3.
2. To calculate the Joint-Probability of each iArea
By calculation of each iArea’s singular
probability set, a Singular Probability Matrix is
formed, as shown in Figure 6.
{Prob
11
(i)} {Prob
12
(i)} … {Prob
1n
(i)}
{Prob
21
(i)} {Prob
22
(i)} … {Prob
2n
(i)}
… … … …
… … … …
{Prob
m1
(i) } {Prob
m2
(i)} … {Prob
mn
(i)}
AP
1
AP
2
…
…
AP
m
Area
1
Area
2
… Area
n
Figure 6: The Singular Probability Matrix.
We compute the Joint-Probability of an iArea by
multiplying each element of its Singular Probability
Set:
)(Prob)(Joint_Prob
jx
mj
1j
x
ii
≤
=
Π=
. Find s, t, so that
)}(Joint_Prob{max)(Joint_Prob
js
AreaArea
kt
=
,
(s,j∈{1 to n};
t,k∈{1 to SizeOf{ }}), then iArea
)(Joint_Prob
Area
i
j
s
is the position estimation result of Joint-Probability
Calculation.
3.2.4 Fluoroscopy: Shadow iAreas
Distinguishing Strategy
When deploying a locating system in a multi-floor
building space, the problem we call “Shadow iArea
Problem” arise. Shadow iAreas are two or more
iAreas that do not lie on the same floor of the
building, but vertically superpose each other.
Because of their geographical being, it is difficult for
the system to perceive distinctly between them in
that:
z signals received in these iAreas are mostly
from the same APs;
z signal of a certain AP received in these iAreas
are close to one another in value.
Joint-Probability Calculation can be inefficient in
distinguishing Shadow iAreas for the calculation
WINSYS 2006 - INTERNATIONAL CONFERENCE ON WIRELESS INFORMATION NETWORKS AND SYSTEMS
294
result represents an estimation in which each AP’s
signal contributes the same weight of effect, it is
weak in capturing subtle difference of AP’s signals
received in Shadow iAreas.
Thus M-Show adopts a remedy strategy called
the Fluoroscopy to track down the nuance. By our
observation, there is always at least one AP’s signal
that differs distinctly in Shadow iAreas. In Empirical
Signal Model Building Phase, we pay special
attention to these APs and mark them as
“Fluorescence AP” of the Shadow iAreas. After
Joint-Probability Calculation, we check whether the
result iArea is a Shadow iArea. If so, all iAreas that
forms its shadows are listed, and signals of their
Fluorescence AP stored in the Empirical Signal
Model is compared with the signal strength actually
received by Mobile Terminal. Finally, the iArea with
the closest Fluorescence AP signal is selected and
returned as the final position estimation result.
4 SYSTEM EVALUATION
In this section, the setup of M-Show is described,
including the devices’ setup and choosing of their
models, along with the enumeration of system’s
parameters. A detailed system performance
evaluation is offered in comparison with other
WLAN based position estimation systems.
4.1 System Layout
M-Show System is part of the Shanghai Science and
Technology Museum construction project. M-Show
deployed Wireless LAN on the 2nd and 3rd floor of
the museum, with a total site area of 18,000 m
2
.
We adopt iPAQ 2210 Personal Didigital
Assistant as the Mobile Terminal device. SanDisk
WiFi-128M SD Card (-83dBm, 11Mbps) is used in
iPAQ to collect Radio Signal Strength, and it also
works as an extension of iPAQ’s limited memory.
AboveCable ACAP2010-11/H and ACAP1800-LS
are our chosen AP models. APs are placed on roofs,
and horizontal distance between two neighbour APs
is 7-20 meters on average.
The Mobile Terminal receives 10 to 30 AP’s
signals in one scan. We choose the top 16 rssi to do
Empirical Signal Filtering (i.e., n=16). According to
experimental analysis, r
Threshold
of an AP is 2 meters.
The site map is divided into iAreas of two sizes,
with diameters of 3 meters and 6 meters.
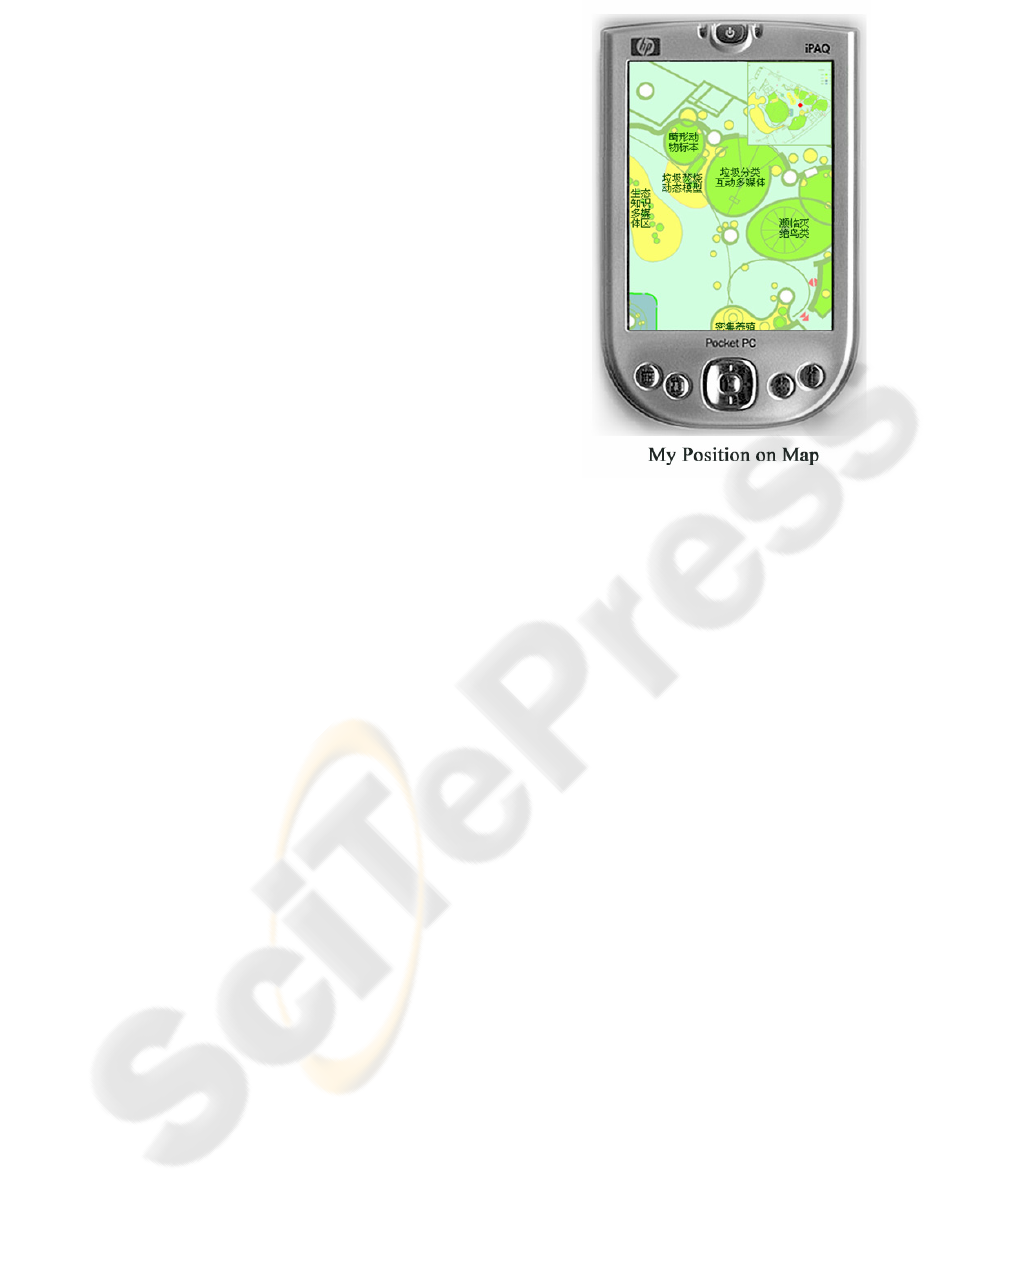
Figure 7 is the screen display of Mobile Terminal
when M-Show estimates the user position. The
square on right-top of the screen is a map of the
museum section where the user locates, and the red
dot represents his/her current position. The main part
of the screen is a more detailed map of only a few
meters around the user.
Figure 7: Snapshot of M-Show’s Mobile Terminal Screen.
4.2 Performance Evaluation
In this section, a performance comparison is made
between M-Show and other Wireless LAN based
position estimation systems.
We compared performance among M-Show and
analogous WLAN based systems by estimating the
average times of computing of the three systems.
The test is done on the premise that they are
deployed on the same region of a floor, and they
give the same positioning accuracy. M-Show
clusters the map of the region into two kinds of
iAreas: the 3-meter Smart iAreas and the 6-meter
Mega iAreas, with the ratio of 6:4. As for
LOCATOR and RADAR, the map is divided to
4-meter areas. The numbers in Figure 8 are average
values of the 300 times tests we take, and the times
of computing for each position query is the synthesis
of computing times each system takes to do the
M-SHOW: A SYSTEM FOR ACCURATE POSITION ESTIMATION IN MULTI-FLOOR BUILDINGS
295
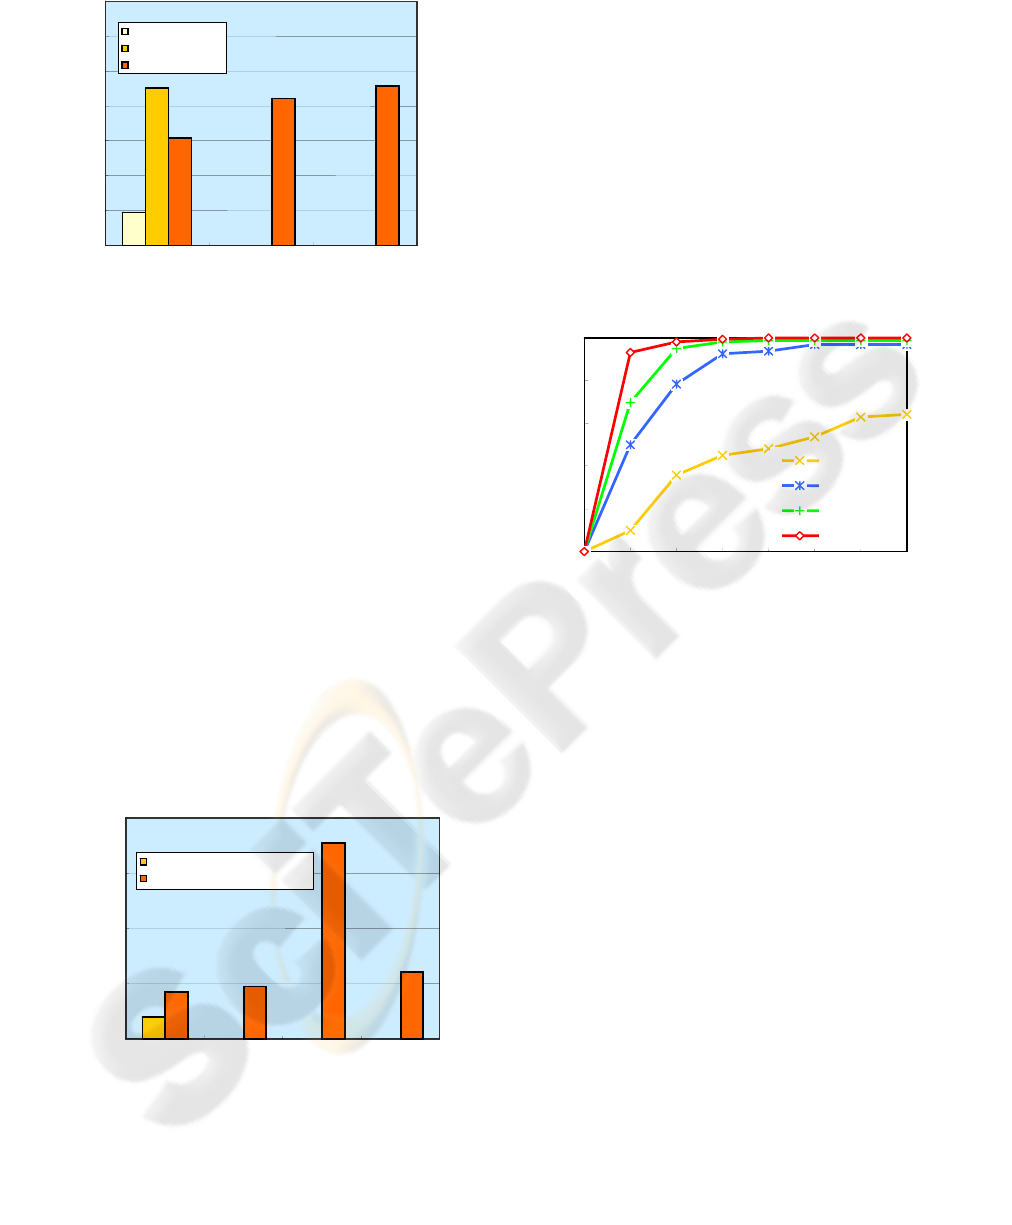
database searching and result revising.
From the darkest bars shown in Figure 8, we can
see the average times of computing M-Show needs
to process a position query is significantly below
those of other systems. This is credited to the
Intelligent Area Clustering that M-Show has
adopted. We can see from the central bar of M-Show
that although the times of computing needed to
locate users in Smart iAreas is slightly higher than
the other systems, but to be fair, the Smart iAreas is
originally of a higher granularity than the others.
More importantly, the performance of M-Show in
locating users within Mega iAreas is especially
commendable, that it takes only less than 100 times
of computing. This is attributed to the Empirical
Signal Filtering strategy adopted by M-Show, by
which M-Show is able to easily throw off the less
possible iAreas and commit to the probability
calculation and comparison among the most
probable ones.
The performance of the four systems is evaluated
in terms of the time it takes each of them to response
to a position query. To be fair, we configured the
four systems to the approximately the same
positioning accuracy and system load. The four
systems are run under same hardware settings, and
we record the time a query for position comes in and
the output of the result, and time elapsed between
them is recorded. The result shown in Figure 9 is an
average of 300 times test and record. And for 102
times among the 300 times of query, the user is
located to AP Close Range. We can see from the
darker bars shown in the picture, that the average
time M-Show uses to process a position query is
shorter than LOCATOR and RADAR, and
significantly shorter than HORUS. And thanks to the
AP Close Range Pre-Locating strategy M-Show
adopts, when the user is standing right near an AP,
the time taken for M-Show to do the locating is
remarkably shorter than the other systems.
Figure 8: Average Times of Computing in Various
Systems.
Average Computing Workload (times)
0
100
200
300
400
500
600
700
M-Show LOCATOR
RADAR
Mega iArea
Smart iArea
Average
0
0.2
0.4
0.6
0.8
1
0 3
6 9
12 15
18
21
RADAR
HORUS
LOCATOR
M-Show
Error Distance (feet)
Probability
Figure 10: Error Distance CDF in Various Systems.
Finally, a comparison of the cumulative
distribution function (CDF) among the four systems
is provided. It needs to be mentioned that because
the other systems measure their accuracy in feets,
M-Show also altered its measuring unit to feets.
Since M-Show estimates the iArea of user location
instead of a single point, we regard the error of
locating is half the diameter of an iArea. As
observed from Figure 10, M-Show gives 93%
accuracy to within 3 feet while LOCATOR gives
70% accuracy, HORUS 50% and RADAR 10%.
Within 6 feet range, M-Show gives a 97% accuracy
while the figure for LOCATOR, HORUS and
RADAR is 95%, 78% and 36%.
Figure 9: Average Query Processing Time of Various
Systems.
Average Query Response Time (ms)
0
20
40
60
80
M-Show LOCATOR HORUS
M-Show Pre-Locating
M-Show Average
RADAR
5 CONCLUSIONS
In this paper, we have presented M-Show, an
advanced WLAN based position estimation system
in multi-floor buildings, and performance evaluation
against analogous systems is also provided.
M-Show assimilates the efficient methods
adopted in previous systems, made improvements to
WINSYS 2006 - INTERNATIONAL CONFERENCE ON WIRELESS INFORMATION NETWORKS AND SYSTEMS
296

them and forms a novel position methodology.
Furthermore, M-Show analyzes the new problems
which rise in more demanding applications and
developed strategies to handle them, which provides
a precedent for the future research and systems.
M-Show presented a Fuzzy Empirical Signal
Model that records empirical signals sampled in a
variety of environment conditions, which gives more
comprehensive and authentic description of radio
signal distribution under different environmental
conditions. Also, M-Show made improvements to
the traditional ways of map clustering, by dividing
the map into Intelligent Areas (iAreas), the size of
which can change according to the granularity
required. The idea enables a variable positioning
granularity within the same map. In the position
estimation phase, M-Show utilizes the regulation of
propagation of an AP’s signal, and developed a
position pre-determining strategy called AP Close
Range Threshold, which can easily discover users
who are close to APs. M-Show also made advances
in the Joint-Probability Calculation by the
introducing of the parameter Not-Null-Scale, which
makes the probability calculation more credible.
Last but not least, M-Show developed a strategy
called the Fluoroscopy to distinguish vertically
overlapping positions of different floors.
We deployed the system of M-Show in Shanghai
Science and Technology Museum, China.
Experimental results show that M-Show achieves a
high locating accuracy of 93% probability within 3
feet around the user’s actual position with lower
computation cost.
In the future, we plan to do in-depth study on the
technology of data structure and compressed data
storage to further reduce the size of our Fuzzy
Empirical Signal Model. In addition, we will try
increasing the granularity of iArea, and deforming
iAreas to improve system adaptability, and analyze
how the probability calculation process should be
polished to meet more exquisite requirements of
future applications.
REFERENCES
Paramvir Bahl, Venkata N. Padmanabhan, 2000, RADAR:
An RFBased In-Building User Location and Tracking
System, in Proceedings of IEEE INFOCOM.
Paramvir Bahl, Venkata N. Padmanabhan, 2000,
Enhancements to the RADAR User Location and
Tracking System, in Technical Report
MSR-TR-2000-12, Microsoft Research.
Paramvir Bahl, Venkata N. Padmanabhan, 2000, A
Software System for Locating Mobile Users: Design,
Evaluation, and Lessons, in Technical Report
MSR-TR-2000-12, Microsoft Reasearch.
M. Youssef, A. Agrawala, A. U. Shankar, S. H. Noh, 2002,
A Probabilistic Clustering-Based Indoor Location
Determination System, University of Maryland,
College Park, Tech. Rep. UMIACS-TR 2002-30 and
CS-TR 4350.
M. Youssef, A. Agrawala, A. U. Shankar, 2003, WLAN
Location Determination via Clustering and
Probability Distributions, in Proceedings of IEEE
Conference on Pervasive Computing and
Communications.
M. Youssef, A. Agrawala, 2002, Small-scale
Compensation for WLAN Location Determination
Systems, in Proceedings of IEEE Networking and
Communications Conference.
T. Roos, P. Myllymaki, H. Tirri, P. Misikangas, J.
Sievanan, 2002, A Probabilistic Approach to WLAN
User Location Estimation, International Journal of
Wireless Information Networks.
T. Roos, P.Myllymäki, H.Tirri, 2002, A Statistical
Modeling Approach to Location Estimation, IEEE.
Transactions on Mobile Computing.
A.Agiwal, PA.Khandpur, H.Saran, 2004, LOCATOR-
Location Estimation System For Wireless LANs, in
WMASH’04.
P.Krishnan, A.S.Krishnakuar, Wen-Hua Ju, C.Mallows,
S.Ganu, 2004, A System for LEASE: Location
Estimation Assisted by Stationary Emitters for Indoor
RF Wireless Networks, in Proceedings of IEEE
INFOCOM.
P. Enge, P. Misra, 1999, Special issue on GPS: The
Global Positioning System, in Proceedings of the
IEEE.
R. Want, A. Hopper, V. Falco, J. Gibbons, 1992, The
Active Badge Location System, ACM Transactions on
Information Systems archive Volume 10.
N. B. Priyantha, A. Chakraborty, H. Balakrishnan, 2000,
The Cricket Location-Support system, in Proceedings
of 6th ACM MOBICOM.
S. Tekinay, 1998, Special issue on Wireless Geolocation
Systems and Services, IEEE Communications
Magazine.
Andrew Howard, Sajid Siddiqi, Gaurav S. Sukhatme,
2003, An Experimental Study of Localization Using
Wireless Ethernet, the 4th International Conference on
Field and Service Robotics.
M-SHOW: A SYSTEM FOR ACCURATE POSITION ESTIMATION IN MULTI-FLOOR BUILDINGS
297
